 (400 x 100 px) (4)")

Growing up in the 2000s, it felt like Australia won EVERYTHING in cricket—World Cups, Champions Trophies, the Ashes, Commonwealth, women’s, men’s, U-19—you name it.
Likewise, the USA, China, Russia, Great Britain, Australia, and France dominate the Summer Olympics. Every. Single. Time.
Why do these countries keep winning? And why doesn’t Djibouti rack up more medals? (For the record, Djibouti won a solitary bronze in 1988 Men’s Marathon).
The easy answers? These developed nations have better facilities, grassroots programs, and a robust ‘sporting culture’. But can we quantify this?
By applying Maslow’s Hierarchy of Needs to the economies of the 12 Test-playing cricket nations, 9 FIFA World Cup powerhouses, and six summer Olympic titans, I will create an economic hierarchy for international sports and uncover what it takes for a nation to consistently dominate the global stage. Here are the main questions I’m tackling today:
- What is the minimum GDP per capita threshold required for a nation to achieve its first global sporting glory?
- How rich must a country win to dominate one team sport?
- At what economical threshold does a country go from a one-sport nation to a “sporting culture” like Australia, Russia, China, or the United States?
Let’s begin.
Key Takeaways
- To secure its first major team sporting achievement or an Olympic medal, a nation must meet a minimum GDP per capita of $75-$250. Pakistan won an Olympic gold in field hockey in 1960, when their GDP per capita was just $82. Brazil’s GDP per capita was $235.6 in 1960 when they rose in football, India was at $296 in 1983, Sri Lanka – $776.2 (1996), and Afghanistan was at $560.6 when they qualified for the 2010 T20 World Cup.
- To become a dominant ‘one-sport’ nation, the GDP per capita must rise to a minimum of $1000-$2500.
- West Germany’s GDP increased from $1162.7 in 1960 to $5659.7 in 1974, by which team they had won two World Cups. When Argentina won again in 1986, they had amassed $3436.1 GDP per capita. Brazil reached $3298 by 1994.
- Jamaica’s GDP per capita rose from $1632 in 1988 (two Olympic medals) to $5029.8 in 2008 (11 medals).
- India’s GDP per capita rose from $544.1 in 2003 to $1021.9 in 2007 before they were able to launch the IPL.
- When a nation reaches a minimum of $15,000 GDP per capita, a Global Hunger Index (GHI) < 5, and a poverty rate of less than 2%, they are able to rise to an Olympic and multi-team sport supergiant. China’s current GDP per capita is $13,870. They reduced their GHI from 13.4 in 2000 to <5 by 2016. Australia’s GDP per capita almost double from about $20,000 to $40,000 between 1999-2007, and currently have a GDP per capita of $67,980.
Table of Contents
- Maslow’s Hierarchy of Needs
- My Theory on Economics of Sporting Dominance
- Economic Trends of
- Final Thoughts
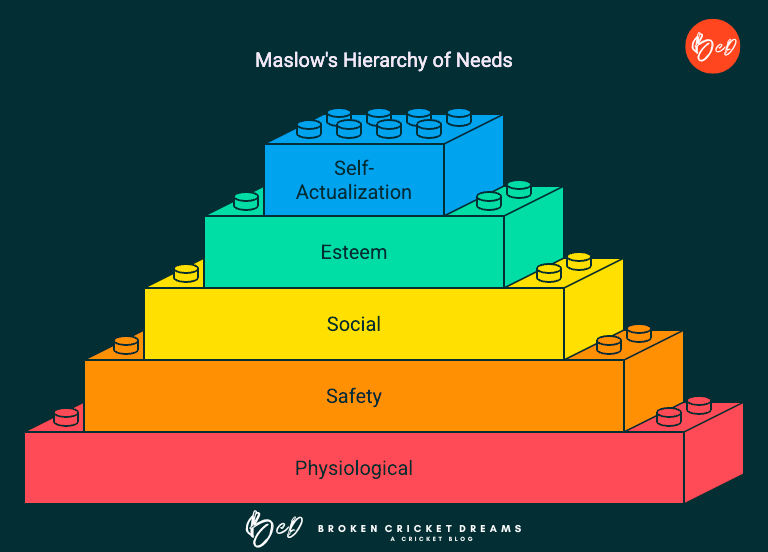
Maslow’s Hierarchy of Needs: A Brief Lesson
American psychologist, Abraham Maslow, proposed a model that distributed human behavior into five distinct levels:
- Physiological Needs: Essentials like food, water, and shelter.
- Safety: Security, financial stability, and health.
- Love & Belonging: Relationships, intimacy, and connections.
- Esteem: Self-respect, status, and recognition.
- Self-Actualization: The pursuit of reaching one’s full potential.
The first two represent an individual’s ‘basic needs’, the next two are the ‘psychological needs,’ and the final level focuses on ‘self-fulfillment needs.’
My Theory on the Economics of Sports Dominance
The First Stage: Individual Triumphs
In a nation-state’s early stages, sporting success begins with individual pioneers who overcome socioeconomic hardships and limited infrastructure to achieve greatness. The only prerequisite is that the individual’s physiological needs are met during their physical growth. Think Milkha Singh’s story, rising against odds in post-Partition independent India to reach 4th in the 1960 Rome Olympics in the 400 meters.
The Second Stage: One-Sport Nations
As the nation progresses economically, it has the potential to become ‘one-sport’ nation based on cultural influences and accessible sports (for example, cricket in the British colonies, soccer globally). These teams often include athletes from both affluent and underprivileged backgrounds. Families meet Maslow’s safety needs, which enables the next generation to pursue sports. Think Pele’s Brazil in the 1960s or Sunil Gavaskar/Kapil Dev’s 1983 Indian cricket team).
The Third Stage: Middle Class Expands
Sustained economic growth strengthens the middle class, allowing nations to dominate in one sport and venture into others. By this stage, nations fulfill belonging and esteem needs, earning global respect among the sporting fraternity. Think China at the turn of the 21st century or India in the late 2000s.
- The IPL in 2008 would not have been possible without India’s economic liberalization in 1991. Not only did the depth of Indian cricket increase drastically, the pool of business class citizens also increased—individuals who could afford to bet on the idea of the IPL.
- This middle class and business growth also allowed India to form leagues like field hockey & Kabaddi and start winning individual Olympic medals in wrestling, badminton, gymnastics, shooting, etc.
The Fourth Stage: Cross-Sport Dominance
This can be a tricky transition phase for several nations due to population or limited resources. Dominating across multiple sports requires major investments across different sports, political will, and hosting global events. Before self-actualization, this can lead to a ‘Sleeping Giant’ phase. This is also the stage where nations typically begin excelling in women’s sports, as increased infrastructure and societal progress open doors for female athletes to thrive.
The All-Blacks from New Zealand may dominate rugby, the Kiwis and White Ferns are always competitive in cricket, and they win 10-20 Olympic medals every cycle, but with a population of 5 million, how much farther can they go?
The Fifth Stage: Self-Actualization
Decades of stability produce generations of affluent citizens, near-zero poverty, and world-class infrastructure. Athletes have the resources and environment to reach their full potential. Think the USA, USSR at the height of the cold war, China currently, Great Britain, Japan, and Australia.
Exceptions to the Rule
These conditions are the bare minimum necessary to be competitive. The reverse is not necessarily true. Economic stability does not guarantee sporting success.
- For example, the men’s USA team still struggles to reach the Round of 16 after 40 years of investment, hosting the 1994 FIFA World Cup, and the MLS.
- Adequate GDP per capita and strong sports culture does not guarantee success either. Mexico has a GDP per capita of ~ $13,360 and a bustling soccer scene. South Africa has a GDP per capita of $6,500 and a thriving cricket culture. Neither have won World Cups in these sports.

Economic Trends of Various Sporting Teams (1960-Present)
We look at economies of the top countries who have played cricket, soccer, and achieved Olympic greatness.
Note: These countries also overlap with countries who tend to dominate field hockey, basketball, and ice hockey (except Finland). Baseball dominated countries (Cuba, Puerta Rico, Venezuela) golf & Winter Olympics (less accessible, high-end sports) are out of scope for this study.

Which Socioeconomic metrics do we look at and how were they collected?
We consider the following current socioeconomic stats:
- GDP (Gross Domestic Product), population, GDP per capita, and if applicable, percentage of population under poverty, and Global Hunger Index (GHI).
- GDP per capita can be skewed if there is high income inequality in the country. Hence, we also look at poverty rates and GHI to gauge a better picture of the population set.
- Higher GDP and GDP per capita indicate stronger relative economy. Lower poverty rates and GHI levels reflect improved societal well-being.
Poverty rates are presented according to (1) World Bank’s 2017 data, where the extreme poverty line was defined as $2.15/day. Another poverty line, population under poverty (national) is presented if a nation’s self-defined poverty line is above the World Bank rate.
We source the current statistics from the IMF (International Monetary Fund) and the historical GDP per capita levels from the World Bank. The data is available from after 1960, when the World Bank started collecting this data. This coincides with the post-World War II era, when several nations became independent. World Cups were also beginning to take shape during this time.
Other Notes:
- If GHI is not mentioned, that means the country is not analyzed by GHI (These are mostly first world countries that do not have hunger issues)
- We combine results for Great Britain (Olympics), United Kingdom (GDP data), and England (1966 FIFA World Cup win, multiple cricket World Cup wins) under the same section.
- I’ll use soccer instead of football for the rest of the article.
- The sporting achievements listed are not an exhaustive list – just significant achievements spaced out to see trends in GDP.
All the sources we looked at are linked at the bottom of the article for your kind perusal.
Embed from Getty ImagesTop 12 Richest Test Playing Cricketing Countries by GDP Per Capita
We begin by the 12 Test playing nations, ordered by 2025 GDP per capita.
For some countries, we also look at the GDP per capita at different points in their sporting history.
1. Ireland ($107,240)
Multi-sport nation
What was Ireland’s GDP per capita range at their first major sporting event? $2,516.9 (1974 Five Nations Rugby Union Championship, their first in the modern era, 10th since 1910). Their GDP per capita increased to $61,396.4 by the time they upset Pakistan in the 2007 ODI World Cup.
Ireland’s Current Socioeconomic Stats
- GDP: $587.23 Billion
- Population: 5.48 Million
- GDP Per Capita: $107,240
- Population Under Poverty (World Bank): 0.06% (2021)
- Population Under Poverty (National): 14% (2021)
2024 Paris Olympic (Total Medals): 7
Most Popular Sports in Ireland: Gaelic Football, Rugby, golf, soccer, cricket
2. Australia ($67,980)
Global Sports Superpower
What was Australia’s GDP per capita at their first major sporting event? $8,252.7 (1978 Women’s ODI Cricket World Cup win)
Australia’s Current Socioeconomic Stats
- GDP: $1.88 Trillion
- Population: 27.67 Million
- GDP Per Capita: $67,980
- Population Under Poverty: 0.5% (2018)
2024 Paris Olympic (Total Medals): 53
Most Popular Sports in Australia: Australia Rules Football (AFL), Cricket, Rugby, Soccer, Tennis, Swimming
GDP Per Capita At a Glance
| Year | GDP Per Capita | Significance |
| 1963 | $1967.2 | Netball World Cup Win |
| 1973 | $4770.8 | Women’s Cricket World Cup (CWC) Final |
| 1975 | $7003.8 | Men’s CWC Final |
| 1978 | $8258.7 | Women’s CWC Win |
| 1987 | $11651.3 | Men’s CWC Win |
| 1999 | $20712.7 | Men’s CWC Win |
| 2007 | $41051.6 | 3rd Consecutive Men’s ODI WC Win |
| 2014 | $62544.1 | Women’s T20 WC Win |
| 2023 | $64820.9 | Men’s CWC Win |
3. United Kingdom ($54,280)
Global Sports Superpower
What was England’s GDP per capita at their first major sporting event? $1,987.6 (1966 FIFA World Cup)
UK’s Current Socioeconomic Stats
- GDP: $3.73 Trillion
- Population: 68.72 Million
- GDP Per Capita: $54,280
- Population Under Poverty: 0.2% (2021)
Great Britain 2024 Paris Olympic (Total Medals): 65
Most Popular Sports in the UK: Soccer, Cricket, Rugby, Tennis, Golf
GDP Per Capita At a Glance
| Year | GDP Per Capita | Significance |
| 1966 | $1987.6 | FIFA World Cup Win |
| 1973 | $3426.3 | Women’s CWC Win |
| 1979 | $7804.8 | Men’s CWC Final |
| 1987 | $13118.6 | Men’s CWC Final |
| 1992 | $20487.2 | Men’s CWC Final |
| 2010 | $39599 | Men’s T20 WC Win |
| 2019 | $42662.5 | Men’s ODI WC Win |
4. New Zealand ($48,230)
Multi-sport nation
What was New Zealand’s GDP per capita at their first major sporting event? $12,330.9 (1987 Rugby World Cup)
NZ’s Current Socioeconomic Stats
- GDP: $262.92 Billion
- Population: 5.45 Million
- GDP Per Capita: $48,230
- Population Under Poverty:
2024 Paris Olympic (Total Medals): 20
Most Popular Sports in NZ: Rugby, Cricket, Netball, Soccer, Basketball
People tend to ask how New Zealand always ‘punches’ above their weights and make it to cricket World Cup semi-finals despite a population of 5.45 million?
Because they have the fourth highest GDP per capita and have most of the population above the poverty/GHI line, so individuals can focus on other worldly needs like sports.
GDP Per Capita At a Glance
| Year | GDP Per Capita | Significance |
| 1967 | $2208.4 | Netball WC Win |
| 1987 | $12330.9 | Rugby WC Win |
| 2000 | $13641.1 | Women’s CWC Win |
| 2021 | $49624.2 | World Test Championship Win |
5. West Indies ($19,823)
Multi-sport nation
West Indies teams from the 1975-1983 ODI World Cups, 2004 Champions Trophy, and 2012 & 2016 T20 World Cups included players from Guyana, Barbados, Jamaica, Trinidad & Tobago, and Saint Lucia
What was West Indies nations’ GDP per capita at their first major sporting event? (1975 World Cup)
- $663.8 (Guyana)
- $1,416.8 (Jamaica)
- $1601.2 (Barbados)
- $2318.7 (Trinidad & Tobago)
- $1428.2 (Saint Lucia) – 1980
WI’s Current Socioeconomic Stats
- GDP: $29.24 Billion (T & T), $24.48 Billion (Guyana), $21.59 Billion (Jamaica), $7.65 Billion (Barbados), $2.68 Billion (St. Lucia)
- Population: 2.75 Million (Jamaica), 1.44 Million (T & T), 0.8 Million (Guyana), 0.29 Million (Barbados), 0.18 Million (St. Lucia)
- GDP Per Capita: $30,650 (Guyana), $26,230 (Barbados), $20,380 (T & T), $14,560 (St. Lucia), $7,840 (Jamaica)
- Poverty: 11.9% (Guyana – 1998), 1.34% (T & T – 1992), 0.31% (Jamaica – 2021), 0.08% (St. Lucia – 2015)
- Global Hunger Index (2024): 10.8 (T & T), 9.1 (Guyana), 7.7 (Jamaica)
- GHI (2000): 17.0 (Guyana), 10.8 (T & T), 8.4 (Jamaica)
2024 Paris Olympic (Total Medals): 6 (Jamaica), 2 (St. Lucia)
Most Popular Sports in the Caribbean: Cricket, Soccer, Track & Field, Netball
GDP Per Capita At a Glance
| Year | GDP Per Capita | Significance |
| 1975 | $663-$2300 | CWC Win |
| 1979 | $688-$4155 | CWC Win |
| 2004 | $1033-$12000 | Champions Trophy Win |
| 2008 | $4009-$21299 | 50 Olympians, 11 Medals, 5 Gold, Usain Bolt era begins |
| 2012 | $5320-$20470 | T20 WC Win |
| 2016 | $5009-$19000 | T20 WC (Men’s/Women’s), U-19 CWC |
2024 Paris Olympic (Total Medals): 6 (Jamaica), 2 (St. Lucia)
Note: I did not find data on Leeward Islands, Windward Islands.
6. South Africa ($6,520)
Multi-sport nation
What was South Africa? GDP per capita at their first major sporting event? $3,855.6 (1995 Rugby World Cup)
SA’s Current Socioeconomic Stats
- GDP: $418.05 Billion
- Population: 64.15 Million
- GDP Per Capita: $6,520
- Population Under Poverty (World Bank): 20.49% (2014)
- Population Under Poverty (National): 55.50% (2014)
- Global Hunger Index: 12.6 (2024), 18.0 (2000)
2024 Paris Olympic (Total Medals): 6
Most Popular Sports in South Africa: Rugby, Cricket, Soccer, Athletics, Swimming
GDP Per Capita At a Glance
| Year | GDP Per Capita | Significance |
| 1992 | $3462.4 | CWC First Semi-Finals |
| 1995 | $3855.6 | Rugby WC Win |
| 2007 | $6591.9 | Rugby WC Win |
| 2023 | $6022.5 | Rugby WC Win, Women’s T20 WC Final, Men’s ODI WC Final |
Also Read: 20 South Africa World Cup Chokes and Heartbreaks: The Complete List (Men’s & Women’s Combined)
7. Sri Lanka ($3,330)
One-Sport Dominant Nation
What was Sri Lanka’s GDP per capita at their first major sporting event? $776.2 (Won the 1996 ODI World Cup)
SL’s Current Socioeconomic Stats
- GDP: $74.59 Billion
- Population: 22.4 Million
- GDP Per Capita: $3,330
- Population Under Poverty (World Bank): 0.96% (2019)
- Population Under Poverty (National): 14.30% (2019)
- Global Hunger Index: 11.3 (2024), 21.7 (2000)
2024 Paris Olympic (Total Medals): 0
Most Popular Sports in South Africa: Cricket, Volleyball, Athletics
GDP Per Capita At a Glance
| Year | GDP Per Capita | Significance |
| 1975 | $279.8 | Invited to CWC |
| 1979 | $230.8 | Qualified for CWC |
| 1996 | $776.2 | Won CWC |
| 2007 | $1578.6 | ODI WC Runners-up |
| 2014 | $3971.9 | T20 WC Win |
8. India ($2,940)
One-Sport Dominant Nation, In-Transit to Become Multi-Sport Nation
What was Afghanistan’s GDP per capita at their first major sporting event? $296 (1983 ODI Cricket World Cup win)
India’s Current Socioeconomic Stats
- GDP: $4.27 Trillion
- Population: 1.45 Billion
- GDP Per Capita: $2,940
- Population Under Poverty (World Bank): 12.92 % (2021)
- Global Hunger Index: 27.3 (2024), 38.4 (2000)
2024 Paris Olympic (Total Medals): 6
Most Popular Sports in India: Cricket, Field Hockey, Badminton, Kabaddi, Wrestling
GDP Per Capita At a Glance
| Year | GDP Per Capita | Significance |
| 1975 | $161.1 | Field Hockey WC Win |
| 1983 | $296 | CWC Win |
| 2003 | $544.1 | CWC Runners-Up |
| 2007 | $1021.9 | T20 WC Win |
| 2011 | $1445.5 | ODI WC Win |
| 2024 | $2700 | T20 WC Win |
(current USD $)
- 1983: $296
- 2003: $544.1
- 2007: $1021.9
- 2011: $1445.5
- 2013: $1432.8
- 2023: $2480.8
9. Bangladesh ($2,770)
One-Sport Dominant Nation
What was Bangladesh’s GDP per capita at their first major sporting event? $397.3 (Won the 1997 ICC Trophy and qualified for the 1999 ODI Cricket World Cup)
Bangladesh’s Current Socioeconomic Stats
- GDP: $481.86 Billion
- Population: 173.74 Million
- GDP Per Capita: $2,770
- Population Under Poverty (World Bank): 5.01% (2022)
- Population Under Poverty (National): 18.7% (2022)
- Global Hunger Index: 19.4 (2024), 33.8 (2000)
2024 Paris Olympic (Total Medals): 0
Most Popular Sports in Bangladesh: Cricket, Soccer, Kabaddi, Badminton
GDP Per Capita At a Glance
| Year | GDP Per Capita | Significance |
| 1997 | $379.3 | ICC Trophy Win |
| 1999 | $388 | Qualified for CWC |
| 2015 | $1224.4 | ODI WC Quarterfinals |
10. Zimbabwe ($2,130)
One-Sport Dominant Nation
What was Zimbabwe’s GDP per capita at their first major sporting event? $716.8 (1975 Cricket World Cup – Had Kapil Dev not scored that 175*, we may be playing the ZPL)
Zimbabwe’s Current Socioeconomic Stats
- GDP: $36.93 Billion
- Population: 17.36 Million
- GDP Per Capita: $2,130
- Population Under Poverty (World Bank): 39.75% (2019)
- Population Under Poverty (National): 38.30% (2019)
- Global Hunger Index: 27.6 (2024), 35.3 (2000)
2024 Paris Olympic (Total Medals): 0
Most Popular Sports in Zimbabwe: Cricket, Soccer, Rugby, Athletics
GDP Per Capita At a Glance
| Year | GDP Per Capita | Significance |
| 1982 | $1095.3 | ICC Trophy Win, Qualified for 1983 WC |
| 1995 | $648 | Hosted All-Africa Games |
| 1999 | $582 | Best WC Show, 5 Wins |
11. Pakistan ($1,590)
One-Sport Dominant Nation
What was Pakistan’s GDP per capita at their first major sporting event? $395.7 (1992 ODI Cricket World Cup Win)
Pakistan’s Current Socioeconomic Stats
- GDP: $374.6 Billion
- Population: 240.54 Million
- GDP Per Capita: $1,590
- Population Under Poverty (World Bank): 4.93% (2018)
- Population Under Poverty (National): 21.9% (2018)
- Global Hunger Index: 27.9 (2024), 36.6 (2000)
2024 Paris Olympic (Total Medals): 1
Most Popular Sports in Pakistan: Cricket, Field Hockey, Squash, Badminton
GDP Per Capita At a Glance
| Year | GDP Per Capita | Significance |
| 1960 | $82 | Field Hockey Olympic Gold |
| 1979 | $249.2 | First CWC Semi-Finals |
| 1992 | $395.7 | WC Win |
| 1999 | $418.2 | WC Runners-Up |
| 2009 | $963.8 | T20 WC Win |
| 2017 | $1519.2 | Champions Trophy Win |
| 2022 | $1538.3 | T20 WC Runners-up |
12. Afghanistan ($410.93)
One-Sport Dominant Nation
What was Afghanistan’s GDP per capita at their first major sporting event? $560.6 (2010 – ICC Intercontinental Cup, ICC World T20 Qualifier Winners, qualify for 2010 T20 World Cup)
Afghanistan Current Socioeconomic Stats
- GDP: $17.33 billion
- Population: 42.17 Million
- GDP Per Capita: $410.93
- Population Under Poverty (World Bank): 34.9% (2023)
- Population Under Poverty (National): 54.9% (2023)
- Global Hunger Index: 30.8 (2024), 49.6 (2000)
2024 Paris Olympic (Total Medals): 0
Afghanistan’s Most Popular Sports: Cricket, Buzkashi
| Year | GDP Per Capita | Significance |
| 2001 | $138.7 | Afghanistan becomes an ICC recognized nation |
| 2010 | $560.6 | Qualifies for T20 World Cup |
| 2023 | $397.02 | 2024 T20 WC Semi-Finalists |
Economies of Football Dominant Countries
Since 1960, only the following countries have won the FIFA World Cup: Brazil, England, (West) Germany, Argentina, Italy, France, and Spain (Uruguay, Hungary, and Czechoslovakia are not considered here).
We will also explore Croatia, Portugal, and the Netherlands, who have been competitive.
1. Netherlands ($70,610)
Multi-Sport Nation
What was Netherland’s GDP per capita at their first major sporting event? $6,454.5 (1974 Finalists)
Current Socioeconomic Stats
- GDP: $1.27 Billion
- Population: 18.03 Million
- GDP Per Capita: $70,610
- Population Under Poverty (WB): 0.07% (2021)
- Population Under Poverty (National): 14.5% (2021)
2024 Paris Olympic (Total Medals): 34
Most Popular Sports in Netherlands: Soccer, Cycling, Field Hockey
GDP Per Capita At a Glance
| Year | GDP Per Capita | Significance |
| 1974 | $6450.5 | FIFA World Cup (WC) Runners-up |
| 1978 | $11195.8 | WC Runners-Up |
| 2010 | $51305.7 | WC Runners-Up |
| 2014 | $53457.2 | 3rd Place |
2. Germany ($57,910)
Global Sports Superpower
What was Germany’s GDP per capita at their first major sporting event? $1,162.1 (1960 – West Germany won the 1954 FIFA WC), $5,659.7 (1974)
Current Socioeconomic Stats
- GDP: 4.92 Trillion
- Population: 84.98 Million
- GDP Per Capita: $57,910
- Population Under Poverty (World Bank): 0.24% (2020)
- Population Under Poverty (National): 16% (2020)
2024 Paris Olympic (Total Medals): 33
Most Popular Sports in Germany: Soccer, Tennis, Basketball, Handball
GDP Per Capita At a Glance
| Year | GDP Per Capita | Significance |
| 1966 | $1870.8 | FIFA WC Runners-Up |
| 1974 | $5659.7 | WC Winners |
| 1990 | $22385.7 | WC Winners |
| 2003 | $30711.1 | Women’s FIFA WC Win |
| 2008 | $46386.3 | Men’s Field Hockey Gold |
| 2014 | $48971.1 | WC Winners |
3. France ($49,530)
Global Sports Superpower
What was France’s GDP per capita at their first major sporting event? $9,311.9 (1984 Euro)
Current Socioeconomic Stats
- GDP: $3.28 Trillion
- Population: 66.3 Million
- GDP Per Capita: $49,530
- Population Under Poverty (World Bank): 0.06% (2021)
- Population Under Poverty (National): 15.60% (2021)
2024 Paris Olympic (Total Medals): 64
Most Popular Sports in France: Soccer, Tennis, Rugby, Handball, Basketball
GDP Per Capita At a Glance
| Year | GDP Per Capita | Significance |
| 1986 | $13430.5 | FIFA WC 3rd Place |
| 1995 | $26791.8 | Men’s Handball WC Win |
| 1998 | $24869.4 | FIFA WC Win |
| 2006 | $36431.6 | WC Runners-Up |
| 2018 | $41418.2 | WC Winners |
4. Italy ($41,710)
Multi-sports Nation
What was Italy’s GDP per capita at their first major sporting event? $1,718.5 (1968 UEFA Euro)
Current Socioeconomic Stats
- GDP: $2.46 Trillion
- Population: 58.96 Million
- GDP Per Capita: $41,710
- Population Under Poverty (World Bank): 0.81% (2021)
- Population Under Poverty (National): 20.10% (2021)
2024 Paris Olympic (Total Medals): 40
Most Popular Sports in Italy: Soccer, Cycling, Tennis, Basketball, Volleyball, Formula 1
GDP Per Capita At a Glance
| Year | GDP Per Capita | Significance |
| 1970 | $2111.7 | FIFA WC Runners-up |
| 1982 | $7573.9 | WC Win |
| 1994 | $19382.2 | WC Runners-Up |
| 2006 | $33684.7 | WC Win |
| 2020 | $32091.5 | Euro Winners |
5. Spain ($37,360)
Multi-sports Nation
What was Spain’s GDP per capita at their first major sporting event? $695 (1984 Euro)
Current Socioeconomic Stats
- GDP: 1.83 Trillion
- Population: 48.92 Million
- GDP Per Capita: $37,360
- Population Under Poverty (WB): 0.56%
- Population Under Poverty (National): 20.4%
2024 Paris Olympic (Total Medals): 18
Most Popular Sports in Spain: Soccer, Basketball, Tennis, Cycling, Water Sports
GDP Per Capita At a Glance
| Year | GDP Per Capita | Significance |
| 1964 | $695 | Euro Win |
| 1982 | $5156 | Hosted the FIFA WC |
| 2005 | $26451 | Men’s Handball WC Win |
| 2008 | $35603.2 | Euro Win |
| 2010 | $30658.7 | WC Win |
6. Portugal ($30,950)
One-Sport Dominant Nation
What was Portugal’s GDP per capita at their first major sporting event? $18,064.2 (2004 Euro Finalists)
Current Socioeconomic Stats
- GDP: $319.93
- Population: 10.34 Million
- GDP Per Capita: $30,950
- Population Under Poverty (WB): 0.23% (2021)
- Population Under Poverty (National): 16.40% (2021)
2024 Paris Olympic (Total Medals): 4
Most Popular Sports in Portugal: Soccer, Futsal, Cycling
GDP Per Capita At a Glance
| Year | GDP Per Capita | Significance |
| 1966 | $601.3 | FIFA WC 3rd Place |
| 2000 | $11526.4 | Futsal WC 3rd Place |
| 2006 | $19839.5 | WC 4th Place |
| 2016 | $19980.3 | Euro Win |
7. Croatia ($25,080)
One-Sport Dominant Nation
What was Croatia’s GDP per capita at their first major sporting event? $5,712.6 (1998 FIFA WC Semi-Finals)
Current Socioeconomic Stats
- GDP: $96.03 Billion
- Population: 3.83 Million
- GDP Per Capita: $25,080
- Population Under Poverty (WB): 0.31% (2021)
- Population Under Poverty (National): 18% (2021)
- Global Hunger Index: < 5 (2024), 5.5 (2000)
2024 Paris Olympic (Total Medals): 7
Most Popular Sports in Croatia: Soccer, Basketball, Handball, Water Polo
| Year | GDP Per Capita | Significance |
| 1998 | $5712.6 | FIFA WC 3rd Place |
| 2018 | $15460.4 | WC Runners-Up |
| 2022 | $18466.1 | WC 3rd Place |
8. Argentina ($12,050)
One-Sport Dominant Nation
What was Argentina’s GDP per capita at their first major sporting event? $3282.1
Current Socioeconomic Stats
- GDP: $574.2 Billion
- Population: 47.64 Million
- GDP Per Capita: $12,050
- Population Under Poverty (World Bank): 0.61% (2022)
- Population Under Poverty (National): 39.20% (2022)
- Global Hunger Index: 6.6 (2024), 6.6 (2000)
2024 Paris Olympic (Total Medals): 3
Most Popular Sports in Argentina: Soccer, Polo, Field Hockey
GDP Per Capita At a Glance
| Year | GDP Per Capita | Significance |
| 1978 | $3282.1 | FIFA WC Win |
| 1986 | $3436.1 | WC Win |
| 2014 | $12233.1 | WC Runners-Up |
| 2022 | $13935.7 | WC Win |
9. Brazil ($10,820)
One-Sport Dominant Nation. In-Transit to Become a Multi-Sports Nation
What was Brazil’s GDP per capita at their first major sporting event? $235.3 (1958 & 1962 FIFA World Cups)
Current Socioeconomic Stats
- GDP: $2.31 Trillion
- Population: 213.32 Million
- GDP Per Capita: $10,820
- Population Under Poverty: 3.5% (2022)
- Global Hunger Index: 6.6 (2024), 11.7 (2020)
2024 Paris Olympic (Total Medals): 20
Most Popular Sports in Brazil: Soccer, Volleyball, Basketball, Martial Arts, Futsal
GDP Per Capita At a Glance
| Year | GDP Per Capita | Significance |
| 1962 | $250.2 | FIFA WC Win |
| 1970 | $443.8 | WC Win |
| 1994 | $3298.7 | WC Win |
| 2002 | $2855.9 | WC Win |
| 2007 | $7409.7 | Women’s WC Runners-up |
| 2014 | $12275 | Hosted FIFA WC |
| 2016 | $8836.3 | Hosted Olympics |
Economics of Olympics Dominant Countries
The combined Summer/Winter Olympics tally leaderboard are as follows: United States (3095 medals), Soviet Union (1204), Great Britain (1014), France (961), Germany (960), China (804), Italy (799), Sweden (690), Australia (619), Japan (618), Canada (578), Norway (576), Russia (542), Hungary (540), etc. These countries also happen to be the most developed countries.
On the other end of the spectrum, the following countries only have 1 Olympic medal: Guyana, Iraq, Senegal, Barbados, Paraguay, Sudan, Virgin Islands, Netherlands Antilles, Gabon, Togo, Burkina Faso, Mauritius, Samoa, Tonga, Djibouti, Cape Verde, Dominica, Turkmenistan, Eritrea, Montenegro. You get the point.
Burkina Faso would send its first Olympian in the 1972 Munich Olympics, when its GDP per capita was $99.6. In 1988, they sent 6 athletes ($301.1). When Djibouti won its bronze in 1988, it had a GDP per capita of $878.9.
1. USA ($89,680)
Global Sports Superpower
Current Socioeconomic Stats
- GDP: $30.3 Trillion
- Population: $338.29 Milllion
- GDP Per Capita: $89,680
- Population Under Poverty: 1.25% (2022)
2024 Paris Olympic (Total Medals): 126
Most Popular Sports in USA: American Football, Basketball, Baseball, Ice Hockey, Golf, Track and Fields, Tennis, Soccer
GDP Per Capita At a Glance
| Year | GDP Per Capita | Significance |
| 1960 | $2999.9 | 71 Olympic Medals |
| 1984 | $17121.2 | 174 Medals |
| 1991 | $24342.3 | Women’s WC Win |
| 2002 | $37997.7 | Men’s WC Reaches its first Quarter Finals |
| 2019 | $65604.7 | Women’s 4th WC Win |
2. China ($13,870)
Global Sports Superpower
Current Socioeconomic Stats
- GDP: $19.53 Trillion
- Population: 1.41 Billion
- GDP Per Capita: $13,870
- Population Under Poverty: 0% (2021)
- Global Hunger Index: < 5 (2024), 13.4 (2000)
China’s Global Hunger Index Trends
| Year | GHI | Olympic Medals |
| 2000 | 13.4 | 58 |
| 2008 | 7.2 | 100 |
| 2016 | < 5 | 70 |
| 2024 | < 5 | 91 |
2024 Paris Olympic (Total Medals): 91
Most Popular Sports in China: Table Tennis, Badminton, Swimming, Martial Arts, Basketball
GDP Per Capita At a Glance
| Year | GDP Per Capita | Significance |
| 1984 | $250.7 | 32 Olympic Medals |
| 2000 | $959.4 | 58 Medals |
| 2008 | $3468.3 | 100 Medals, Hosted Olympics |
| 2022 | $10408.7 | 15 Medals at Winter Olympics (China’s Best Show) |
3. Japan ($35,610)
Global Sports Superpower
Current Socioeconomic Stats
- GDP: $4.39 Trillion
- Population: 123.26 Million
- GDP Per Capita: $35,610
- Population Under Poverty: 0.73% (2013)
2024 Paris Olympic (Total Medals): 45
Most Popular Sports in Japan: Baseball, Sumo Wrestling, Soccer, Martial Arts
GDP Per Capita At a Glance
| Year | GDP Per Capita | Significance |
| 1960 | $508.7 | 18 Medals |
| 1982 | $9780 | Baseball World Cup Runners-up |
| 2006 | $35991.5 | World Baseball Classic Win |
| 2011 | $48760.1 | Women’s WC Win |
| 2020 | $40040.8 | 58 Medals, Hosted Olympics |
4. Republic of Korea ($37,670)
Global Sports Superpower
*South Korea
Current Socioeconomic Stats
- GDP: $1.95 Trillion
- Population: 51.68 Million
- GDP Per Capita: $37,670
- Population Under Poverty: 0% (2021)
2024 Paris Olympic (Total Medals): 32
Most Popular Sports in South Korea: Soccer, Baseball, Archery, Golf, Taekwondo
GDP Per Capita At a Glance
| Year | GDP Per Capita | Significance |
| 1982 | $1992.5 | Baseball World Cup Win |
| 1988 | $4748.6 | Hosted Olympics, 33 Medals |
| 2002 | $13165.1 | FIFA WC 4th Place |
| 2005 | $19402.5 | Baseball WC Runners-up |
5. Canada ($55,890)
Global Sports Superpower
Current Socioeconomic Stats
- GDP: $2.33 Trillion
- Population: 41.7 Million
- GDP Per Capita: $55,890
- Population Under Poverty: 0.25% (2019)
2024 Paris Olympic (Total Medals): 27
Most Popular Sports in Canada: Ice Hockey, Lacrosse, Soccer, Basketball, Baseball, Athletics
GDP Per Capita At a Glance
| Year | GDP Per Capita | Significance |
| 1976 | $8838.9 | Hosted Summer Olympics, 11 Medals |
| 1984 | $13930.5 | 44 Medals, Canada’s Best Show |
| 2002 | $24256 | Ice Hockey Olympic Gold |
| 2010 | $47560.7 | Hosted Winter Olympic Medal, 26 Medals |
| 2015 | $43594.2 | Hosted Women’s FIFA WC |
6. Russia/USSR ($15,080)
Global Sports Superpower
Current Socioeconomic Stats
- GDP: $2.2 Trillion
- Population: 145.63 Million
- GDP Per Capita: $15,080
- Population Under Poverty (WB): 0.18% (2021)
- Population Under Poverty (National): 12.10% (2010)
2020 Tokyo Olympic as ROC (Total Medals): 71
Most Popular Sports in Russia: Soccer, Ice Hockey, Gymnastics, Figure Skating
GDP Per Capita At a Glance
| Year | GDP Per Capita | Significance |
| 1990 (USSR) | ~$9200 | USSR Dissolves |
| 1996 (Russia) | $2643.9 | Russia Re-enters the Olympics, 89 Medals |
| 2016 | $8663.2 | 56 Medals |
Final Thoughts and Future Work
In the future, it would be interesting to analyze countries that dominate less accessible sports like golf or sports in the Winter Olympics. Also nations like Sweden, Norway, Belgium, Uruguay, Czech Republic, Hungary, and Mexico were out of scope for this study, but would be interesting to look at in the future.
Another way to go is to look at the understood how America’s economy is able to support multiple flourishing sports league (NFL, College Football, College Basketball (Men’s/Women’s), NBA, MLS, etc.)
Also, why aren’t Ireland better at cricket? I was surprised to see that they are financially a lot more stable than other nations. The next step would be to look at social policies and government investments to study how countries can start winning consistently at an international stage after they have satisfied the bare minimum economic conditions.
In any case, thank you all for reading. Appreciate y’all! Comment below on what you think!
And please, share, subscribe to our social media channels (X, Facebook) and other platforms (Substack, Medium)
Sources
- GDP Data – International Monetary Fund (IMF)
- IMF Country Profile
- Global Hunger Index
- World Bank (WB) Country Profile
- Poverty Data
- Poverty Rate By Country
- Afghanistan’s Poverty
- 200 Years of Global Poverty Chart
- Olympic Medal Table By Population and Wealth
- Interesting World Datasets
- Paris Olympic Medal Tally
If You Enjoyed Reading This, You May Also like the following Research Articles
- I Read Every County Cricket Club’s Financials—Fascinating Revelations! Are County Cricket Clubs Really Struggling?
- How Much Debt Does Each County Owe? The Economics of County Cricket (Part II)
- I Asked the NCAA if Cricket Can Become an Official NCAA Sport—Here is What I Found Out
- How Expensive is to Watch a Cricket Match Live Around the World? Average Cricket Ticket Prices
- Sheffield Shield Club’s Financials—Here is What I Found Out about Australia’s Domestic Cricket Teams
- USA Cricket—The Complete Guide to Cricket in America (Updated 2023)
© Copyright @Nitesh Mathur and Broken Cricket Dreams, LLC 2023. Originally published on 04/02/2025. Unauthorized use and/or duplication of this material without express and written permission from this site’s author and/or owner is strictly prohibited. Excerpts and links may be used, provided that full and clear credit is given to Broken Cricket Dreams with appropriate and specific direction to the original content (i.e. linked to the exact post/article).

radiant! 21 2025 Dear MS Dhoni, Thanks for the Memories. But It’s Time To Say Goodbye satisfying