At the end of the The Dark Night, Commissioner James Gordon reluctantly declares that the late Harvey Dent, was “not the hero we deserved, but the hero we needed.” He instead casts Batman as the villain to preserve hope and peace in the crime-ridden streets of Gotham.
Sri Lankan cricket, too, needed a hero in an era of turbulence. The past decade for Sri Lanka hasn’t been all that great, it’s been pretty bleak to be completely honest.
Amidst this time of inconsistency and decline, Sri Lanka found a steady presence in Dimuth Karunaratne. Now that Karunaratne has decided to hang up his boots after his 100th Test, it’s time to reflect back on a stellar career.
The Never-Ending Transition After the Golden Generation
Until not too long ago, it felt like Sri Lanka were in a never-ending transition cycle.
Between 2007 to 2015, Sri Lanka advanced to the semi-finals of six ICC tournaments, finished as the runners up on four occasions, and finally clinched the 2014 T20 World Cup. Their worst performance? A quarter-final exit. Yeah, digest that.
As the golden generation—Jayasuriya, Dilshan, Sangakkara, Jayawardene, Samaraweera, Kulasekera, Vaas, Malinga, and Muralitharan—faded into the history books, it was time for the next generation to step up. Angelo Mathews, Dinesh Chandimal, Kusal Perera, and Lahiru Thirimanne were expected to carry the mantle with the legend of Herath hanging around for seasoned support.
This didn’t exactly go to plan. While the next-gen delivered a few memorable moments, they were usually in and out of the squads and their performances have often fallen short of expectations.
In seven ICC tournaments since 2015, Sri Lanka has yet to make it past the Group stage (Super 10s/Super 12s in T20 World Cups) and even crashed out of the group stage in the 2016 & 2018 Asia Cups!
The situation in Test cricket was just as grim. Between 2015 and the beginning of the WTC in July 2019, Sri Lanka lost 24 Tests and only won 19. In comparison, they had won 30 Tests and only lost 23 Tests in the nine years prior (2006-14).
A nation once celebrated for producing one gem after another had hit rock bottom. It began to feel as though the Pearl of the Indian Ocean had lost its luster.
That’s where Karunaratne comes in, the one who bridged the gap between two generations. Karunaratne debuted alongside Sangakkara-Mahela-Samaraweera-Mathews and helped Sri Lanka make the transition.
Karunaratne’s first few years were not terrible, but they were definitely not a Kamindu Mendis-esque start either.
“I went to the middle with so many expectations, and I got out for a duck first innings. I thought I’d lost all the hard work I ever did in just a moment. I was only there as an injury replacement, so I thought I’d never play for Sri Lanka again.“
He would further showcase his talent with a 85 in Sydney (where another opener named David Warner would also score 85 incidentally).
In his early years, he had several glittering starts, but only a few fifties, and even fewer tons, Averages of 22, 28.62, 42.83, 36.61, and 29.29 from 2012 through 2016 didn’t do justice to his talent, and he was dropped after two years. However, his recall to the side was a turning point with the 152 at Christchurch becoming one of his career highlights.
“There are two – my maiden hundred against New Zealand. It was the first match I was playing after getting back into the team…That was a really tough hundred for me, against a great New Zealand attack…Then there’s my hundred at the SSC, against Jadeja and Ashwin. That was a pitch that took extreme turn.”
2017 was the year that everything seemed to come together with his batting: 126 vs Bangladesh, 97 & 141 vs India, and 196 vs Pakistan in the UAE.
Asia was conquered.
After Christchurch & Sydney, his celebrated overseas performances would include 103 in Johannesburg (2021) and 107 at Bengaluru (2022).
Now let’s talk about the stats. He scored most runs as an opener for Sri Lanka (7129), comfortably ahead of Jayasuriya’s 5932 and ended as Lanka’s 4th highest Test run scorer ever.
But since no 2017, no opener dominated Test cricket as Karunaratne did. Since 2017, he tops all the charts as opener: Most Runs, most balls faced, most minutes batted, most 50+ scores, most 100s, and even most 4s!
During this period, Dimuth Karunaratne inevitably holds the other batting records
— Broken Cricket Dreams Cricket Blog (@cricket_broken) February 9, 2025
Openers in the last ten years have struggled across almost all conditions, averaging in the lower 30s. Even Sir Alastair Cook’s averages declined in the latter part of his career due to the challenging conditions.
To end up as the most prolific opening batter for your country is no joke. To be the best in the world for a decade is a next level feat altogether.
Instability and the Constant Revolving Door
Every Sri Lanka squad announcement for ICC tournaments after 2015 felt like a luck of the draw. Multiple players would be dropped, Tharangas and Kapugederas would magically make comebacks after years of absence, and new captains would be selected.
Sri Lanka’s Test openers in the last ten years were a revolving door as well: Tharanga, Thirimanne, Nissanka, Kusal Mendis, Vithanage, Kaushal Silva, Dickwella, Dilruwan Perera, Kusal Perera, Udawatte, Samarawickrama, Oshada Fernando, Gunathilaka.
To put Karunaratne’s accomplishments in perspective, he would play 157 innings as an opener after 2015. Kaushal Silva was the next best with 43 innings.
The player switcheroo would in ODI cricket even as late as 2019.
On the eve of the 2019 ODI World Cup, Upul Tharanga and a few others were dropped, while Karunaratne was recalled as a specialist captain. He had last played an ODI in the 2015 ODI World Cup, but selectors had a good reason to get Karunaratne back into the blue & yellow jersey:
“We saw in South Africa how Dimuth was able to unite the team, and have everyone playing together. That was what was important to us at this time.
Sri Lanka ended as 6th in the 2019 ODI World Cup and their shock win against favorites England kept the World Cup alive. 2019 would also see one of the greatest Test victories of all time with Kusal Perera’s 153*, where Sri Lanka became the first Asian country to win a Test series in South Africa:
“It’s the biggest highlight. Captaincy was never something I’d chased….It’s one of my favorite chapters of my career.”
Karunaratne led with humility and quiet confidence, captaining Sri Lanka in 30 Tests with 12 wins and 6 draws.
Karunaratne retires yes, but tomorrow, the world will go on. Parades won’t be blocking the streets, trains will not stop, the stock market will not crash, and people will continue to go about their business as usual.
In the large scheme of things, nothing much has changed. However, in the small country of Sri Lanka, Karunaratne’s contribution made a monumental difference and will never be forgotten. And that is all that matters.
“When people reminisce about cricket, they think about Tests. We’re still talking about Don Bradman’s records, how many double centuries he’s scored, in how many innings. Whatever happens to me from here, there might be a list that goes up on a Test broadcast, and my son or my grandchildren will see that. I’ve got that record for life, and beyond. That’s worth a lot to me.“
Karunaratne had dreamed of playing 100 Tests and scoring 10,000 runs. Unfortunately the 10,000 runs did not happen (and may not ever happen again for Sri Lanka given how Test cricket is going for tier two nations, but that’s a different story), but he can hold his head high for all that he has accomplished.
What Can We Learn from Dimuth Karunaratne?
Author Bryant McGill once stated,
“I’ll take reliability and dependability over talent any day of the week.”
Did Karunaratne spark a white-ball revolution like Eoin Morgan? Did he redefine Test cricket mentality like Kohli or embrace the audacity and do whatever Ben Stokes is doing with Bazball? No, Karunaratne was an unassuming, yet effective leader.
Did he have batting mannerisms like Elgar or Smith, an aura like Cook or Khawaja, or the swagger like Warner or Rohit? No. But he was unquestionably reliable, dependent, and consistent, exactly what Sri Lankan cricket needed at that time.
In an era of uncertainty, Sri Lanka could always rely on Dimuth. He may not have been a superstar, but in the era of uncertainty, Sri Lanka didn’t need any more superstars.
So indeed, Karunaratne was the hero Sri Lanka needed, not the one they deserved. Karunaratne can take pride in the fact that he has left Sri Lankan cricket in a better place.
What will he be doing next? He has now moved his base to Australia and will spend time honing his coaching skills. Do not be surprised if he returns to Sri Lanka to serve his country once again in different roles. For Karunaratne, team always comes first, and he will continue to serve Sri Lankan cricket for as long as he can.
I will leave you with his emotional goodbye in the 2nd Test against Australia, in which he ended his speech with,
I am beginning to wonder if the 29-year-old Abhimanyu Easwaran will ever get a game for Team India.
Despite India’s top order struggling in the 2024-25 Border Gavaskar Trophy, Easwaran remained on the sidelines.
Jaiswal & KL Rahul had their moments, Rohit Sharma had to ‘opt out’ of the fifth Test due to poor form, Gill was in & out, and even Padikkal got a game. Dhruv Jurel and Nitish Kumar Reddy were also handed opportunities for other roles, but Easwaran never got a look-in.
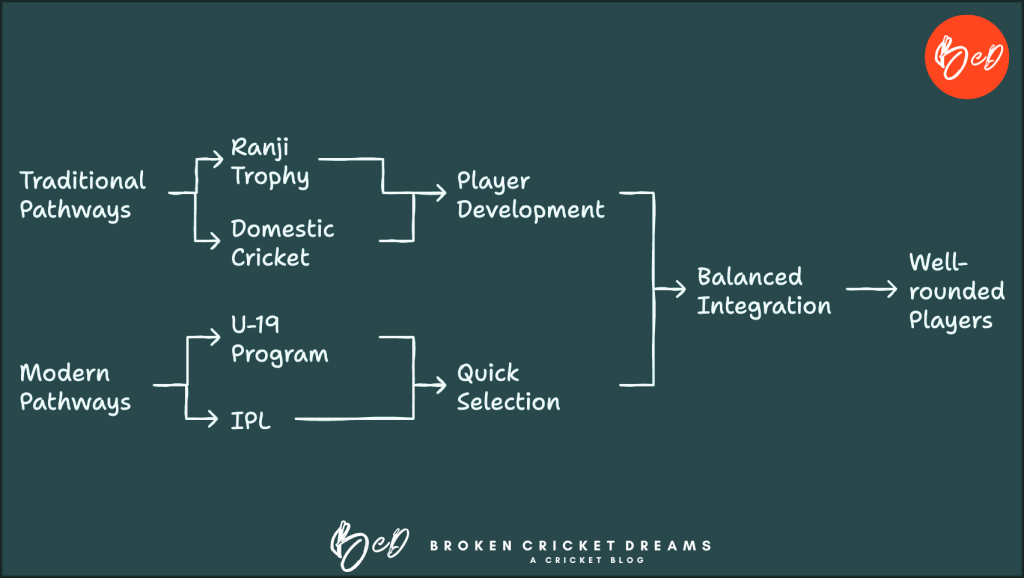
This raises a larger question—Does domestic cricket still matter in India team’s national selection? Has the Ranji Trophy lost its influence, with the India U-19 setup and IPL now serving as the primary pathways to the top?
I looked at Ranji Trophy stats from the last 35 years to see what patterns I can find in the evolution of national selection.
Easwaran came into the spotlight in the 2018-19 Ranji season when he top scored for Bengal with 861 runs. Since then, he has been on the fringes, consistently scoring in the various first-class tournaments, and has also performed well in the India A tours to South Africa and Bangladesh.
BGT 2024-25 was the third time since 2021 that Easwaran has been selected as a ‘standby’ or a reserve opener. This year, he was coming off the back of four consecutive centuries across Duleep, Irani, and Ranji trophies, but still did not get a game.
And it is the not the case that India’s top order has no vacancies. In the last couple of years, Ruturaj Gaikwad, Yashasvi Jaiswal, Ishan Kishan, Devdutt Padikkal, and Prithvi Shaw all leapfrogged him for the reserve Test opener spot due to performances in other formats and the IPL.
Shahbaz Nadeem was the top wicket-taker in the 2015-16 Ranji season (51 wickets), 2016-17 season (56), 3rd highest in 2021-22, and 6th highest wicket-taker in 2022-23. He played only 2 Tests.
Mayank Agarwal had to score the most runs by any Indian in a domestic season (2141 runs) in 2017-18 to make his way to the national team.
Between 2020-23, Sarfaraz Khan scored over 3500 runs batting at #5 at an average of 106.07.
IPL Fast-Track Vs Ranji Grind: Which Opens the Door To Team India?
The traditional pathway was going through domestic cricket, but has the Ranji Trophy and domestic cricket lost its significance?
Is the route through the U-19 program, followed by success in the IPL, now the preferred path over spending 3-4 seasons grinding in domestic cricket?
Let’s go back 25 years to see how Indian cricket has evolved.
Mohammad Kaif & Virat Kohli Pave the Way
Mohammad Kaif’s U-19 triumph in 2000 revolutionized Indian cricket forever. Kaif, Yuvraj Singh, Reetinder Sodhi, Venugopal Rao, Ajay Ratra would all go on to represent Team India.
Eight years later, Virat Kohli followed suit, earning a national call-up soon after leading India to U-19 World Cup glory. Ravindra Jadeja was the vice-captain in that U-19 side.
Since 2008, the IPL has also propelled relatively unknown domestic players to glory. Jasprit Bumrah had begun in Gujarat’s domestic circuit, but it was Mumbai Indians’ scouting lead by coach John Wright, that brought him into the limelight in 2016.
Let’s look at a more recent case, Nitish Kumar Reddy. Reddy made his way to the Andhra FC team after becoming player of the tournament in the 2017-18 Vijay Merchant Trophy (U-16 cricket). His breakthrough came at the 2023 IPL auction, and after impressing in the 2024 IPL, Reddy was elevated to the national squad (and ended up becoming India’s best batter in the BGT).
As the India U-19 system and IPL evolved, a clear pathway emerged—players identified at the U-19 level were fast-tracked to IPL auctions, and those who proved themselves over a season or two often found a route to the national team.
The U-19 & IPL Pathway Express: Gill, Jaiswal
Yashasvi Jaiswal’s inspirational journey is a prime example: He made his FC debut in 2019 and took Mumbai cricket by storm by becoming the youngest double centurion in List A cricket. However, it was his standout performance at the 2020 U-19 World Cup, where he was the player of the series & the highest run scorer, that caught everyone’s attention.
He was then be picked by the Rajasthan Royals in the IPL. After a couple of middling seasons, he took the 2023 IPL by storm scoring 625 runs including a 13-ball 50.
This lead to his Test call-up in the West Indies, where he scored a scintillating 171 and hasn’t looked back since. His 2024 Test season was an all-timer: 1478 runs at 54.74 with 3 hundreds and 9 fifties. Jaiswal has played 19 Tests already, but has only played 16 other first-class matches.
Dhruv Jurel was India’s vice-captain in the same U-19 WC, who also followed a similar path to the India Test cap through the Rajasthan Royals. Before Jaiswal, Rishabh Pant (2016 U-19 WC), Shubman Gill, and Prithvi Shaw (2018) all took a comparable route.
Pujara & Rahane, The Last Warriors of The Ranji Selection Era
Cheteshwar Pujara and Ajinkya Rahane were perhaps the last prototypes of consistent select based upon domestic performances.
Like Jaiswal, Pujara was the player of the tournament and the highest run scorer of the 2006 U-19 WC. However, before breaking into the India Test squad in 2010, he was prolific in the domestic circuit. He was the fifth highest run-scorer in 2006-07 (595 runs at 59.5), the highest run-scorer in the 2007-08 season (807 runs at 73.36), 3rd highest in 2008-09 (906 runs at 82.36 including a 302), and scored 554 runs at 79.14 in the 2009-2010 (5 matches) before being selected for India.
Ajinkya Rahane was the second-highest run-scorer in both the 2008-09 and 2009-10 Ranji seasons. He would make his international debut two years later (He got a break in T20 & ODI cricket two years before Test cricket, weirdly enough).
Fun fact: Gautam Gambhir played in the 2007-08 season and was #3 run-scorer (730 runs at 91.25) despite already being in the national team.
The Toils of Domestic Cricket Feat Agarwal, Sarfaraz
Times have changed. The journeys for Mayank Agarwal & Sarfaraz Khan have been tougher.
Agarwal also came through from the U-19 system (2010) and was fast-tracked to the IPL, but talent didn’t convert to runs.
To get back into national contention, Mayank Agarwal had to break the door down.
And boy, did he dominate, finishing as the top scorer in both the 2017-18 Ranji and Vijay Hazare Trophies. With 2,141 runs across formats, he set a record for the most runs by an Indian in a single domestic season. His breakthrough finally came in the 2018 Border-Gavaskar Trophy (Listen to Harsha Bhogle talk about Agarwal’s journey).
Sarfaraz faced an equally challenging route. A member of India’s 2014 and 2016 U-19 squads, his early IPL stint failed to impress. He then turned to domestic cricket, amassing 928 runs in 2019-20, 982 in 2020-21 (leading all batters), and averaging 106.07 from 2020-23. His relentless run-scoring, capped by a double century in the 2024 Irani Cup, finally earned him a Test debut—five years after his purple patch began.
Suryakumar Yadav’s had to wait until he was almost 31 to get an international debut.
Since 2021, he has become one of the greatest T20I players of all-time, racking up over 2500 T20I runs and four centuries. Although Yadav has extensive FC experience under his belt, it was his T20 form, that propelled his selection to the 2023 ODI World Cup teams and a Test debut.
Shreyas Iyer’s T20I & ODI form, along with his IPL credentials, got him his break in Test cricket in 2021.
*To Shreyas Iyer’s credit, he did score a record 1321 runs in the 2015-16 season, top scoring the Ranji charts (next highest was 879 runs). Coincidentally, Suryakumar Yadav was #4 on the list with 788 runs (SKY was the 4th highest scorer in the 2011-12 season)
Finally, we come to KL Rahul, the most enigmatic batter of our generation.
KL Rahul was the 2nd highest scorer in the Ranji Trophy in 2013-14 (1033) and the 4th highest run scorer in 2014-15 (1033) before breaking into the IPL teams. He was destined as the next big thing in Indian cricket and was handed a debut in 2014.
A decade later, he only averages 33.57 in Test cricket despite playing 58 Tests. For someone of his talent, that is not great returns.
Here is how his cricket season works: Rahul tops the charts in the IPL (659, 593, 670, 626, 616, 274, 520 since 2018) -> Gets selected for T20I/ODI -> India play an overseas Test and need a quick replacement for an opener, #3, or keeper, and Rahul is called in to fill the gap. He scores some beautifully looking 50s, an amazing match-winning hundred, and several low scores, before he is dropped at the end of the season.
Lather, rinse, repeat.
KL Rahul got his break due to the Ranji Trophy, but it is his IPL & ODI form keep that keep bringing him back to the Test arena (to be fair, KL Rahul did look really good in the 2024-25 BGT).
Why Comebacks are Nearly Impossible for Ranji Stalwarts
As a counterpoint to KL Rahul are the stories of Karun Nair, Hanuma Vihari, KS Bharat, and Abhinav Mukund.
Comebacks are nearly impossible for Ranji stalwarts.
It takes 3-6 years for a player to grind in domestic cricket to earn a national call-up. Then, they are made to carry drinks for a year or two, finally getting a chance in a tough overseas Test. If they do not deliver immediately, they’re dropped after two games—never to be seen again.
In the last 5 years, #ViratKohli has played 69 innings.
🚨 Averages of all batters who have played 69 innings in the last 5 years
Virat Kohli’s last eight innings read after the Perth 100 read: 7, 11, 3, DNB, 36, 5, 17, 6. Being dismissed in a similar manner, averaging about 30 in the last 5 years, and yet, he will most likely still survive the axe. Different standards for different players.
Hanuma Vihari and How Not to Treat Cricketers
Hanuma Vihari began his journey with 841 runs at 93.44 with 3 tons (including a 201*) in the 2013-14 season.
Vihari had been carried around since 2018 in England, Australia, West Indies, New Zealand, and back to Australia as an understudy to Cheteshwar Pujara. At that Sydey Test, he put his body on his line to draw a famous Test.
AfterSydney, Vihari only received 4 opportunities spread across three series at #3 when Pujara was initially dropped:
20 (53) & 40*(84) in Johannesburg
58 (128) in Mohali (vs Sri Lanka)
31 (81) & 35 (79) in Bengaluru
20 (53) & 11 (44) in Birmingham
For a player transitioning from #6 to #3, those are respectable figures, especially since he was mostly played in overseas conditions.
Now begins the difficult part.
Back in the domestic cricket, his returns has been below-par: 490 runs at 35.00 in 2022-23, 522 runs at 40.15 in 2023-24, and 250 runs at 27.77 in the current season.
After churning runs in the domestic circuit, Mukund was called up to the West Indies series and scored decent knocks of 48 & 62 in six innings.
Then, came the 0-4 horror tour of England. He scored 49 (88) at Lord’s, 12 (32), 0 (1), and 3 (41) in the next three innings before being dropped…for the next six years.
After scoring heavily in Ranji between 2015-2017, he was recalled in 2017. His score? 0 (8), 16 (32), 12 (26), and 81 (116) at Galle. Mukund never played international cricket again.
KS Bharat Fiasco
KS Bharat was Wriddhiman Saha’s understudy and the next Test wicket-keeper in line, at least for home Tests. He had been carrying drinks for about 4 years.
Once India believed Bharat was ready, Saha was ‘forced’ to retire. 12 innings to his name, Bharat hasn’t been effective with the bat averaging 20.09, but was solid with the gloves.
In any case, it looks like India has made a decision to go forward with the trio Rishabh Pant, Dhruv Jurel, and KL Rahul.
India lost the final year of Saha and never groomed Bharat properly.
The Lesson?
These players end up becoming overseas scapegoats.
By the time a player finally breaks into the national XI—after years of grinding in domestic cricket and warming the bench—they’ve lost valuable game time and likely the form that got them there in the first place.
Once a player is dropped, unless they have a Robin Uthappa & DK 2014 season, Agarwal’s 2017 season, or Sarfaraz’s 5 years, it is extremely difficult for them to be noticed again.
Easwaran has been scoring in domestic cricket for seven years without getting a game. Fellow India A opener, Priyank Panchal, now 34, might never get an international cap despite bossing the better part of the last decade in the domestic circuit.
This made me wonder? How did India’s golden generation of the 2000s make it to the national team before IPL & U-19 cricket setups matured?
The 90s: Beginning of the End
Gautam Gambhir had great back-to-back 2001-02 (565 runs at 70.62) & 2002-03 seasons (833 runs at 75.72, Top Scorer) before getting an ODI debut in 2003 and Test debut in 2004.
Virender Sehwagscored a 78 (56) at #5 in the 1998/99 Deodhar Trophy and was the sixth highest run-scorer in the Duleep Trophy that year. The next year, he continued to make runs at the Duleep Trophy including season-best 274 and was the seventh highest run-scorer in the 2000-2001 season (Five of the players above him were Mongia, Laxman, Vikram Rathour, Yuvraj, and Kaif).
Dravid consistently performed in Ranji from 1991-1995 (380 runs at 63.33 in 1991/92, 586 runs at 83.71 in 1992-93, 644 runs at 80.5 in 1993-94, 191 runs in one innings in 1994-95) along with a wonderful India A series against England A in 1995 before getting an international debut.
Sachin Tendulkar was a schoolboy genius. Rare case, never really happens anymore.
VVS Laxman, after having an indifferent start to his Test career as an opener between 1996-99, Laxman went back to his roots and broke all records in domestic cricket (601 runs at 203.66 in 1997-98, 754 runs at 83.77 in 1998-99, and a mammoth season of 1415 runs at 108.84 in 1999-2000. Next best in that 1999/2000 season scored 1075 runs).
Sourav Ganguly scored 439 runs at 73.16 in 1990 before a brief ODI debut. After a couple of middling seasons back in Ranji, he scored 722 runs at 80.22 in 1993/94. A double century in one 1994/95 Ranji game and a 171 in the Duleep Trophy got him his break for the England tour of 1995.
The Bowlers
Anil Kumble impressed in Karnataka debut in 1989, got a few games in U-19 first class tours, and got the national selection in 1990 ODI series against Sri Lanka and Test debut a few months later in England.
Harbhajan Singh did a little bit of everything: Coming up from Punjab U-19s, he performed well in the 1997-98 Ranji Trophy & Duleep Trophy, the 1998 U-19 WC before getting the Test debut in 1998.
Most of the fan favorites from the 2000s also had to toil in domestic cricket, but 2-3 consecutive season of runs was good enough to take them to the next level.
Not anymore.
The 2004 U-19 Generation
Between the Laxmans and the Jaiswals, came the Shikhar Dhawans.
Every now and then, comes a generation with several great players at once. This was absolutely the case with the 2004 U-19 side, who became the fringe players for the next decade: VRV Singh, RP Singh, Suresh Raina, Robin Uthappa, Dinesh Karthik, Ambati Rayudu, Shikhar Dhawan, and to a lesser extent, Faiz Fazal.
These players would be the transition between first-class, U-19, and the IPL. They saw it all—U-19, India A, early international debuts, being dropped, first class toil, inaugural IPL, back to internationals, back to being dropped.
Fun Fact: Robin Uthappa (912) and Dinesh Karthik (884), two of the earliest picked in the national side post 2004, were the top two scorers in the 2014-15 season and used the domestic season to break their way back to the national side.
How Did Australia Find Konstas and McSweeney?
In this season of the Sheffield Shield, Konstas scored 471 runs at 58.87 with two tons. McSweeney scored 291 runs at 97.00 in just four innings.
He had earlier scored 3 tons last summer at 40.94.
Overall though, McSweeney averages 36.31 in FC cricket, while Sam Konstas averages 39.57.
Australia backs players in form and throws them straight into the action. In India, with so much depth, a player often gets their chance five years after their peak.
Final Verdict: Is Domestic Cricket Still Relevant?
Indian selectors are not necessarily wrong with their selection policies. The idea of the ‘X-factor’ is important and the selections of Jaiswal, Pant, Bumrah, and Reddy have largely been inspirational picks.
However, what message is being sent to players next in line? That they should continue to toil for years and other youngsters will most likely continue to jump them in line?
Domestic cricket has essentially now become a ladder for IPL auctions rather than Indian selection. From the stats below, we can see that post the Covid-break, players who performed in domestic cricket like Rajat Patidar, Shams Mulani, R Sai Kishore, Manav Suthar, and Vijaykumar Vyshak were scouted and got gigs in the IPL auction. If they perform in the IPL, they can get fast-tracked to the next level.
There should be a system in place so a domestic player gets a chance before an IPL star does. Otherwise, grassroots will always be grassroots.
Ranji Trophy Back in the News?
Post the BGT debacle, Indian team changed internal rules and also are changing policies regarding domestic cricket. Will we see Rohit, Virat and Pant back in action in Ranji Trophy? Does that do the Indian team any good with the international calendar crowding all space?
Good to see that domestic cricket is getting the attention it deserves, but I am not sure if this is the way to go.
Hopefully, it is not another Broken Cricket Dream.
****
Thank you all for reading and following along. Appreciate the support!
Reference: Recent Ranji Trends Stats
For your kind reference, here are the list of the top run-scorers and wicket-takers in the last decade (divided up by the Covid-induced break since there was no 2020-21 Ranji season).
The likes of Jalaj Saxena, Dharmendrasinh Jadeja, Kumar Kartikeya have been among the wickets, but will this translate to the next level? Only time will tell.
South Africa are in the World Test Championship (WTC) Finals. This must mean only one thing—Test cricket is in grave danger, and its security & stability is in question.
Hence, we must yet again summon the saviors of World Cricket—The Body of Infinite Greed, also known as the Big 3 (India, Australia, England) to pull us from this misery!
According to The Age, there has been talks of more cricket among the three nations as frequent as “twice every three years.” A record 837,739 members attended the recently concluded BumrahBorder-Gavaskar Trophy, fourth-most in Australia and most for a non-Ashes Test series. So more of these marquee series must be the solution to save Test cricket.
Australia, England, India and the International Cricket Council’s new chair Jay Shah are in talks to split Test cricket into two divisions so the big three nations can play each other more often in series like the Border-Gavaskar blockbuster #AUSvINDhttps://t.co/rK91zhcFHH
Whenever cricket is in danger, the Big 3 have come together for the greater good.
In 2007, when India and Pakistan were knocked out of the 16-team ODI World Cup and destroyed ICC’s finances, a revolutionary decision of a 10-team ODI World Cup came into being. Visionaries!
When Netherlands defeated England in the 2009 T20 World Cup or India suffered three indifferent T20 World Cup campaigns between 2009-2012, the ICC decided to add an extra ‘First Round’ barrier for the Associates (who had already arrived at the World Cup with a grueling qualifying campaign).
Now that India and the Bazballers, England have been knocked out of the WTC Finals, it is time to reduce the WTC to 3 teams.
Proposed World Test Championship (WTC) Grouping
Solution: To ‘save’ Test create, the International Cricket Circus Council (ICC) shall ratify the creation of a two-tiered Test Championship without relegation and promotion.
In Group 1, there will be three teams—England, Australia, India.
Each series will consist of a minimum of 5 Tests (at least 20 Tests per team in the cycle).
Group 2 will contain the rest of 9 teams.
Each series will consist of a maximum of 2 Tests.
The winner of Group 1 will compete in the World Test Championship Final in a 3-match Test series (with one match each at the Lord’s, Wankhede, and the MCG).
The loser of Group 1 will play the winner of Group 2 for unofficial brownie points that has no consequence.
This proposal will have multiple benefits. For example, Australia’s burden to be morally correct all the time will be taken away from them since they will now automatically skip the Afganistan, Zimbabwe, and Bangladesh tours.
Similarly, India will not have the shame of losing 0-3 to New Zealand at home if they never play the Kiwis again.
What is a Possible Calendar for Group 1?
There has been a lack of Test matches between India, Australia, and England recently. Even an expansion to a 5-match Border-Gavaskar Trophy just doesn’t seem enough.
2025/26: 🏴 Tour of 🇦🇺 2025: 🇮🇳 Tour of 🏴 2024/25: 🇮🇳 Tour of 🇦🇺 2024: 🏴 Tour of 🇮🇳 2023: 🇦🇺 Tour of 🇮🇳 2023: 🇦🇺 Tour of 🏴 2022: 🇮🇳 Tour of 🏴 (5th Test) 2021/22: 🏴 Tour of 🇦🇺 2021: 🏴 Tour of 🇮🇳 2021: 🇮🇳 Tour of 🏴…
— Broken Cricket Dreams Cricket Blog (@cricket_broken) January 5, 2025
Here is a possible 2-year cycle with the holy grail of world cricket, the IPL, in the center. You know, there are not enough English & Australian cricketers in the IPL, so they may even expand the number of teams in the future.
Month/Year
Fixture
Nov-Feb
England Tour of India (5 Tests)
Mar-June
16-Team IPL
Jul-Aug
India Tour of England (5 Tests)
Aug-Sept
IPL in England (The Hundred)
Oct
ICC Trophy (ODI World Cup/Champions Trophy/T20 World Cup)
Nov-Jan
India Tour of Australia (5 Tests)
Nov-Jan
IPL in Australia (The Big Bash League)
Feb
ODI Tri-Series (Ind-Aus-Eng)
Mar-June
18-Team IPL
Jul-Aug
The Ashes: Australia Tour of England (5 Tests)
Aug-Sept
IPL in England (The Hundred)
Oct
ICC Trophy (ODI World Cup/Champions Trophy/T20 World Cup)
Nov-Feb
Australia Tour of India (5 Tests)
What about the format and detailed calendar of Group 2? Have I given it any thought you ask?
Yes, I have but that’s not important. Who cares about Sri Lanka, Pakistan, South Africa, West Indies, Afghanistan, Zimbabwe, Ireland anyway?
(You didn’t even notice that I totally skipped over New Zealand & Bangladesh, did ya?)
In any case, let’s skip that and march towards a more important discussion—the India-Pakistan non-rivalry, whose sole purpose is to enhance the pockets of the ICC.
In addition to the annual ICC Trophies, an annual Asia Cup is to be held in an undisclosed neutral location until one week before the trophy in whatever two weeks you can find in the cricketing calendar.
The unbiased randomized groups will be as follows:
Group 1: India, Pakistan
India-Pakistan will play 3 matches.
Winner of Group 1 goes to the Finals
Group 2: Sri Lanka, Bangladesh, Afghanistan, Nepal, Hong Kong, UAE
Each team plays against each other once
Winner of this group plays the loser of Group 1 in a Playoffs match for the second finalist spot.
We Must Preserve the Bumrahs of the World
Bumrah’s breakdown on the last day of the BGT series was disheartening to see. We must preserve the Bumrahs, Cummins, and Stokes’ of this world.
England have tried, tested, and failed with the rest, rotation, and retirement policy (see, Jimmy Anderson).
Ensuring the calendar only consists of the IPL and playing only two teams (with frequent breaks) will save these great cricketers.
(The Rabadas of the world are less important in the larger scheme of things, so we do not consider the non-Big 3 case).
But How will the West Indies earn money without England or India Touring?
The BCCI will not leave others behind, don’t worry. As Anurag Thakur said in 2016,
“The BCCI is against the two-tier Test system because the smaller countries will lose out and the BCCI wants to take care of them.”
Such an empathetic organization, the BCCI. So, how can the BCCI help them?
I have a brilliant idea: The 3-day Red Carpet Auction tour.
Let’s take the CPL for example (Caribbean IPL). This will be a star-studded three-day extravaganza where (1) the CPL auction is televised and marketed like never before to make money for the broadcasting companies, (2) CPL cricketers are paid hefty checks to skip Test cricket, and (3) Indian cricketers get a paid holiday to the Caribbean.
This will enrich the WICB without them having to pay millions of dollars to host Test cricket!
Alright, maybe this last idea was way off the charts.
Final Thoughts
This was meant to be a satirical article, but I think Jay Shah might actually take this as a serious proposal.
Jokes aside, the main issue is that preserving marquee series like the BGT and the Ashes, while trying to expand Test cricket. Cricket cannot claim to be a serious international sport with only 3 prospering countries.
Several former cricketers have welcomed the two-tiered system and more matches among the ‘top teams.’ Vaughan has been a proponent of a two-tiered system and recently penned an article with some interesting thoughts: A two-tiered system will save Test cricket. Here’s why.
(Side Note: Why wouldn’t he? Vaughan was commenting on the BGT tour even though he wasn’t from Australia or India. Former cricketers get contracting gigs by broadcasting companies. They won’t earn the same and stay relevant if they instead covered the Zimbabwe-Afghanistan series). Resources need to be distributed not only in hosting the matches, but also for higher quality broadcasting, commentating, umpiring, and standardized technology across the globe.
In all reality, a proper unbiased two-tiered system might never happen as articulated by Michael Holding:
Test cricket over the last few months has been nothing short of exhilarating.
Yes, the BGT was awesome, but NZ’s victory against India, England in Pakistan, young South Africa’s resurgence, Sri Lanka’s rise, Rahmat Shah & Rashid Khan’s heroics were the moments that made Test cricket really special over the last year.
Yes, we must preserve Test cricket. But we must preserve it for all.
If You’re Actually Wondering How I Would Actually Solve Problems in Cricket, Check out the following:
375 articles and four and a half years later, we are going back to our roots. Thanks to diplomat and cricket enthusiast—Michael Appleton to get me inspired and thinking on these lines again from this tweet:
To every 🏴 🇦🇺 🇮🇳 fan/journalist/former/current player complaining about the format of the WTC: I have a deal for you!
If you’re prepared to give up the five-match Test series that your three countries play, I can design a WTC in which everyone plays everyone the same amount!
That original article explored how to reduce the imbalance of the Big 3 (India, England, Australia) in WTC scheduling, but still keep the ‘marquee’ series like The Ashes or Border-Gavaskar Trophy. However, it was a bit too unrealistic.
Later, I would research how much money it takes to host a Test match and realized that finances are the root of almost all problems in the world of cricket. In all sense of the phrase—It’s the economy, stupid.
Today, I will try to put all of these ideas together and form a combined thesis towards a World Test Championship (WTC) system that (1) can realistically work in today’s world, (2) is financially viable, (3) includes equidistribution of Tests for every team, (4) implements two Test windows, and (5) come up with a realistic value for a Test match fund.
Part I: Solving the Equal Matches Per Team Problem
One of the major issues in the current iteration of the WTC is the imbalance of the number of Tests each team plays. This is due to the influence of the Big 3 as well as the high cost to host a Test.
Current World Test Championship Table
Here are the number of matches each team will play in the 2023-25 WTC cycle:
22 – England
19 – India, Australia
14 – New Zealand, Pakistan
13 – Sri Lanka, West Indies
12 – South Africa, Bangladesh
We can see that the Big 3 play 5-10 Tests more than each nation. This is mainly due to the ‘marquee’ series like Ashes (Aus-Eng), BGT (Aus-Ind), and Ind-Eng.
How can we keep the drama of the marquee series alive but ensure an equal footing for each team?
Solution: Sweet 17—One Match Sacrifice Required by The Big 3
To resolve this issue, we will introduce the two-tiered relegation promotion system.
Each tier will consist of six teams including Zimbabwe, Ireland, and Afghanistan (I mean, why give out Test status when you’re not going to have Afghanistan and Ireland play on a regular basis). We will show this by example with the current Top 6 rankings in the current WTC table.
Tier 1: India, Australia, England, South Africa, New Zealand, Sri Lanka
Tier 2: Pakistan, West Indies, Bangladesh, Ireland, Zimbabwe, Afghanistan
The Constraints
Once we had this framework, the next question was what is the ideal number of matches each team in Tier 1 can play so that (1) there are no two-Test series, (2) each of the six teams plays each other once, (3) there is an equal amount of home and away matches, (4) India-Australia-England get to keep their ‘marquee’ series, and (5) most importantly, each team plays the same number of games.
I treated this challenge as a Sudoku puzzle. And boy was this a tough challenge! (Photos of my scribbling with my earlier attempts are at the bottom of the article for your kind perusal).
20-matches? Too many. 16 matches? Not enough to satisfy all the constraints.
17? Ahh, there’s the goldilocks zone!
Here is the solution I came up with:
Each team plays two 4-Test series and three 3-Test series, for a total of 17 matches each.
The 17 Tests are going to be divided in 7-home, 7-away, and 3-neutral Tests, where each of the Big 3 get to host one neutral series.
The 7-home and 7-away matches will consist of exactly one 4-Test series and one 3-Test series.
Altogether, Tier 1 will consist of exactly 50 Tests.
Top 2 teams will compete in a 3-Test final series at a neutral venue (taking the total to 53 Tests).
The crux? India-Australia and the Ashes have to sacrifice the 5-Test series. I tried adding a 5-4-3 solution (one 5-match series, one 4-match, and one three match series, but it would require NZ-SL to play 5 Tests or the Ashes to be reduced to 3 Tests).
Two 4-match series worked out just right for everybody.
Tier 1 WTC Schedule Breakdown
IND
AUS
ENG
SA
NZ
SL
IND
X
4
4
3
3
3
AUS
4
X
4
3
3
3
ENG
4
4
X
3
3
3
SA
3
3
3
X
4
4
NZ
3
3
3
4
X
4
SL
3
3
3
4
4
X
Total
17
17
17
17
17
17
Legend
Home, Away
Neutral
Ind vs SL in Australia
Aus vs NZ in England
Eng vs SA in India
You can interpret the above table as follows: India hosts England (4 Tests) & New Zealand (3), play away tours to Australia (4 Tests) & South Africa (3), and finally play a 3-Test neutral series against Sri Lanka.
Tier 2 WTC Schedule Breakdown
Each team plays two 3-Test series and three 2-Test series, for a total of 12 matches each.
For this example, since Pakistan is in this tier, the UAE will be chosen as the neutral venue for all neutral matches.
Tier 2 will consist of exactly 36 Tests.
Top 2 teams will compete in a 3-Test final series at a neutral venue (taking the total to 39 Tests).
PAK
WI
BAN
ZIM
IRE
AFG
PAK
X
3
3
2
2
2
WI
3
X
3
2
2
2
BAN
3
3
X
2
2
2
ZIM
2
2
2
X
3
3
IRE
2
2
2
3
X
3
AFG
2
2
2
3
3
X
Total
12
12
12
12
12
12
Home, Away
Neutral
Pak vs Afg in UAE
WI vs Ire in UAE
Ban vs Zim in UAE
At the end of the WTC cycle, the bottom two teams from Tier 1 will be relegated to Tier 2, while both finalists from Tier 2 will be promoted to Tier 1.
Is it Too Much Test Cricket?
No.
Including the final series for both tiers, there will be a total of 92 Test matches in two years.
The first three iterations of the WTC had 61, 70, and 70 matches respectively. 92 here includes 12 Tests each for Zimbabwe, Afghanistan, Ireland and the two final series, which is pretty balanced overall.
The compromise for equal games for each team is that the Big 3 will play 3-5 Tests less than the usual, while the mid-tier teams will play 3-5 more Tests than usual.
In this model, we are asking South Africa, Sri Lanka, and New Zealand to host one 4-Test series in a two-year cycle, but do they have the money? Probably not (and that is why we are also having the neutral Tests hosted in India, England, Australia, or the UAE—countries that can afford it).
We had estimated last year that it takes a mammoth $350,000-$1.4 million to host a Test match and studied why teams like NZ & SA lose money while hosting a Test.
On the other of the spectrum, a series like Ashes can incur costs anywhere from $3-7 million. The cost depends on various factors such as technology, review system, support personnel, hotels, travel, security, etc. One quick example is Australian broadcasting using an 80-camera system for the BGT 2024-25 series.
Higher quality, but comes with higher costs.
Cost Estimation: So, How Much Money is Needed to Sustain a Fair WTC?
To estimate the cost of hosting the WTC, we will first presume that the Tests hosted by Big 3 as well as the two final series (3 Tests each) will be on the higher end of the hosting costs.
India, England, and Australia will each host 8 Teams (7 home + 1 neutral) for a total of 24 matches. The 6 Tests for the two final series will make it about 30 high-quality expensive Tests and 62 Tests on the lower end.
The 62 Tests will cost anywhere from $21.7 million-$86.8 million, while the 30 Tests will take about $70-210 million. Overall, a 92-Test WTC will cost somewhere between $91.7-296.8 million.
Where Will Get the Money From?
The ICC recently mentioned a possible $15 million Test match fund in the form of $10,000 minimum Test fee as well as a ‘touring fee’. That is a step in the right direction, but more targeted funding is needed.
In our WTC model, we are asking SA, SL, and NZ to host about 4 Tests more than they usually do and Afg, Zim, and Ireland to host 5 Tests each more than they usually do. That is about 27 extra Tests, which totals to $9.45 million-$37.8 million.
The ICC had a total surplus of $912 million as of December 2022 and have an estimated $200-$325 million profits in each of the last couple of years. Subsidizing the World Test Championship (WTC) with about 5-15% of their annual profits could solve the money problem.
If $17.5 million can be used to fund seven cricketers in a tournament that lasts less than 60 days, then surely $17.5 million could be found from somewhere (ICC + IPL + BCCI + sponsors) to fund six countries and Test cricket so it exists for the next 60 years.
The money in cricket exists. Just needs to be redistributed properly so that all interested parties are happy.
Note, from the current rankings, Tier 1 countries would include Australia, South Africa, and New Zealand. All of these 3 countries are located in the southern hemisphere and hence, will host all their home Tests in the November-January window, including the coveted Boxing Day Test.
West Indies, England, and Ireland will host both their home test series between the June-August window.
Meanwhile, subcontinental nations (India, Pakistan, Bangladesh, UAE) can be more flexible and host one home series in each window.
Solution: Two 2-Hemisphere Test Match Windows
Here is how a potential two year cycle could look with the two separate windows without overcrowding the international calendar. We try to schedule Test cricket during peak summer times in each hemisphere to gain the most attention.
Test Match Window 1 Matches (November – January)
Tier 1
India in Australia (4 Tests), South Africa in Australia (3 Tests), India vs Sri Lanka in Australia (3 Tests)
Sri Lanka in South Africa (4 Tests), India in South Africa (3 Tests)
South Africa in New Zealand (4 Tests), England in New Zealand (3 Tests)
England in India (4 Tests), England vs South Africa in India (3 Tests)
Australia in Sri Lanka (3 Tests)
Tier 2
Bangladesh in Pakistan (3 Tests)
Afghanistan in Zimbabwe (3 Tests), Pakistan in Zimbabwe (2 Tests)
West Indies in Bangladesh (3 Tests)
Ireland in Afghanistan* (3 Tests)
West Indies vs Ireland in UAE (2 Tests), Bangladesh vs Zimbabwe in UAE (2 Tests)
Test Match Window 2 Matches (June – August)
Tier 1
Australia in England (4 Tests), Sri Lanka in England (3 Tests), Australia vs New Zealand in England (3 Tests)
New Zealand in India (3 Tests)
New Zealand in Sri Lanka (4 Tests)
Tier 2
Zimbabwe in Ireland (3 Tests), Bangladesh in Ireland (2 Tests)
Pakistan in West Indies (3 Tests), Zimbabwe in West Indies (2 Tests)
Bonus: Will West Indies Never Play India or Australia Again in this Model?
I know what you might be thinking.
If India, Australia, or England never relegate and West Indies never get promoted…are the days of the mighty West Indies versus the Australians and Indians over? 60 years of legacy down the drain?
Not quite. We have an addendum for this scenario as well.
One Optional Friendly Series Between the Two Tiers
If both teams agree (and there is space in the international calendar), an optional 1 to 3-match friendly Test series can be played between a country of the first and second tier. In our example, we may have:
India vs Afghanistan
Australia vs Zimbabwe (This is never going to happen, is it?)
Australia vs Pakistan
England vs Ireland
South Africa vs Zimbabwe
New Zealand vs West Indies
Sri Lanka vs Bangladesh
This can serve as (1) a practice tour (India playing Zimbabwe on way to their South Africa series), (2) a promotional event (India-Pakistan one-off Test in UAE), or (3) an actual friendly series to encourage lower-ranked countries to stay serious about Test cricket.
Final Thoughts
Is it the perfect plan?
No. In fact, there is never such a thing as a ‘perfect plan.’
But we can continue to strive for a more perfect system, can’t we?
At least it is good to see that World Test Championship (WTC) is taking flight. 4 years ago, not many took this as a serious competition or offered solutions. Now there is plenty of debate, which is good to see.
In 2020, I was quixotic with my outlook on cricket. Thought anything was possible.
In 2021, I was hopeless, doubting the system at every stage.
By the time we reached 2024, I became practical. And as we approach 2025, I have become a little more realistic.
Hopefully, this solution is actually realistic for the ICC and others in charge of cricket to consider.
****
Thank you all for reading! Comment below (or on social media about your thoughts and suggestions).
PS: Here is some bonus work on trying to find the ideal number of matches each team should play.
1403 days since Rishabh Pant steered the ball towards the rope against a relentless Josh Hazlewood at the Gabba, the most anticipated series of the 21st century is back!
Yes, I am talking about the Border Gavaskar Trophy. This time it is bigger and better—5 Tests instead of four.
After two back-to-back wins, can India secure a hat-trick in Australia and stamp their authority? Will the BGT remain competitive? Who will qualify for the WTC finals?
In the 2018/19 tour, Pujara scored 521 runs at an average of 74.42 with 3 hundreds and 1 fifty, helping India win their first Test series win in Australia. More importantly, he faced 1258 balls, 574 (or 95.4 overs) more than the next highest, Virat Kohli (684 balls faced). Australia’s best was Usman Khawaja at 592 balls.
In 2020/21, Pujara was not in as red hot form. He was the fourth highest run-scorer in the series with 271 runs at 33.87 average. However, yet again, he faced 928 balls, more than any batter on either side (Labuschagne faced 850 balls, best for Australia).
Gill was earmarked for this role. However, he is out with an injury in the first match. India needs to find 1-2 players to dent the new ball. For Australia, Khawaja-Labuschange both have the pedigree, but they need to stay in the game when it matters the most.
Let’s rewind back three years. It was one of the best Test series of all time, but it was marred by injuries.
Pucovski, Warner, Ishant Sharma, Bhuvneshwar Kumar were injured prior to the series. During the series, Kohli had to go back and Shami, Umesh, Ashwin, Vihari, Jadeja, Bumrah, Rahul, and Pucovski again were injured.
Pucovski’s career has sadly almost ended at the age of 26 due to his repeated concussion battles. For India, Mohammad Shami has been out of action for almost a year and just getting back to domestic cricket. Rohit Sharma will be starting late due to birth of a child, and Shubman Gill & KL Rahul have already had injury scares leading up to the first Test.
I hope these scares are temporary, and we have a hard fought but injury free two months from both sides.
Steve Smith re-invented himself as an opener last season with middling success—12, 11*, 6, 91*, 31, 0, 11, 9 against West Indies and New Zealand. It is time he gets back to his beloved #4 spot and solidifies Australia’s middle order along with India’s arch-nemesis November specialist, Travis Head.
All eyes will also be on the highly rated 25-year old Nathan McSweeney, who is coming off a rich vein of form: 55 & 127* in the first Sheffield Shield match and 137 (131) in a List A match that followed. He ended with 39, 88*, 14, & 25 in the India A series.
For India, without Rohit and Shubman, India would have to go with an inexperienced trio of Jaiswal, Rahul/Easwaran, and Padikkal. KL Rahul averages 40.02 batting at #1 with 4 hundreds & 8 fifties (41 innings) and 28.78 batting at #2 with 3 hundreds & 4 fifties (34 innings).
The opening session may dictate how each of the Test turns out. India somehow recovered from 36/9 to win the series 2-1 last time, but that is once in a generation kind of stuff. If Hazlewood & Starc get going in the first session of a match, they can run through India’s top order pretty quickly.
On the flip side, Rohit’s counterattacking approach could be a delight to watch and may put Starc off his lines.
Recent history shows that if India are to win, they have to take their 20 wickets. I am excited to watch Akash Deep and Prasidh Krishna (if he gets a chance) on bouncy Australian pitches. And I am looking forward to at least one surprising slower yorker from the one and only, Jasprit Bumrah.
Virat Kohli has been a shadow of himself in the recent past in Test cricket. However, if there is one nation where Kohli can get his aggressive in-form self back out, it is in Australia. The pitches will suit him, and the runs will hopefully follow.
🚨 Average of #4 Batters in the Last 4 Years (Minimum 20 Innings)
— Broken Cricket Dreams Cricket Blog (@cricket_broken) October 25, 2024
Bowling throughout the day against India’s middle order batters, will be Pat Cummins.
That man can bowl and bowl and keep on bowling. He bowled an absurd 162.1 overs in 2020/21 against India. Cummins vs Kohli will be a mouth watering match or even series-deciding.
Ravichandran Ashwin, 105 matches, 536 wickets, 37 5-fers. His batting has been a revelation in recent years as well.
Integral part of their respective sides in the last decade, we are sure to witness a final great battle between these two legends. The real question is, will Ashwin even get a look in, especially with Sundar’s show against New Zealand (and his knocks at the Gabba)? Where does Jadeja fit into the equation?
Three left-handers will be the X factors to watch out for. As always, the dangerous Rishabh Pant who has tilted the last two series on its head, the WTC final & World Cup final hero, Travis Head…and Alex Carey.
Did you say Alex Carey!?!
Yes, I said Alex Carey.
Yes, he had a pretty awful 2023, averaging just 24.26 after 20 innings. However, his 2024 looks a lot better, and he scored a 98* in his last Test vs New Zealand. Since September, his figures are as follows:
74, 77*, 13 (England ODIs), 90, 111, 42, 123*, 44, 42 (Sheffield Shield), 6, 36, 75 (List A). Something is brewing here…And we all know how India are against lower order batters and cleaning up the tail (Rewind your memories to Sam Curran 2018).
Pant has had meaningful contributions in every single one of his knocks in Australia. Surely, he can’t do it with this consistency yet again? Or can he?
*Rohit Sharma is currently out on fatherhood duties and Shubman Gill suffered an injury. For the first test, KL Rahul (looks like he has recovered from his injury scare) and Devdutt Padikkal (who performed well in the India A game in Australia) may make an appearance.
Expect to see Sarfaraz Khan and Prasidh Krishna to get a game or two throughout the series.
Others in Squad: Abhimanyu Easwaran, Ravindra Jadeja, Harshit Rana
Others in Squad for 1st Test: Scott Boland, Josh Inglis (WK)
Series Predictions
A jarring fact is that the senior Indian side are coming in with zero practice matches. They cancelled their official match against India A as well.
With a long drawn out 5-match series, I think the home side are favorites to begin with. No matter how it is going to end, it is going to be a cracker of a contest. Expect one Sydney 2020-like hard fought draw, 3 close contests with numerous ebbs and flows, and 1 completely one-sided contest.
What about the WTC? India’s chances are looking bleak at the moment. 3 or 4-0 win against Australia is a bit unreasonable to expect. If it happens, it would be a spectacle! But once again, would give Australia an upper hand (and do not forget, South Africa, Sri Lanka, New Zealand are still well and truly in the running!)
In any case, here are my predictions, comment below on yours!
India
Australia
Scoreline
1
3
Most Runs
Virat Kohli
Steve Smith
Most Wickets
Akash Deep
Josh Hazlewood
X-Factor
Shubman Gill
Usman Khawaja
Surprise Package
Nitish Reddy
Alex Carey
Broken Dreams?
This may be the final BGT Trophy in Australia for Nathan Lyon, Ravichandran Ashwin, Virat Kohli, and Rohit Sharma.
If this is the final time, I hope they all get a chance to shine and make us smile.
All the best!
***
Thanks for reading!
Before you Go, Please Buy my Book on Amazon on the Life Lessons from the Border Gavaskar Trophy!
How do they compare to the standards of the English county teams? Which domestic teams made the largest strides in the last 1-2 years? And more.
I went through 504 pages of annual reports of these six clubs, so you don’t have to.
Without further ado, let’s jump right in.
Key Takeaways
Western Australia ($43 million profit), South Australia ($3.6 million), New South Wales ($1.4 million), and Queensland ($970,000) made profits in the last year, while Victoria ($180,000 loss) and Tasmania ($1.6 million) suffered narrow losses.
Western Australia ($111 million), South Australia ($101 million), NSW ($99 million), and Victoria ($83 million) have the largest total assets.
The largest total liabilities also lies with Western Australia ($50 million) with NSW ($13 million) coming in next.
Which Australian Domestic Team Earned the Most Money in 2023-2024?
The data provided is from the annual reports of each domestic team with financials accounted for the annual period ending on 30 June, 2024. Note that the ‘total comprehensive income’ (revenue – expenses for the year) is denoted as the ‘annual income’ in the tables below.
Note: All amounts are presented in Australian Dollar (AUD). The conversion between USD and AUD on 11/17/2024 is as follows: $1 AUD = $0.65 USD or $1 USD = $1.55 AUD.
1. Western Australia ($43 Million Profit)
Home Ground: Perth Stadium, WACA
Financial Health Status:Green
Assessment: The WACA Ground Improvement Project (WGIP) grant has inflated the revenues and assets for WA’s 2023-24 financial statement. Altogether Western Australia
“The final net result for the year was a surplus of $43,331,783 ($3,545,655 in 2022-23), achieved after including capital grants relating to the WACA Ground Improvement Project (WGIP) which have been recognised as revenue during the year….The net result from our normal business operations excluding WGIP related items was a deficit of $1,625,663 (surplus of $1,283,001 in 2022-23).“
Highlights from Executive Report
“Our success on and off the field would not have been possible without the support of our growing Membership, with a record number of 4,800 new Members across WACA and Perth Scorchers products this season.”
Other Key Points
Total cost for WGIP is $168,908,797 which will be funded by a combination of the state government ($109.7 million), federal government ($30 million), WA Cricket ($11 million), Cricket Australia ($4 million), and other funding sources. The project is set to be completed by July 2025.
Employee benefit expenses ($24.4 million in 2024 and $20.8 million in 2023) take up the largest portion of WA’s expenses. Contractors and consultant expenses also increased from $3.3 million in 2023 to $4.7 million in 2024.
+2% growth in children 5-12 playing cricket, +3% growth in junior boys, +5% growth in junior girls, +7% girls in Woolworths Cricket Blast, +13% increase in registered participation among women & girls.
“This summer, more than 18,000 Members attended international cricket, including the Men’s Test Match and T20 against the West Indies as well as the Women’s ODI against South Africa. More than 12,000 Members also attended WBBL Strikers games at Adelaide Oval and the Karen Rolton Oval. These numbers show that cricket is alive and well in this passionate sporting state.”
Other Key Points
Employee benefit expenses ($23.4 million – 2024 and $20.7 million – 2023) contributed to their largest expense,, while sales income ($52.6 million) generated the largest share of their income.
18% increase in girls cricket, 32% increase in SACA’s Primary School Cricket Competition, 5,660 registered in Junior cricket for ages 5-12 (4% increase)
Assessment: Although revenue remained steady in 2024, NSW’s expenses have increased this year. Since Cricket Australia’s distribution to NSW’s revenue will not increase, NSW had to make structural reorganization to balance their budgets for the upcoming year.
“Financially, we performed effectively again, recording a small deficit against a break-even operating budget and achieving a better than budget result in our total comprehensive income…Unfortunately, confirmation from Cricket Australia that there would be no increase in their distribution for 2024/25 required us to look at our cost structure and resulted in a reshaping of our organization.”
Highlights from Chairman’s Report
“The game of cricket itself continues to grow around the world. Cricket is now the second most loved sport in the world and the revenues in our game globally have grown substantially. Cricket NSW is determined to ensure Australia doesn’t get left behind…Last year Cricket NSW entered into an arrangement with Major League Cricket in the United States and helped develop the T20 league in that country. And we continue to push the cricketing world to ensure the traditional (and to many the best) format of our great game, Test cricket, doesn’t just survive but thrives.”
Other Key Points
“Cricket balls are one of the biggest expenses clubs incur during the season” and the $10,000 donation from Homestar Finance helped purchase cricket balls for 17 clubs in the region.
Cricket Australia Distributions provided the largest factor in revenue in 2024 ($43.3 million our of $64.1 million).
Players payment pool ($14.6 million), cricket performance ($10.47 million), and match/venue ($10.47 million) were the largest expenses for NSW.
30% increase in 5-12 year old cricket, including 50% increase for 5-12 year old girls.
Assessment: Financially, the revenue and expenses both increased, keeping them relatively stable. However, it was quite evident from the annual report that Queensland is disappointed in not hosting a Gabba Test in the 2026-27 season due to government’s Olympic planning.
“The State Government’s decision to not progress with its commitment to rebuild the Gabba and downgrade its proposed Olympic role has resulted in direct and indirect changes to how we proceed with our business…The most obvious impact will be that for the first time since 1976-77, a Test match will not be held at the Gabba in 2026-27…It is deeply disappointing that the 2026-27 Gabba Test has become a casualty of the uncertainty around the infrastructure planning and development ahead of the 2023 Olympic preparations.”
Highlights from CEO’s Report
“…Queensland Cricket was again able to achieve its budgeted financial surplus target for the year…The surplus amounted to $968,451 (2023: $863,602) which incorporates an amount of $442,142 representing gains from the QCA Future Fund. Excluding this amount, which is not available for general use, the net operating surplus for the year was $526,309.”
Other Key Points
ACIF (Australian Cricket Infrastructure Fund) contributed about $13 million across two rounds in improved cricket facilities and infrastructure.
“Participation in junior club cricket remains flat Statewide and has decreased in some regions.”
On the other hand, girls cricket is growing with 152% and 290% increase in Brisbane North and Bayside East/Redlands regions respectively. North Queensland has also seen a 1,000+ participation increase (27%).
TV viewership for Brisbane Heat in the BBL season average 759K per game. In particular, “Channel Seven’s free to air coverage was a particular highlight…[viewership] increasing by 40%” for Heat matches.
Employee benefits expense ($24.3 million – 2024, $21.2 million – 2023) was the largest expense for Queensland, with ‘state cricket match expenses’ coming next with around $3.8 million for 2024 ($4.3 million for 2023).
“…Cricket Victoria concluded the year reporting a $184,000 deficit for 2023-24…Pleasingly, key BBL revenue streams including ticketing and sponsorship continued to grow and return towards pre COVID levels. We also saw growth continuing across our new revenue streams – Cricket Victoria Foundation, School Holiday Programs and Melbourne Cricket Education Academy. Additional costs were incurred through the BBL season, as well as set up costs associated with the roll-out of new revenue initiatives that are planned for FY25 including the Victoria Health Club and Melbourne Cricket Academy.”
Highlight from Director’s Report
“Costs increased versus prior year, notably in employee related expenses reflecting the increase in payments to both male and female players. Employee expenses also rose with new roles added to support revenue growth initiatives and high performance, as well as general cost of living and legislated increases.”
Other Key Points
Men/boy’s participation grew 7.3%, women’s/girl’s participation grew 14.3% with over 41,000 boys/girls registered in the 5-12 year age group.
Over 60 projects received $1.3 million from ACIF for infrastructure improvement.
Employee, player, volunteer, and contractor benefit expenses was the largest expense incurred by Cricket Australia ($29.7 million – 2024, $25.7 million – 2023).
Home Ground: Bellerive Oval, Macquare Point Stadium, UTAS Stadium
Financial Health Status:Yellow
Assessment: While revenue streams remained steady for Tasmania between 2023 & 2024, expenses increased by about $4.5 million. The annual report offered positive outlook nevertheless with growing popularity, investment, and awareness of the sport in Tasmania.
“Investment in infrastructure is imperative from a professional and game development point of view, and the Macquarie Point Stadium project presents an exciting opportunity for sport in our State and for young Tasmanians to fulfill their dreams at home. I am firmly of the view that this is the sort of positive change that can set both Tasmania and cricket up to thrive in the future.”
After going through all these annual reports, one thing is clear—Australian cricket is thriving!
Membership is growing, investment and infrastructure development projects are on the rise, and the growth in junior girls cricket is on the rise as well. No wonder Australia continues to dominate world cricket and win trophies in both women’s and men’s cricket. They have a prospering and financially stable domestic system.
A common theme between all the teams was that expenses increased from 2023 to 2024 due to employee benefit and payment increase, which is probably a good thing. As long as the revenue continues to increase as well, the future looks good for Australian cricket.
****
Thanks for reading!
Before you Go, Please Check out my Book on Amazon on the Life Lessons from the Border Gavaskar Trophy!
Four years ago I was really excited when the idea of the World Test Championship came out. I mean, it was partially a reason for me to start this blog.
However, with the recent overseas wins of NZ in India, SA in Bangladesh, and Bangladesh in Pakistan—that hope has rekindled.
Therefore, this is a good time for us to revisit the WTC alternative points table algorithm my friend and I had created four years ago to create a more balanced system. For this WTC cycle, I analyzed each of the 51 Test matches and 578 completed sessions one-by-one so you don’t have to.
Before we start, he is a quick refresher on how our alternative points table worked.
Our WTC points table algorithm (1) distributes points on a session-by-session basis rather than an all-or-nothing system for a Test match, (2) includes Home/Away points for both wins & draws, and (3) includes a bonus to reward massive victories (Test match net run rate equivalent).
Points are calculated as follows:
2 points per session won, 1 point per session Tied
There are 15 maximum sessions in a Test (3 sessions per day), so 30 points maximum per Test for the session-by-session category
The details of the algorithm used to decide who won each session is outlined in the original article and is left as an exercise to the reader.
Bonus: 2 * (Number of Sessions Remaining)
Example: If the Test finishes at the end of Day 4, the winning team would get 6 bonus points – (2 * (3 sessions remaining))
Home/Away
Away wins and away draws would be awarded more points.
16 – Home Win, 8 – Home Draw
24 – Away Win, 12 – Away Draw
The maximum points a team could earn per Test is outlined below (Example: 24 – away win points + 30 session points = 54 total if the team won all the sessions).
Points
Win
Draw
Loss
Maximum Points Possible (Per Match)
Home
16
8
0
46
Away
24
12
0
54
Average*
20
10
0
50
Home & Away Points
Finally, since each team plays a different number of matches, we will take a percentage determined by (total points earned)/(maximum points possible*).
The maximum points possible will be determined by (number of matches played * 50), where we choose 50 because it is the average between 46 & 54 and would hence, weight away wins & draws more.
I coded this algorithm in R & Python and double checked the calculations by hand for the session-by-session analysis.
🇦🇺 BEAT 🏴 by 2 wickets, Birmingham 🇦🇺 BEAT 🏴 by 43 runs, Lord’s 🇮🇳 BEAT 🌴 by inn & 141 runs, Roseau 🇵🇰 BEAT 🇱🇰 by 4 wickets, Galle 🇵🇰 BEAT 🇱🇰 by inn & 222 runs, SSC 🇳🇿 BEAT 🇧🇩 by 4 wickets, Mirpur 🇮🇳 BEAT 🇿🇦 by 7 wickets, Cape Town 🌴 BEAT 🇦🇺 by 8 runs, Brisbane 🏴 BEAT 🇮🇳… pic.twitter.com/b55YlIHHzZ
— Broken Cricket Dreams Cricket Blog (@cricket_broken) November 10, 2024
Key Takeaways
45% (23/51) WTC matches in this cycle so far have been won by away teams.
England (79) & India (76) won the most sessions so far, while Australia (47) have tied the most sessions. West Indies (24) & Bangladesh (29) have had the least session wins in this cycle of the WTC so far
We have had a spectacular run of dramatic overseas victories. Each team has had at least one overseas win:
South Africa 1-0 in West Indies & 2-0 in Bangladesh
Australia won 2 Tests each in England & New Zealand
Bangladesh won in Pakistan 2-0
Pakistan won 2-0 in Sri Lanka
Sri Lanka won 2-0 in Bangladesh and a Test in England
England won one Test each in India & Pakistan
The India vs South Africa Test at Cape Town was the shortest Test ever, lasting only 5 sessions.
South Africa won all 9 out of 9 sessions in the recent 2nd Test vs Bangladesh and received the maximum possible 54 points for the Test in our points system.
WTC 2023-2025 Alternative Points Table – Results
Here is our alternative WTC 2023-25 points table at a glance.
Team
Total Points
AverageMax Points Possible*
BCD Percentage
Actual WTC Percentage
Australia
379
600
63.17%
62.50%
India
410
700
58.60%
58.33%
South Africa
233
400
58.25%
54.17%
Sri Lanka
239
450
53.11%
55.56%
New Zealand
277
550
50.36%
54.55%
England
411
950
43.26%
40.79%
Pakistan
206
500
41.2%
33.33%
Bangladesh
162
500
32.4%
27.50%
West Indies
122
450
27.11%
18.52%
*Note: We have added the same over-rate deductions as the current WTC table does (19 for England, 10 – Australia, 8 – Pakistan, 3 – Bangladesh 2 – India)
Observations
Our points table heavily rewards South Africa, who have dominated 3 overseas Tests (1 vs WI, 2 vs Bangladesh).
Sri Lanka are close by with 3 overseas Tests wins as well (2 vs Bangladesh, 1 vs England) but they lost points to Pakistan at home. Similarly, NZ had a good show vs Bangladesh & India away, but lost convincingly 0-2 against Australia (home) & Sri Lanka (away)
The interesting point our points table highlights is showcasing how close a Test match or Test series was. For example, the 2-2 Ashes translates into 132-118 in favor of Australia (due to overseas wins and draw).
In addition, no two Test series are alike.
The Pakistan-Bangladesh 2-Test series (where Pakistan batted well initially and even declared) resulted in 84-24 points in favor of Bangladesh. This series was closer than the SA-Ban series (101-7 in favor of SA), where SA completely decimated Bangladesh.
Appendix: WTC 2023-25 Match By Match Break Down
If you want to look at the particular series or team, here is a table of content organized by home team for easier access:
In The Alchemist, a young shepherd named Santiago from the Andalusian region of Spain leaves his simple life to chase a dream, which he calls his ‘Personal Legend.’
He embarks on a journey of self-discovery filled with unexpected twists and turns.
Along the way, he learns several life lessons. One of my favorites is,
“When you want something, all the universe conspires in helping you achieve it.”
– Paul Coelho, The Alchemist
****
New Zealand Lift the 2024 T20 Women’s World Cup
Just like Santiago, today we celebrate Sophie Devine’s incredible journey. After 14 long years, the universe has conspired to help Sophie Devine finally lift the T20 World Cup Trophy, this time as captain.
Remember, the White Ferns narrowly missed out on World cup glory in the inaugural 2009 and 2010 T20 World Cup editions.
What Happened in the 2010 T20 World Cup Final, You Ask?
14 years ago, the Boot Happened.
The Boot? Yes, the boot.
Specifically, Ellyse Perry’s boot.
5 runs needed in the final ball, 4 runs for a Super happen. Watch what happens yourself.
Sophie hit a crisp straight drive, only to be denied by Ellyse Perry.
She was stranded on 38*, just one hit away from a World Cup.
Sophie Devine must have been devastated. Unfortunately, it was not meant to be. In her own words,
“I have had nightmares about that Ellyse Perry right boot. Think we were so close in that match.”
Her love for sports came through her dad, who was also her first coach. She grew up playing all sorts of different sports but cricket & field hockey took center stage as she entered university.
She became the White Ferns captain in 2020 during the form of her life and the 2024 T20 World Cup was to be her last T20 tournament as captain.
“It’s Only Those Who are Persistent, and Willing to Study Things Deeply, who Achieve the Master Work.”
Devine wasn’t always the power-hitting batter we now come to think of.
She actually burst onto the scene as a young 17-year old bowler who batted at #11.
In T20Is, she wouldn’t play a major match-winning innings until she was promoted to #4 in 2010, scoring 35 & 48 against Australia. She would score her first fifty in 2012. Devine didn’t even play a single ODI between 2010 and 2013. She would make an ODI comeback in 2013 and score her first ODI hundred, a magnificent 145, that too in a World Cup.
With the ball, she brought her best to the T20 World Cups – 3/18 and 4/22 (semi-final) in 2016, and 3/18 in the 2020 T20 World Cup.
Her evolution in turning herself into a dependable top order batter and one of the greatest all-rounders the world has ever seen is a testament to the hard work and dedication she put in to hone her craft.
Santiago found help in his journey—a merchant under whose tutelage he learned trade skills, a Gypsy who interpreted his dreams, an Englishman who knew alchemy, the love of his life in Fatima that gave him direction, a tribal chief, and many others who guided him along the way.
****
Devine similarly had a cast of members she could depend upon in the 2024 World Cup.
She embraced herself as one of the self-proclaimed ‘grandmas’ of the team. Alongside Devine were Suzie Bates, who became the most capped women’s player across formats (and fun fact, she also represented NZ in the 2008 Olympics as a basketball player) and Lea Tahuhu, once the fastest women bowler in the world.
They also had a cast of up and coming players such as Eden Carson, Georgia Plimmer, Brooke Halliday, Rosemary Mair, and a 24-year old Amelia Kerr who already has eight years of international cricket, an ODI double century, and (now) 188 international wickets to her name.
“The secret of life, though, is to fall seven times and to get up eight times.”
The senior trio must have known deep in their hearts that 2024 was their final chance.
Sophie Devine & Suzie Bates had fallen 8 consecutive times, and this was to be Tahuhu’s 5th T20 World Cup as well. Their recent T20 World Cup record didn’t ooze much confidence.
And there must have been some doubts creeping in as well.
After all, the White Ferns were coming off a 10-match losing streak.
Tahuhu’s economy in the previous 5 matches before the WC hovered between 8-12.5. Bates hadn’t made a half-century for 12 straight games even as an opener. Apart from two fifties, Devine had nothing to show with the bat with scores of 17, 0, 9, 5, 12, 4, and 5 in the entirety of 2024.
In any case, even after falling for eight times and the losing streak, they got up for a 9th time.
And as it would turn out, 9th time was the charm for Devine & Bates.
“Sometimes There is No Way to Hold Back The River”
So, how did the White Ferns manage to win the T20 World Cup against all odds?
Devine’s 57* and Mair’s 4/19 against India set the tone, but the World Cup victory was definitely a team effort.
Amelia Kerr’s historic all-round effort while limping in the final, en route to becoming the player of the tournament, was superhuman. Halliday’s impetus in the final, Tahuhu’s 1-run over that caused South Africa’s collapse, Eden Carson’s semi-final performance (and her interviews), the find of Georgia Plimmer, the spinners’ contribution, Gaze’s gaze behind the stumps, and Maddy Green’s catching, it all added up in the end.
No New Zealand batter made the Top 4 run scorer list (Bates & Plimmer were NZ’s best with 150 runs each at joint #5). With the ball, Kerr was #1 (15 wickets), with plenty of support from Mair (10) and Carson (9).
Fielding was a hallmark of New Zealand’s campaign in an otherwise low catching standard for a World Cup. Bates (7 catches), Maddy Green (6), and Devine (5) dominated the catching charts.
Devine doesn’t necessarily like the cringy ‘Devine intervention’, but this time, maybe it was divine intervention.
Sometimes, what is bound to happen will happen. Sometimes there is no way to hold back the river.
37-year-old Suzie Bates. 35-year-old Sophie Devine.
Two legendary players of New Zealand cricket have won the World Cup, What a day in Cricket ♥️ pic.twitter.com/WYpE8KzXkU
What Can We Learn from Sophie Devine and the White Ferns?
After narrowly missing on the 2010 T20 World Cup win and consecutive World Cup defeats, Devine and Bates never gave up. Sometimes the universe does conspire to reward those who refuse to quit.
I’ll leave you with a final Alchemist quote,
“People are capable, at any time in their lives, of doing what they dream of.”
– Paul Coelho, The Alchemist
It doesn’t matter whether you are beginning your career or are towards the close. It is never too late to dream. Keep on dreaming even if it looks like the hope is fading away.
This is a remarkable victory, one of the greatest in New Zealand’s sporting history for sure. Remember though, more than winning, the journey is important, as it was in both Santiago & Devine’s cases. In Devine’s own words,
“I have played for 17-18 years now. It [World Cup win] will be something that will come with so much loss and hard times but also incredible memories and people along the way.”
– Sophie Devine
And why not end it with my favorite clip of the 2024 T20 World Cup?
The 2024 T20 World Cup is around the corner and only question is in everyone’s mind—Can the mighty Australians be defeated?
In 8 T20 World Cups so far, they have won six, were runners-up and semi-finalists in the other two. West Indies & England are the only other two winners, although India & South Africa have upped their credentials recently in the shortest international format.
The World Cup has been moved from Bangladesh to the UAE, and Scotland are the newest entrants in the Women’s T20 World Cup.
The format? 10 Teams, 2 Groups of 5 followed by semi-finals and a final:
Group A: Australia, India, New Zealand, Pakistan, Sri Lanka
Group B: Bangladesh, England, Scotland, South Africa, West Indies
I went through all 150 players’ ESPNCricinfo profile pages and accumulated this data so you don’t have to. Without further ado, here is a quick snapshot of what you can expect in the Women’s 2024 T20 World Cup.
Key Takeaways
Bangladesh & Scotland are fielding the youngest units (averaging the age of 25), while Sri Lanka (30) and West Indies (29) have the oldest average age.
Australia has the most experienced squad averaging about 66 matches per player, while Scotland has the least experience, averaging 33 matches per player.
India has the highest total number of runs scored (13,820) followed closely by Australia (12,163), England (11,769), and New Zealand (11,376).
West Indies and Sri Lanka have the highest total number of wickets taken (592 each), while Scotland (261), Bangladesh (302), Pakistan (389), and India (421) have the lowest.
Australia have won each of their last 10 T20Is, England has won 9/10, and New Zealand has lost all 10 out of 10.
Here is a quick statistical glance at each team separated by groups.
Table of Contents
Jump to the preview of the team you want to look into or predictions at the very bottom.
2024 T20 Women’s Cricket World Cup: The Ultimate Preview
*Note: The average T20I experience and average age are rounded up.
1. Australia T20 World Cup Preview
World Cup History: SF, Won, Won, Won, Runners-Up, Won, Won, Won
Last 10 Matches (Most Recent First): WWWWWWWWWW
Group Stage Opponents (In Order): SL, NZ, Pak, Ind
Australia Team Characteristics
Average T20I Experience
66 Matches (980 among 15 players)
Average Age
28
Total T20I Runs
12,163
Total T20I Wickets
568
# of Left Handed Batters in Top 8
2
# of Bowling Options
12 (7 Right Arm Pace, 2 Off Spin, 2 Leg Spin, 1 Left Arm Spin)
# of Keeping Options
2
Strengths
The Australian all-rounders are the envy of the world: Ellyse Perry, Tahlia McGrath, and Ash Gardner to name a few. Key to Australia’s bowling strategies, they are also the engine room. Time and time again, rescuing Australia or providing the big finishes. And in case any of them have to be left of the XI, Annabel Sutherland is waiting in the wings. Amazing depth!
Weaknesses
Will the lack of Meg Lanning leave a whole in the middle order? Also, how will Healy take the pressure of T20 World Cup captaincy? Also the heat in the UAE has been a talking point leading up to the makeshift World Cup in the UAE.
Look Out for
With the Ball: Sophie Molineux. Her spin will be crucial to keeping the run rate down in UAE conditions.
With the Bat:Phoebe Litchfield. This 21-year old future star is averaging 42.5 and striking at 158.38 in her 10 inning T20I career so far.
World Cup History: Round 1*, Round 1, Round 1, Round 1, Round 1
Last 10 Matches: LWWLLLLLLL
Group Stage Opponents: Sco, Eng, WI, SA
*qualified for the first time in 2014
Bangladesh Team Characteristics
Average T20I Experience
42 (619 among 15 players*)
Average Age
25
Total T20I Runs
4,944
Total T20I Wickets
302
# of Left Handed Batters in Top 8
1
# of Bowling Options
9 (4 Right Arm Pace, 3 Leg Spin, 1 Left Arm Spin, 1 Off Spin)
# of Keeping Options
1
Fun Fact: 2 Debutants in the Squad
Strengths
Sultana is carrying some form from the Asia Cup—48*(59), 62*(37), and 32 (51).
Weaknesses
After the Asia Cup, Bangladesh made five changes to the World Cup squad with Rumana Ahmed, Rubya Haider, Ishma Tanjim, Sabikun Nahar, and Shorifa Khatun dropped. Unsettled squad is not a good sign going to a world cup. Also the noise outside of cricket may affect the players. With the revolution in Bangladesh and the WC moved out from Bangladesh to the UAE, things are all over the place for the Tigers currently.
Look Out for
With the Ball:Jahanara Alam, one of the faster bowlers in women’s cricket, can she make use of the UAE pitches to the fullest?
With the Bat:Nigar Sultana. Captain will have to lead from the front if Bangladesh has any chance.
Expected Starting XI: 1. D Akter, 2. M Khatun, 3. Mostary, 4. Sultana (WK), 5. Nehar, 6. S Akter, 7. R Moni, 8. R Khan, 9. N Akter, 10. Alam, 11. S Khatun
World Cup History: Won, Round 1, Runners-Up, Runners-Up, SF, Runners-Up, SF, SF
Last 10 Matches: LWWWWWWWWW
Group Stage Opponents: Ban, SA, Sco, WI
England Team Characteristics
Average T20I Experience
60 (890 Matches Among 15 Players)
Average Age
26
Total T20I Runs
11,769
Total T20I Wickets
474
# of Left Handed Batters in Top 8
1
# of Bowling Options
12 (3 Right Arm Pace, 1 Left Arm Pace, 2 Left Arm Spin, 4 Off Spin, 2 Leg Spin)
# of Keeping Options
2
Strengths
Momentum. England have won 9 out of their 10 recent T20Is, although they lost the most recent one against Ireland—A team that did not qualify for the T20 World Cup. Another strength is the core experience in Danni Wyatt, Heather Knight, Amy Jones, and Nat Sciver-Brunt.
Weaknesses
The lower middle order has not had much of an opportunity.
Look Out for
With the Ball:Sophie Ecclestone and Lauren Bell. Ecclestone has been at her economical best this year: 4.75, 7.5, 4.25, 3.88, 4.75, 9.0, 8.5, 6.25, 4.0, 7.5. Bell has taken 2 wickets or more in six of her last T20Is.
With the Bat: Sophia Dunkley is the next big player in England cricket. She has already proved her credentials in ODIs. Can he make her name in the shortest format?
Injury News
Squad: Heather Knight (C), Maia Bouchier, Sophia Dunkley, Bess Heath (WK), Amy Jones (WK), Danni Wyatt, Alice Capsey, Charlie Dean, Danielle Gibson, Sarah Glenn, Freya Kemp, Nat Sciver-Brunt, Lauren Bell, Sophie Ecclestone, Linsey Smith
World Cup History: SF, SF, Round 1, Round 1, Round 1, SF, Runners-Up, SF
Last 10 Matches: LWWWWW(NR)LWW
Group Stage Opponents: NZ, Pak, SL, Aus
India Team Characteristics
Average T20I Experience
64 (959 Matches Among 15 Players)
Average Age
27
Total T20I Runs
13,820
Total T20I Wickets
421
# of Left Handed Batters in Top 8
3
# of Bowling Options
12 (3 Right Arm Fast, 1 Left Arm Spin, 1 Leg Spin, 7 Off Spin)
# of Keeping Options
2
Strengths
The opening pair. Mandhana is striking at 122.82 at an average of 45 this year with fifties, while Shafali is averaging 36.16, striking at 132.72, and has 3 fifties, including an 81.
Weaknesses
Potentially unsettled batting order. In the last few matches, India have had a flexible middle order, which can both be a good or bad thing. Finalizing Rodrigues & Deepti Sharma’s batting position will do India a world of good. Deepti’s finish in the Hundred final was one for the ages.
With the Ball:Radha Yadav. This tournament might be one for left arm spinners in the UAE, and Radha Yadav is no exception.
With the Bat:Jemimah Rodrigues. She has already played a T20Is at the age of 24. Strike rate is at the lower end of 114.26, but is averaging 30.5 with 11 fifties, the glue that keeps the batting order together.
World Cup History: Runners-Up, Runners-Up, SF, Round 1, SF, Round 1, Round 1, Round 1
Last 10 Matches: LLLLLLLLLL
Group Stage Opponents: Ind, Aus, SL, Pak
New Zealand Team Characteristics
Average T20I Experience
60 (891 Matches Among 15 Players)
Average Age
27
Total T20I Runs
11,376
Total T20I Wickets
549
# of Left Handed Batters in Top 8
1
# of Bowling Options
13 (8 Right Arm Fast, 3 Off Spin, 1 Left Arm Spin, 1 Leg Spin)
# of Keeping Options
1
Strengths
Suzie Bates. One of the greatest of all-time, Bates has given NZ decent this year: 43, 38, 16, 16, 33, 34, 19. Can she convert and play the match winning innings?
Weaknesses
New Zealand has been in complete disarray recently. Have not qualified for the semi-finals in the last 3 T20 World Cups and have lost all of their last 10 T20Is. The experienced Sophie Devine isn’t standing up consistently with the bat. Apart from the two fifties this year, she has scores of 17,0,9,5,12,4, and 5.
Look Out for
With the Ball:Amelia Kerr. Just watch her googlies. Talent for the ages.
With the Bat:Amelia Kerr. Also has a 232 in her name in ODI cricket. Can do everything.
Squad: Sophie Devine (C), Isabella Gaze (WK), Maddy Green, Georgia Plimmer, Suzie Bates, Brooke Halliday, Amelia Kerr, Eden Carson, Fran Jones, Leigh Kasperek, Jess Kerr, Rosemary Mair, Molly Penfold, Hannah Rowe, Lea Tahuhu
11 (4 Right Arm Fast, 1 Left Arm Fast, 2 Leg Spin, 2 Left Arm Spin, 2 Off Spin)
# of Keeping Options
2
Strengths
The Top 4. In the 3 matches Pakistan has won in their 10 matches, they have chased 87, chased 107 against UAE without loss (Feroza 62*, Ali 37*), and put up 181 against South Africa (Ali 45, Amin 28, Dar 29, Sana 37*).
Weaknesses
Apart from Sadia Iqbal (who has 24 wickets this year), there are no other standout performers: Nida Dar (13), Sana (7), Sandhu (7), Hassan (7), Baig (6).
Look Out for
With the Ball:Nida Dar. The stalwart is no longer the captain, but still the heart of the team. Has scored a few 20s recently, but can she convert it to 40s or 50s?
With the Bat:Sadia Iqbal. Another left arm spinner to look out for. Has taken 42 wickets in the last two years. Her bowling strike rate this year is 14.5, down from 22 and 24 in the previous two years.
World Cup History: Qualified for the first time in 2024
Last 10 Matches: WWLWWWLW(NR)(NR)
Group Stage Opponents: Ban, WI, SA, Eng
Scotland Team Characteristics
Average T20I Experience
33 (494 Matches Among 15 Players)
Average Age
25
Total T20I Runs
5,024
Total T20I Wickets
261
# of Left Handed Batters in Top 8
0
# of Bowling Options
12 (6 Right Arm Fast, 1 Left Arm Fast, 1 Leg Spin, 4 Off Spin)
# of Keeping Options
1
Strengths
Rising confidence led by the in-form captain, Kathryn Bryce. Scotland is coming off a win against Pakistan in the warm-up matches, a win against England, and most importantly, qualifying for the first time. Also, their schedule is in increasing difficulty: Bangladesh, WI, SA, and England. They may be favorites against Bangladesh and if they can surprise West Indies, you just never know.
Weaknesses
Lack of left handers in the batting order and no left-arm spin options..
Look Out for
With the Ball:Abtaha Maqsood, the leg spinner. Has been consistently among the wickets in the last 3 years, taking 9,10, and 9 wickets respectively. Her economy in 2023 was a miserly 4.86.
With the Bat:Saskia Horley. Across formats, Horley has been in tremendous form, scoring 100, 71, and 43 in ODIs, and following it up with a 48 in the T20 warm-up against Pakistan.
World Cup History: Round 1, Round 1, Round 1, SF, Round 1, Round, SF, Runners-Up
Last 10 Matches: WLWL(NR)WLLLL
Group Stage Opponents: WI, Eng, Sco, Ban
South Africa Team Characteristics
Average T20I Experience
52 (772 Matches Among 15 Players)
Average Age
27
Total T20I Runs
8,733
Total T20I Wickets
352
# of Left Handed Batters in Top 8
0
# of Bowling Options
11 (6 Right Arm Fast, 2 Left Arm Spin, 2 Leg Spin, 1 Off Spin)
# of Keeping Options
2
Strengths
South Africa’s batting order is one of the bests in the world. Starting from the captain, Wolvaardt-Brits all the way down to Kapp-Luus-Tryon. Annerie Dickerson who scored 44*(23) in her last outing, might not even start since Kapp is back.
Weaknesses
Lack of left handers in the batting order.Also, how will South Africa cope without Shabnim Ismail?
Look Out for
With the Ball:Marizanne Kapp. As the tournament approaches the latter part, Kapp’s importance increases. Her ability to set the tone with economical spells up front can set the tone for South Africa.
With the Bat:Chloe Tryon. One of the best finishers in the game and a complete all-rounder, watch out for Tryon if matches get close.
The lower middle order. While Gunaratne-Samarawickrama-Athapaththu, and Dilhari make up a strong Top 4, if they were to collapse, Sri Lanka would have a tough time coming back into the game.
Look Out for
With the Ball:Udeshika Prabodhani. With 80 wickets at 22.41 average, it is a pretty impressive accomplishment for a left arm medium.
With the Bat: Cannot look past Chamari Athapaththu. In Asia Cup, she had scores of 119*(69), 49*(35), 63 (48), and 61 (43).
Ash Gardner & Georgia Wareham are both cleared after they suffered concussions due to a clash in warm up drills.
Darcie Brown has recovered from foot stress fracture.
Broken Dreams
Final T20 World Cup for the likes of Ellyse Perry, Alyssa Healy, Nida Dar, Heather Knight, Stefanie Taylor, and Harmanpreet Kaur?
Stalwart Jess Jonassen was left out of the squad even though Healy mentioned there was a small window of hope of her comeback if things change a few days before the World Cup.
Kate Cross and Tammy Beaumont, England legends and mainstays in the ODI squad, have been left out of the T20 World Cup squad. Shabnim Ismail had already retired, marking a few years of transition to come in women’s cricket.
BCD’s 2024 T20 World Cup Predictions
Finally, let’s get to the predictions!
Category
Team/Player
Winner
England
Runners Up
South Africa
Broken Dreams
India, Australia, Another Heartbreak for South Africa?
Most Runs
Laura Wolvaardt
Most Wickets
Sophie (Molineux & Ecclestone)
Player of the Tournament
Sophie Ecclestone
Surprising Factor
Scotland Wins At Least One Match, Sri Lanka Get to #3 in the Group
****
Thank you for reading! Comment below, what are your predictions for this T20 World Cup?
If you like reading about Women’s Cricket, you may also like:
That got me thinking—How expensive is it to watch cricket around the world?
To conduct this analysis, I went through the checkout process and attempted to buy tickets for different types of matches in the first 10 Test playing nations.
If you would like to listen to an engaging conversational AI generated podcast about this article, check this out.
Key Takeaways
England & Australia are the most expensive places to watch cricket (they also have the most opportunities to watch along with India). Ticket prices can range from $185-1400 in a season for England to watch a couple of days of Tests, a few County matches, a few Hundred & Vitality Blast games, and 2-3 limited over internationals.
On the other hand, in Bangladesh, Sri Lanka, and Zimbabwe, a fan can watch matches for as low as $1 USD and can watch several games in a season for about $100 on the higher end.
Watching domestic cricket is completely FREE in India, New Zealand, and South Africa (both List A & 4-day). All you need to do is show up at the stadium (So GO, what are you waiting for?)
Cost of Watching Cricket: Most Expensive Places to Watch Cricket Around the World
We will provide ranges and consider a few different categories (if data is available):
Limited Over Internationals (LOI) – both men’s & women’s
Test Matches
Domestic Competitions
Franchise Leagues
For the sake of the cost comparison, we will be looking at General Admission ticket for Adult guests (in some countries like England, ‘members’ of the club receive discounted prices given that they have paid the annual membership fee). This analysis does not include member prices, bundles, or other discounts (or service/handling fees & taxes).
Note: These are ballpark ranges. Ticket prices may vary based on the match (for example, knockout and Finals matches may be more expensive) and the stadium.
If a spectator in England watched 2 days of a men’s Test, 5 County games, 1 men’s international, 2 Vitality Blast matches, 2 Hundred matches, 1 ODI cup, one women’s international, and 1 Women’s Hundred match in a season, they would spend (on tickets alone) between $260-$504 depending on the stadium and up to $1393.3 if they only chose premium seating.
Monthly Cost of Living: $1929
Average Monthly Net Salary: $3288.55
Annual Inflation Rate: 2.5%
Estimated Monthly Savings: $1359.55
Percent of Savings Spent on Cricket (Live): 4.54%-34.16%
*These economic numbers are for the United Kingdom as a whole, not just England.
Type of Match
General Admission Ticket Price (Adult)
Premium Tickets
A Day of a Test
£38-85 ($50.6-113.1)
£95-145 ($126.6-192.9)
Men’s LOI
£20-40 ($26.6)
£135 ($179.9)
Women’s LOI
£5-10 ($6.7-13.3)
£65 ($86.6)
County
£6-15 ($8.0-20.0)
£23 ($30.6)
Vitality Blast
£15-25 ($20-33.3)
£150 ($199.5)
The Hundred
£11 ($14.7)
£35 ($46.6)
One Day Cup
£5-20 ($6.7-26.6)
£37 ($49.2)
*These are ticket prices for non-members
How Did We Estimate the Ticket Price Range?
The international costs above are estimated from the upcoming England-Zimbabwe Test, India-England Women T20I series, and the men’s South Africa-England series, while the domestic costs are a ballpark number based on perusing several County’s websites.
Note: The prices for domestic price tickets in England vary vastly based on the County/stadium. For example, Kia Oval is at the more expensive side: £15-20 for County Championship matches, £32-40 for Vitality Blast, £40-85 for a men’s T20I, £18-30 for a women’s T20I, and £85-145 for a Test match.
Other Costs: Car Parking (£5+), Guided Tours: (£0-30), Full Season Membership (£240-270), Food, Drinks, Concessions (varies)
Where To Buy Tickets: Tickets can be purchased on the County, stadium, or ECB website. For international matches, you have to enter a ballot and hence, may not be guaranteed a ticket if there is high demand.
If a cricket fan in Australia went to watch 2 days of a men’s Test, 1 ODI, 1 Sheffield Shield match, 2 BBL matches, one women’s international, and 1 WBBL match in a season, they would spend (on tickets alone) at least $180 AUD ($122.6 USD)and as much as $900 $(613 USD) if they chose the premium seating.
Monthly Cost of Living: $1,944
Average Monthly Net Salary: $3,819.73
Annual Inflation Rate: 3.5%
Estimated Monthly Savings: $1875.73
Percent of Savings Spent on Cricket (Live):2.2%-10.89%
Day 4 Tickets: For the Boxing Day Test MCG, the General Admission has a starting price for $30 with reserve stands as high as $85.
Type of Match
General Admission Ticket Price (Adult)
Premium Tickets/Lounge/SkyDeck
A Day of a Test
$30 AUD ($20.4 USD)
$170 AUD ($115.8 USD)
Men’s LOI
$30 ($20.4)
$170 ($115.8)
Women’s LOI
$20 ($13.6)
Domestic Cricket
$10 ($6.8)
Franchise Cricket(BBL)
$27.5 ($18.7)
$165 ($112.4)
WBBL
$10 ($6.8)
*Note: For some Tests (for example, Adelaide BGT, there are ‘Twilight Adult’ prices if the entry is after 5 PM at a discounted price of $22.5).
Watching 2 days of a Test, 2 SuperSmash matches, a men’s limited overs game, and a women’s limited over game can cost anywhere between $109 to $160 in a season.
Monthly Cost of Living: $1782
Average Monthly Net Salary: $3156.96
Annual Inflation Rate: 3.1%
Estimated Monthly Savings: $1,374.96
Percent of Savings Spent on Cricket (Live):1.96%-2.81%
Type of Match
General Admission Ticket Price (Adult)
Premium Tickets
A Day of a Test
$45 NZD ($28 US)
$70 NZD ($43.6)
Men’s LOI
$35 ($21.8)
$65 ($40.5)
Women’s LOI
$20 ($12.5)
Domestic Cricket
FREE
SuperSmash
$15 ($9.4)
*Note: A Test Match Pass (all 5 days) can be purchased, which ranges from $145-220 NZD.
Entry to Plunkett Shield (first class) and Ford Trophy (List A) are free.
Two days of a men’s Test, 1 Men’s ODI, 1 Women’s ODI, and 2 SA20 matches in Bangladesh would cost a spectator somewhere in the range of $44-89 in one season.
Monthly Cost of Living: $974
Average Monthly Net Salary: $1446.04
Annual Inflation Rate: 4.9%
Estimated Monthly Savings: $472.04
Percent of Savings Spent on Cricket (Live):3.1%-6.3%
In India, watching 2 days of a men’s Test, 1 ODI, 2 IPL matches, 1 women’s international, and 1 WPL match in a season, would cost (on tickets alone) between $30-140 on the lower end and about $294 on the higher end over a season. Keep in my end, that or certain IPL teams like RCB, tickets can go as high as $634 alone!
Monthly Cost of Living: $423
Average Monthly Net Salary: $633.49
Annual Inflation Rate: 4.6%
Estimated Monthly Savings: $210.49
Percent of Savings Spent on Cricket (Live): 14.25%+
*This is a bit skewed since population of India has widespread economic disparity. Those who can probably afford to purchase tickets are the only ones that would purchase those premium/VIP tickets.
Type of Match
General Admission Ticket Price (Adult)
Premium/VIP
A Day of a Test
INR 125-200 ($1.5-2.4)
INR 1000-2000 ($12-24)
LOI
INR 750 ($9)
INR 10000 ($119.8)
Women’s International
FREE*
INR 150 ($1.8)
Domestic Cricket
FREE
IPL
INR 700-5000 ($8.4-60)
INR 5000-52938 ($59.9-$634.4)
WPL
INR 100-500 ($1.2-6)
As per Hindustan Times, “Pricing is decided as per demand and supply, affordability, culture, and the eagerness of the people to pay” when it comes to IPL prices. Hence, there is a wide range in IPL tickets depends on which player/teams are playing and when the ticket has been purchased.
Here are some other notes:
Non-international matches are free to attend.
*The entry to women’s Test between India & South Africa was free, while the T20Is were priced for INR 150.
Long story short, watching sports can be a fun and expensive experience.
Final Thoughts
The main thought of writing this article was to answer the question, “Is cricket affordable for the common man?”
With rising cost of living standards around the world and mobile/TV accessibility of cricket, are boards doing enough to incentivize followers to go to the ground?
In general, cricket is not as expensive as other sports. However, if Test cricket is to survive, £95 Day 4 tickets is probably not going to help.
If the trend continues, cricket will become only an elitist game. It began as an elitist game, but do we want to keep it that way?
If you are interested in cricket & finance, consider checking out the following:
 (400 x 100 px) (4)")