375 articles and four and a half years later, we are going back to our roots. Thanks to diplomat and cricket enthusiast—Michael Appleton to get me inspired and thinking on these lines again from this tweet:
To every 🏴 🇦🇺 🇮🇳 fan/journalist/former/current player complaining about the format of the WTC: I have a deal for you!
If you’re prepared to give up the five-match Test series that your three countries play, I can design a WTC in which everyone plays everyone the same amount!
That original article explored how to reduce the imbalance of the Big 3 (India, England, Australia) in WTC scheduling, but still keep the ‘marquee’ series like The Ashes or Border-Gavaskar Trophy. However, it was a bit too unrealistic.
Later, I would research how much money it takes to host a Test match and realized that finances are the root of almost all problems in the world of cricket. In all sense of the phrase—It’s the economy, stupid.
Today, I will try to put all of these ideas together and form a combined thesis towards a World Test Championship (WTC) system that (1) can realistically work in today’s world, (2) is financially viable, (3) includes equidistribution of Tests for every team, (4) implements two Test windows, and (5) come up with a realistic value for a Test match fund.
Part I: Solving the Equal Matches Per Team Problem
One of the major issues in the current iteration of the WTC is the imbalance of the number of Tests each team plays. This is due to the influence of the Big 3 as well as the high cost to host a Test.
Current World Test Championship Table
Here are the number of matches each team will play in the 2023-25 WTC cycle:
22 – England
19 – India, Australia
14 – New Zealand, Pakistan
13 – Sri Lanka, West Indies
12 – South Africa, Bangladesh
We can see that the Big 3 play 5-10 Tests more than each nation. This is mainly due to the ‘marquee’ series like Ashes (Aus-Eng), BGT (Aus-Ind), and Ind-Eng.
How can we keep the drama of the marquee series alive but ensure an equal footing for each team?
Solution: Sweet 17—One Match Sacrifice Required by The Big 3
To resolve this issue, we will introduce the two-tiered relegation promotion system.
Each tier will consist of six teams including Zimbabwe, Ireland, and Afghanistan (I mean, why give out Test status when you’re not going to have Afghanistan and Ireland play on a regular basis). We will show this by example with the current Top 6 rankings in the current WTC table.
Tier 1: India, Australia, England, South Africa, New Zealand, Sri Lanka
Tier 2: Pakistan, West Indies, Bangladesh, Ireland, Zimbabwe, Afghanistan
The Constraints
Once we had this framework, the next question was what is the ideal number of matches each team in Tier 1 can play so that (1) there are no two-Test series, (2) each of the six teams plays each other once, (3) there is an equal amount of home and away matches, (4) India-Australia-England get to keep their ‘marquee’ series, and (5) most importantly, each team plays the same number of games.
I treated this challenge as a Sudoku puzzle. And boy was this a tough challenge! (Photos of my scribbling with my earlier attempts are at the bottom of the article for your kind perusal).
20-matches? Too many. 16 matches? Not enough to satisfy all the constraints.
17? Ahh, there’s the goldilocks zone!
Here is the solution I came up with:
Each team plays two 4-Test series and three 3-Test series, for a total of 17 matches each.
The 17 Tests are going to be divided in 7-home, 7-away, and 3-neutral Tests, where each of the Big 3 get to host one neutral series.
The 7-home and 7-away matches will consist of exactly one 4-Test series and one 3-Test series.
Altogether, Tier 1 will consist of exactly 50 Tests.
Top 2 teams will compete in a 3-Test final series at a neutral venue (taking the total to 53 Tests).
The crux? India-Australia and the Ashes have to sacrifice the 5-Test series. I tried adding a 5-4-3 solution (one 5-match series, one 4-match, and one three match series, but it would require NZ-SL to play 5 Tests or the Ashes to be reduced to 3 Tests).
Two 4-match series worked out just right for everybody.
Tier 1 WTC Schedule Breakdown
IND
AUS
ENG
SA
NZ
SL
IND
X
4
4
3
3
3
AUS
4
X
4
3
3
3
ENG
4
4
X
3
3
3
SA
3
3
3
X
4
4
NZ
3
3
3
4
X
4
SL
3
3
3
4
4
X
Total
17
17
17
17
17
17
Legend
Home, Away
Neutral
Ind vs SL in Australia
Aus vs NZ in England
Eng vs SA in India
You can interpret the above table as follows: India hosts England (4 Tests) & New Zealand (3), play away tours to Australia (4 Tests) & South Africa (3), and finally play a 3-Test neutral series against Sri Lanka.
Tier 2 WTC Schedule Breakdown
Each team plays two 3-Test series and three 2-Test series, for a total of 12 matches each.
For this example, since Pakistan is in this tier, the UAE will be chosen as the neutral venue for all neutral matches.
Tier 2 will consist of exactly 36 Tests.
Top 2 teams will compete in a 3-Test final series at a neutral venue (taking the total to 39 Tests).
PAK
WI
BAN
ZIM
IRE
AFG
PAK
X
3
3
2
2
2
WI
3
X
3
2
2
2
BAN
3
3
X
2
2
2
ZIM
2
2
2
X
3
3
IRE
2
2
2
3
X
3
AFG
2
2
2
3
3
X
Total
12
12
12
12
12
12
Home, Away
Neutral
Pak vs Afg in UAE
WI vs Ire in UAE
Ban vs Zim in UAE
At the end of the WTC cycle, the bottom two teams from Tier 1 will be relegated to Tier 2, while both finalists from Tier 2 will be promoted to Tier 1.
Is it Too Much Test Cricket?
No.
Including the final series for both tiers, there will be a total of 92 Test matches in two years.
The first three iterations of the WTC had 61, 70, and 70 matches respectively. 92 here includes 12 Tests each for Zimbabwe, Afghanistan, Ireland and the two final series, which is pretty balanced overall.
The compromise for equal games for each team is that the Big 3 will play 3-5 Tests less than the usual, while the mid-tier teams will play 3-5 more Tests than usual.
In this model, we are asking South Africa, Sri Lanka, and New Zealand to host one 4-Test series in a two-year cycle, but do they have the money? Probably not (and that is why we are also having the neutral Tests hosted in India, England, Australia, or the UAE—countries that can afford it).
We had estimated last year that it takes a mammoth $350,000-$1.4 million to host a Test match and studied why teams like NZ & SA lose money while hosting a Test.
On the other of the spectrum, a series like Ashes can incur costs anywhere from $3-7 million. The cost depends on various factors such as technology, review system, support personnel, hotels, travel, security, etc. One quick example is Australian broadcasting using an 80-camera system for the BGT 2024-25 series.
Higher quality, but comes with higher costs.
Cost Estimation: So, How Much Money is Needed to Sustain a Fair WTC?
To estimate the cost of hosting the WTC, we will first presume that the Tests hosted by Big 3 as well as the two final series (3 Tests each) will be on the higher end of the hosting costs.
India, England, and Australia will each host 8 Teams (7 home + 1 neutral) for a total of 24 matches. The 6 Tests for the two final series will make it about 30 high-quality expensive Tests and 62 Tests on the lower end.
The 62 Tests will cost anywhere from $21.7 million-$86.8 million, while the 30 Tests will take about $70-210 million. Overall, a 92-Test WTC will cost somewhere between $91.7-296.8 million.
Where Will Get the Money From?
The ICC recently mentioned a possible $15 million Test match fund in the form of $10,000 minimum Test fee as well as a ‘touring fee’. That is a step in the right direction, but more targeted funding is needed.
In our WTC model, we are asking SA, SL, and NZ to host about 4 Tests more than they usually do and Afg, Zim, and Ireland to host 5 Tests each more than they usually do. That is about 27 extra Tests, which totals to $9.45 million-$37.8 million.
The ICC had a total surplus of $912 million as of December 2022 and have an estimated $200-$325 million profits in each of the last couple of years. Subsidizing the World Test Championship (WTC) with about 5-15% of their annual profits could solve the money problem.
If $17.5 million can be used to fund seven cricketers in a tournament that lasts less than 60 days, then surely $17.5 million could be found from somewhere (ICC + IPL + BCCI + sponsors) to fund six countries and Test cricket so it exists for the next 60 years.
The money in cricket exists. Just needs to be redistributed properly so that all interested parties are happy.
Note, from the current rankings, Tier 1 countries would include Australia, South Africa, and New Zealand. All of these 3 countries are located in the southern hemisphere and hence, will host all their home Tests in the November-January window, including the coveted Boxing Day Test.
West Indies, England, and Ireland will host both their home test series between the June-August window.
Meanwhile, subcontinental nations (India, Pakistan, Bangladesh, UAE) can be more flexible and host one home series in each window.
Solution: Two 2-Hemisphere Test Match Windows
Here is how a potential two year cycle could look with the two separate windows without overcrowding the international calendar. We try to schedule Test cricket during peak summer times in each hemisphere to gain the most attention.
Test Match Window 1 Matches (November – January)
Tier 1
India in Australia (4 Tests), South Africa in Australia (3 Tests), India vs Sri Lanka in Australia (3 Tests)
Sri Lanka in South Africa (4 Tests), India in South Africa (3 Tests)
South Africa in New Zealand (4 Tests), England in New Zealand (3 Tests)
England in India (4 Tests), England vs South Africa in India (3 Tests)
Australia in Sri Lanka (3 Tests)
Tier 2
Bangladesh in Pakistan (3 Tests)
Afghanistan in Zimbabwe (3 Tests), Pakistan in Zimbabwe (2 Tests)
West Indies in Bangladesh (3 Tests)
Ireland in Afghanistan* (3 Tests)
West Indies vs Ireland in UAE (2 Tests), Bangladesh vs Zimbabwe in UAE (2 Tests)
Test Match Window 2 Matches (June – August)
Tier 1
Australia in England (4 Tests), Sri Lanka in England (3 Tests), Australia vs New Zealand in England (3 Tests)
New Zealand in India (3 Tests)
New Zealand in Sri Lanka (4 Tests)
Tier 2
Zimbabwe in Ireland (3 Tests), Bangladesh in Ireland (2 Tests)
Pakistan in West Indies (3 Tests), Zimbabwe in West Indies (2 Tests)
Bonus: Will West Indies Never Play India or Australia Again in this Model?
I know what you might be thinking.
If India, Australia, or England never relegate and West Indies never get promoted…are the days of the mighty West Indies versus the Australians and Indians over? 60 years of legacy down the drain?
Not quite. We have an addendum for this scenario as well.
One Optional Friendly Series Between the Two Tiers
If both teams agree (and there is space in the international calendar), an optional 1 to 3-match friendly Test series can be played between a country of the first and second tier. In our example, we may have:
India vs Afghanistan
Australia vs Zimbabwe (This is never going to happen, is it?)
Australia vs Pakistan
England vs Ireland
South Africa vs Zimbabwe
New Zealand vs West Indies
Sri Lanka vs Bangladesh
This can serve as (1) a practice tour (India playing Zimbabwe on way to their South Africa series), (2) a promotional event (India-Pakistan one-off Test in UAE), or (3) an actual friendly series to encourage lower-ranked countries to stay serious about Test cricket.
Final Thoughts
Is it the perfect plan?
No. In fact, there is never such a thing as a ‘perfect plan.’
But we can continue to strive for a more perfect system, can’t we?
At least it is good to see that World Test Championship (WTC) is taking flight. 4 years ago, not many took this as a serious competition or offered solutions. Now there is plenty of debate, which is good to see.
In 2020, I was quixotic with my outlook on cricket. Thought anything was possible.
In 2021, I was hopeless, doubting the system at every stage.
By the time we reached 2024, I became practical. And as we approach 2025, I have become a little more realistic.
Hopefully, this solution is actually realistic for the ICC and others in charge of cricket to consider.
****
Thank you all for reading! Comment below (or on social media about your thoughts and suggestions).
PS: Here is some bonus work on trying to find the ideal number of matches each team should play.
Four years ago I was really excited when the idea of the World Test Championship came out. I mean, it was partially a reason for me to start this blog.
However, with the recent overseas wins of NZ in India, SA in Bangladesh, and Bangladesh in Pakistan—that hope has rekindled.
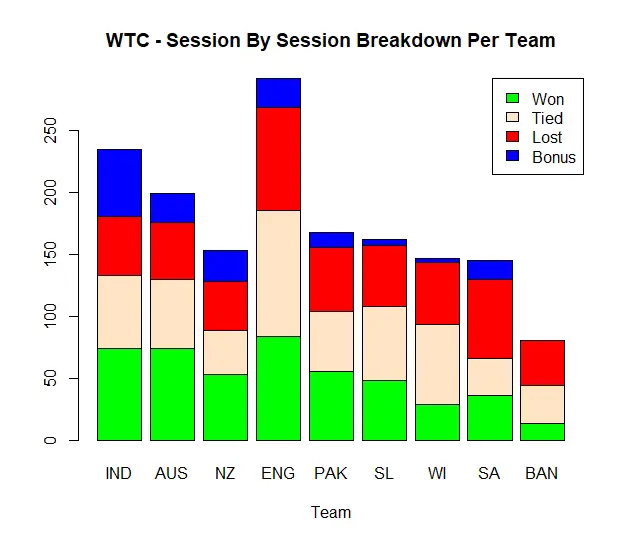
Therefore, this is a good time for us to revisit the WTC alternative points table algorithm my friend and I had created four years ago to create a more balanced system. For this WTC cycle, I analyzed each of the 51 Test matches and 578 completed sessions one-by-one so you don’t have to.
Before we start, he is a quick refresher on how our alternative points table worked.
Our WTC points table algorithm (1) distributes points on a session-by-session basis rather than an all-or-nothing system for a Test match, (2) includes Home/Away points for both wins & draws, and (3) includes a bonus to reward massive victories (Test match net run rate equivalent).
Points are calculated as follows:
2 points per session won, 1 point per session Tied
There are 15 maximum sessions in a Test (3 sessions per day), so 30 points maximum per Test for the session-by-session category
The details of the algorithm used to decide who won each session is outlined in the original article and is left as an exercise to the reader.
Bonus: 2 * (Number of Sessions Remaining)
Example: If the Test finishes at the end of Day 4, the winning team would get 6 bonus points – (2 * (3 sessions remaining))
Home/Away
Away wins and away draws would be awarded more points.
16 – Home Win, 8 – Home Draw
24 – Away Win, 12 – Away Draw
The maximum points a team could earn per Test is outlined below (Example: 24 – away win points + 30 session points = 54 total if the team won all the sessions).
Points
Win
Draw
Loss
Maximum Points Possible (Per Match)
Home
16
8
0
46
Away
24
12
0
54
Average*
20
10
0
50
Home & Away Points
Finally, since each team plays a different number of matches, we will take a percentage determined by (total points earned)/(maximum points possible*).
The maximum points possible will be determined by (number of matches played * 50), where we choose 50 because it is the average between 46 & 54 and would hence, weight away wins & draws more.
I coded this algorithm in R & Python and double checked the calculations by hand for the session-by-session analysis.
🇦🇺 BEAT 🏴 by 2 wickets, Birmingham 🇦🇺 BEAT 🏴 by 43 runs, Lord’s 🇮🇳 BEAT 🌴 by inn & 141 runs, Roseau 🇵🇰 BEAT 🇱🇰 by 4 wickets, Galle 🇵🇰 BEAT 🇱🇰 by inn & 222 runs, SSC 🇳🇿 BEAT 🇧🇩 by 4 wickets, Mirpur 🇮🇳 BEAT 🇿🇦 by 7 wickets, Cape Town 🌴 BEAT 🇦🇺 by 8 runs, Brisbane 🏴 BEAT 🇮🇳… pic.twitter.com/b55YlIHHzZ
— Broken Cricket Dreams Cricket Blog (@cricket_broken) November 10, 2024
Key Takeaways
45% (23/51) WTC matches in this cycle so far have been won by away teams.
England (79) & India (76) won the most sessions so far, while Australia (47) have tied the most sessions. West Indies (24) & Bangladesh (29) have had the least session wins in this cycle of the WTC so far
We have had a spectacular run of dramatic overseas victories. Each team has had at least one overseas win:
South Africa 1-0 in West Indies & 2-0 in Bangladesh
Australia won 2 Tests each in England & New Zealand
Bangladesh won in Pakistan 2-0
Pakistan won 2-0 in Sri Lanka
Sri Lanka won 2-0 in Bangladesh and a Test in England
England won one Test each in India & Pakistan
The India vs South Africa Test at Cape Town was the shortest Test ever, lasting only 5 sessions.
South Africa won all 9 out of 9 sessions in the recent 2nd Test vs Bangladesh and received the maximum possible 54 points for the Test in our points system.
WTC 2023-2025 Alternative Points Table – Results
Here is our alternative WTC 2023-25 points table at a glance.
Team
Total Points
AverageMax Points Possible*
BCD Percentage
Actual WTC Percentage
Australia
379
600
63.17%
62.50%
India
410
700
58.60%
58.33%
South Africa
233
400
58.25%
54.17%
Sri Lanka
239
450
53.11%
55.56%
New Zealand
277
550
50.36%
54.55%
England
411
950
43.26%
40.79%
Pakistan
206
500
41.2%
33.33%
Bangladesh
162
500
32.4%
27.50%
West Indies
122
450
27.11%
18.52%
*Note: We have added the same over-rate deductions as the current WTC table does (19 for England, 10 – Australia, 8 – Pakistan, 3 – Bangladesh 2 – India)
Observations
Our points table heavily rewards South Africa, who have dominated 3 overseas Tests (1 vs WI, 2 vs Bangladesh).
Sri Lanka are close by with 3 overseas Tests wins as well (2 vs Bangladesh, 1 vs England) but they lost points to Pakistan at home. Similarly, NZ had a good show vs Bangladesh & India away, but lost convincingly 0-2 against Australia (home) & Sri Lanka (away)
The interesting point our points table highlights is showcasing how close a Test match or Test series was. For example, the 2-2 Ashes translates into 132-118 in favor of Australia (due to overseas wins and draw).
In addition, no two Test series are alike.
The Pakistan-Bangladesh 2-Test series (where Pakistan batted well initially and even declared) resulted in 84-24 points in favor of Bangladesh. This series was closer than the SA-Ban series (101-7 in favor of SA), where SA completely decimated Bangladesh.
Appendix: WTC 2023-25 Match By Match Break Down
If you want to look at the particular series or team, here is a table of content organized by home team for easier access:
We bring to you the list of best Test matches over the past four years. Thrilling finishes galore! Who said Test matches are boring?
by Nitesh Mathur, 08/27/2021
West Indies’ 1-wicket victory against Pakistan and India’s comeback at Lord’s have added another couple of great matches in our memory banks. We have seen some exhilarating Test cricket in the past couple of years.
If there was ever any doubt on the quality of Test cricket, here are 18 matches that have revived Test cricket in the past 4 years.
Match Summary: Pakistan: 376 & 174/8 declared; West Indies: 247 & 202
Player of the Match: Roston Chase
The Tension
After 95 overs of resistance, with only 7 balls to go for a valiant draw, Shannon Gabriel heaves Yasir Shah and gets bowled. Roston Chase stranded on 101* (239) after batting for an epic 366 minutes. Strategic stroke or brain fade from Gabriel?
Pakistan’s first ever series win on West Indian soil as they claim the the series 2-1. Misbah-ul-Haq & Younis Khan retire in style in this famous “Mis-You” series.
In their first innings, Australia had collapsed from 161-1 to 202-10. In the second innings, they had 462 runs to chase or 140 overs to bat. And 140 overs they batted. The man of the hour was Usman Khawaja – 85 (175) & 141 (302), batting for a total of 766 minutes (around 13 hours) to give Australia one of their most savored draws.
Commentary/Winning Moment
“It was assumed that Australia would lose that Test match. What Australia was looking for…was a test of character” – Amazon Prime The Test
Significance
This was Australia’s first true moral victory since Steve Smith & David Warner were banned. Usman Khawaja had never truly solidified his place in the Australian XI, but this innings ensured his career would always be remembered due to this legendary knock.
Match Summary:New Zealand: 153 & 249; Pakistan: 227 & 171
Player of the Match: Ajaz Patel
The Tension
In a chase of 176, Pakistan collapsed in the most Pakistan fashion from 147/4 to 171/10. With a mandatory run-out of course. NZ somehow won by 4 runs. Ajaz Patel with a 5-fer on Test debut.
Commentary/Winning Moment
“And what a victory for the New Zealanders. They deserve it. WOOW! …It’s an unbelievable victory for New Zealand. You can see how much it means to them.” Commentary Video
Match Summary: South Africa: 235 & 259; Sri Lanka: 191 & 304/9
Player of the Match: Kusal Perera
The Tension
In a mammoth chase of 304, Sri Lanka were struggling at 110/5. What followed was a knock for the ages. Kusal Perera hit a miraculous 153* (200) with 12 sixes & 5 fours. The last wicket partnership between Perera & Vishwa Fernando was 78*, with only 6* (27) coming from Fernando’s bat.
Commentary/Winning Moment
“He’s done it! He absolutely does it. One of the greatest see from a Sri Lankan outside Sri Lanka…What a historical day at Durban.” Watch the winning moment here, a contender for the greatest Test match innings of all time.
Significance
Sri Lanka go on to win the series 2-0. First time anAsian team won a Test series in South Africa.
Match Summary: Australia: 179 & 246; England: 67 & 362/9
Player of the Match: Ben Stokes
The Tension
Despite being a wonderful series to watch all around, the thunder was stolen by Ben Stokes’ 135*, Jack Leach’s glasses, Nathan Lyon’s run out opportunity, and Tim Paine’s missed DRS review. A 76* (62) partnership for the final wicket. Oohs & Aahs. Reverse sweeps, scoops, and hoicks. Just a great day to be a cricket fan. One of the greatest innings of all time.
Commentary/Winning Moment
“Cut away. Cut away for 4. What an innings. What a player. Take a bow Ben Stokes. The Ashes well and truly alive because of one cricketer & that cricketer is Benjamin Stokes.” (Nasser Hussain) Entire Day 5 minute highlights
Significance
This series had so many moments. Stuart Broad 23 wickets & dismissed Warner 7 times. Steve Smith’s legendary masterclass was breathtaking. 774 runs, 3 tons, 3 fifties, best of 211, 110.57 average. Jofra Archer’s Test debut, Smith’s concussion, and Marnus Labuschagne’s entrance as cricket’s first concussion substitute—353 runs, 4 fifties at 51.00. Not a bad start, I say. Ideal beginning for the World Test Championship, a 2-2 Ashes series.
Match Summary: England: 204 & 313; Sri Lanka: 318 & 200/6
Player of the Match: Shannon Gabriel
The Tension
It was a Test match that went all the way to session 3 of Day 5, which became a common theme for Test matches post the COVID break. After Shannon Gabriel’s 9-fer & #1 all-round Jason Holder had given West Indies the advantage, they characteristically lost it on the final day. The Windies had collapsed for 27/3 in a chase of 200. Then an inspirational 95 by Jermaine Blackwood 2.0 brought WI back with the supporting cast of a hobbling John Campbell & the engine room—Roston Chase, Shane Dowrich, and Jason Holder.
Commentary/Winning Moment (None other than than Ian Bishop)
“Victory for the West Indies. A most significant moment for Jason Holder and his team. Great credit to their skill, their commitment. The West Indian people and world credit owes them a great debt…” Commentary Video
Significance
The coronavirus had hit and ravaged the world. Worldwide lockdown was in-effect and sports had closed its doors for months. Thanks to the West Indies & England cricket boards, players, the support staff, & essential works, cricket made a comeback via bio-bubbles.
Match Summary: New Zealand: 431 & 180/5 declared; Pakistan: 318 & 200/6
Player of the Match: Kane Williamson
The Tension
With a chase of 373 at hand in tough New Zealand conditions, Pakistan were 4/2 at tea on Day 4.One of those one-sided home victories for New Zealand again? Not this time. Not with Fawad Alam. With support from the ever dependable trio Azhar Ali, Mohammad Rizwan, and Faheed Ashraf, Alam scored 102over 6 and a half hours. Yet a Pakistan-esque collapsed followed after surviving 123.3 overs. Pakistan lost with only 4.4 overs to go. What a jumping catch by Santner as well for the last wicke.t. The drama.
Commentary/Winning Moment
“[Catch it] Oh he’s done it. He’s pulled a hander! Mitchell Santner has done it! Mitchell Santner has finished the game for New Zealand. Look at the scenes!” Commentary Video
Significance
Last match of the decade. Turning point for Test cricket. Brilliant rearguard effort despite the loss. And Fawad Alam. What a story. Dropped after 3 Tests despite scoring a 168 on debut. Criticized for scoring hard, ugly runs with a weird stance. Left out for a decade. . Grinded in domestic cricket. Runs after runs. Till he could be ignored no more. Has now scored 4 hundreds since his comeback. Patience is, indeed, the key to success.
India had won the 2018 series 2-1 on the back of Pujara’s toil – 521 (1258). Could they repeat the magic in 2021 with Warner & Smith?
It began with the 36 All-Out at Adelaide. Spectacular bowling performance from Australia. Then Rahane’s century & calm captaincy rejuvenated India at Melbourne. Show of resilience and immense mental strength followed from Vihari-Ashwin after the Pujara-Pant show to secure a draw in Sydney. Finally the young brigade breached the Gabba Fortress. Shubman Gill, Shardul Thakur, Washington Sundar, Mohammad Siraj, and Rishabh Pant the stars.
Commentary/Winning Moment
“Pujara, to a younger generation is just a curiosity. As the game moves more and more towards T20, which is the modern savior of our game, the word resilience starts to go out because there is no time for resilience. ” – Harsha Bhogle on Pujara in Amazon Prime’s The Test
Significance
The 2018 victory was the first instance an Asian team has won a Test series in Australia. The 2021 series? Arguably the best Test series since Ashes 2005—This series had everything—bowling excellence, centuries, youngsters, experience, banter, sledging, draws, collapses, and chases. Even with a so-called injured ‘third string,’ squad, whenever India were down, they came back with new hope & stars.
Match Summary: Sri Lanka: 135 & 359; England: 421 & 76/3
Player of the Match: Joe Root
The Tension
The Joe Root Vs Lasith Embuldeniya series. On paper, does not look too close, but the 1st Test was actually engrossing to watch. In chase of 74, England were 14/3 with Joe Root run out (the only way he can get out these days). Jonny Bairstow & Dan Lawrence took England home but the tension was high. 4 innings, 446 runs for Root, 15 wickets for Embuldeniya. Individual brilliance.
Commentary/Winning Moment
“Massive, massive. This is massive. England in a spot of bother.” (After Root’s dismissal) Commentary Video
Significance
Start of Root’s magical year; English fan stranded in Galle cheers from the fort; England won the series 2-0 to extend their overseas winning streak to 5 after they had won 3-1 in South Africa earlier. They would win another in Chennai before Axar Patel decimated England’s subcontinental dreams. (England had also won the 2018 tour of Sri Lanka 3-0 in this same timeframe).
Match Summary: Bangladesh: 430 & 223/8 declared; West Indies: 259 & 395/7
Player of the Match: Kyle Mayers
The Tension
Imagine that you are not sending your 1st XI to Bangladesh, a spin-heavy nation that has had an impeccable record in the past 5 years. No expectations before hand.Bangladesh would have been happy with their effort with centuries from Mehidy Hasan Miraz & Mominul Haque. They even declared in the second innings.
A successful chase of 395 runs followed in 127.3 overs with twodebutants, Kyle Mayers (40 & 210*) & Nkrumah Bonner (86)sealing it for the West Indies with a remarkable partnership of 216 runs. Fourth innings match-winning double century on debut in the subcontinent. Wow.
Commentary/Winning Moment (Ian Bishop Again)
“A win to warm the hearts of every West Indian wherever you are in the world! New heroes have emerged from the ashes..” Commentary Video
Significance
West Indies won the series 2-0 in Bangladesh with a depleted squad. The greatest chase of all-time?
Match Summary: India: 217 & 170; New Zealand: 249 & 140/2
Player of the Match: Kyle Jamieson
The Tension
Under difficult batting conditions and rain all around, both teams fought it out till the very end. The WTC Final was expected to be a boring draw two rains and bad light. Instead, it became a thriller that went deep into Day 6, final session. With a chase of 139, Latham-Conway had departed to spin trial by R Ashwin. Reversed DRS decision, maidens, and a dropped catch later. At 44/2, anything could have happened the way Ashwin was bowling. When the time came, the experienced duo Kane Williamson & Ross Taylor came together, soaked in the pressure, and after took New Zealand home safely.
First major victory for Kiwis in an ICC event. BJ Watling retires on a high, Taylor-Williamson finish, Jamieson shines, 6th Day finish, rain—what else do you need?
Memorable Moment: Kemar Roach & understudy Jayden Seales seal a 1-wicket victory in a tense finish; Both teams with a chance of victory at the end of the fourth session
Match Summary: Pakistan: 217 & 203; West Indies: 253 & 168/9
Player of the Match: Jayden Seales
The Tension
168 target. West Indies collapse to 16/3. After a classic 55 by Jermaine Blackwood, West Indies slip to 114/7. Pakistan needed 3 wickets. West Indies 54 runs. Then Kemar Roach came to the party and had to the take the responsibility of ‘batting with the tail.‘. Roach’s 30* and a valiant 17-run partnership between the mentor-protege pair, Roach-Jayden Seales guided West Indies to a memorable 1-wicket victory.
Match Summary: India: 217 & 203; England: 253 & 168/9
Player of the Match: KL Rahul
The Tension
Day 5, All Results possible. England Favorites. India, not known for their tailender run-machines, unleash Mohammad Shami (56*) & Jasprit Bumrah (34*). 89* partnership as India declared with 2 sessions to go. Then, the pacers fire in unison as India wreck England for 120.
Commentary/Winning Moment
“Unbelievable performance from India. They were up against it. England were favorites coming into Day 5. Kohli an his men have turned it all around.” Commentary Video
Significance
Victory at Lord’s. Another display of fighting it out and not giving up for Team India. Australia tour was not a fluke. This Indian team is on the rise.
Match Summary:India 345 & 234/7 declared; New Zealand 296 & 165/9
Player of the Match: Shreyas Iyer
The Tension
By Tea on Day 5, the main batters for New Zealand—Latham, Williamson, and Taylor had all departed. Somerville’s 36 (125) delayed what seemed inevitable for India. Little did India know that they would run into Test debutant Rachin (Rahul + Sachin) Ravindra—18* (91) & Ajaz Patel 2* (29) to hold out for a memorable draw.Add bad light to the drama as well.
Commentary/Winning Moment
“For a long period of time, New Zealand have struggled to find wins or draws in this country. There is a lot of respect between these two sides. Lot of respect between the skippers.” Commentary Video
Match Summary:New Zealand 328 & 169; Bangladesh 458 & 42/2
Player of the Match: Ebadot Hossain
The Tension
After Bangladesh took lead in the first innings, but Will Young-Ross Taylor had taken NZ to 136/2. In the next hour, 136/3, 136/4, 136/5, 154/6, 160/7, 160/8, 161/9, 169/10. The hour that changed it all feat Ebadot Hossain.
Commentary/Winning Moment
“There it is! Finds the gap and Bangladesh have finally conquered the World Test Champions. And have their first ever Test victory over New Zealand, home or away. It has taken 16 attempts against New Zealand but historic ground has now been broken.” Commentary Video
Significance
The greatest comeback of all time? World Test Champions, undefeated at home for a few years, against a team not known for winning overseas. The best part of all? Bangladesh dominated the entire Test and new heroes emerging—Mahmudul Hasan Joy, Mominul Haque, Najmul Hossain Shanto, Liton Das, Mehdiy Hasan Miraz, Ebadot Hossain. No Shakib Al Hasan, Tamim Iqbal, & Mahmudullah, and Mushfiqur Rahim only scoring 12 & 5.
Match Summary:Australia 416/8 declared & 265/6 declared; England 294 & 270/9
Player of the Match: Usman Khawaja
The Tension
England 3-0 down in the Ashes series. Very likely the series could have become 5-0. First innings, Australia scored 400+, courtesy Khawaja’s comeback century. England came out with a positive attitude, with Jonny Bairstow recording England’s first ton of the series. Khawaja followed with another ton, which set the Test beautifully for Day 5, fifth session. Last batter to go, Labuschagne and Steve Smith bowling leggies in tandem. Against Stuart Broad & jimmy Anderson. Mouthwatering stuff.
“Last ball…He’s done it! He’s survived it. England have survived it. They’ve batted out the day. They’ve batted a hundred and two overs.
Significance
Last shining moment for the Broad-Anderson duo? In terms of Test cricket, this week (starting on January 43rd, 2022) was the peak. NZ vs Bangladesh, Ashes 4th Test, and Ind vs SA 2nd Test, all classic thrillers.
Match Summary:India 202 & 266;South Africa 229 & 243/3
Player of the Match: Dean Elgar
The Tension
India had won the first Test of the series comfortably. This was India’s best chances to conquer South Africa. Successful overseas victories in Australia and England, an unparalleled depth, and a South Africa team at their lowest point. In a low scoring series, 202 & 266 were decent scores. Day 4, 240 monumental target for SA against a bowling line up of Bumrah-Shami-Thakur-Siraj-Ashwin, and what happens? Elgar takes body blows, does not hesitate, and makes a glorious 96*. No captain Kohli. India succumbs to defeat by 7 wickets.
Commentary/Winning Moment
“That’s it! History has been made at the Wanderers. and South Africa have fought back brilliantly! Take a bow, Dean Elgar….Fantastic effort, leading from the front. He’s worn a few on the body but hasn’t bothered him. Shown character and desire, grit & determination to get his team over the line. And set up the series beautifully.” Commentary Video
Significance
A win against India at Wanderers at last. First 200+ chase for SA in a decade. After losing the first Test of a series, this was truly a comeback of the ages. India missed their golden chance due to some tough cricket from the Proteas. Third Test, captain Kohli came back. Rishabh Pant scored 100*, but Keegan Petersen’s 72 & 82 meant that SA chased 212/3 yet again.
Match Summary:Australia 337/9 declared & 216/7 declared; England 297 & 245/9 declared
Player of the Match: Heather Knight
The Tension
Heather Knight’s Test, but Australia had the upper hand. After they declared for 216/7 in the 2nd innings, England took on the challenge for the chase of 257. At 218/3 with Nat Sciver & Sophia Dunkley, it seemed that England might win this. But Alana King, Beth Mooney’s catch, Sutherland’s bouncers, and a run out ensured England’s collapse. Last ball, full toss, England 245/9. The narrowest of draws.
Commentary/Winning Moment
“And it’s a full toss. It is a drawww! And it is one of the very best Test matches we have seen in women’s Ashes.
Significance
In Women’s Test cricket, this was a friendly reminder that Test cricket can flourish if given the chance and plenty of opportunities, both at the domestic and international level. With focus on the 4-day vs 5-day debate, this Test came at hte right time.
Why Are We Seeing Close Test Matches So Frequently?
For an away team to win a Test match, it takes an immense amount of effort and equal amount of fightback from the home team. Hence, winning an away Test usually means going deep into the 4th of 5th Day, which makes for an interesting viewing. On the other hand, home team in friendly bowling conditions mean Test matches can end within 3-4 days (even 2 days).
More away victories or draws means more close Test matches.
Dismal 2010s
What do you remember about Test cricket in the 2010s? Mitchell Johnson 2013, the advent of the Day-Night Test, Smith-Warner saga, South Africa’s blockathon in Delhi, and excellence from the South African team, Dale Steyn, Anderson-Broad, Boult-Southee, Starc-Hazlewood-Lyon-Cummins, Jadeja-Ashwin, Virat Kohli, Joe Root, Steve Smith, and Kane Williamson.
Above all, though, I remember disproportionate margins by which home teams won. India losing in England 0-4 (with RP Singh flying from Miami due to excessive injury list) & Australia 0-4 (2011). India came back to England with 1-3 (2014), and 1-4 (2018). Their record in South Africa and New Zealand, remains disastrous till today. England and Australia were either swept apart or struggled to make a mark in India or Bangladesh. Meanwhile, Pakistan had made UAE their fortress under Misbah-ul-Haq.
Post the 2010-12 England generation (think Alastair Cook Ashes 2010 & England victory 2-1 in India), except for South Africa, no other team seemed competitive overseas. Only Faf du Plessis’ Adelaide debut & England’s defiance via Matt Prior against New Zealand (2013) stretched to the end of Day 5.
From the list above, we can see that the tide is finally turning. Even in England’s disaster tour of India earlier this year (1-3), they won the first Test in Chennai.
Rise of Away Wins, Sporting Declarations, and Pakistan/West Indies
So why have we seen a resurgence of overseas victory?
It can be attributed to 4 factors – (1) Increase depth in cricket teams in general, (2) sporting declarations (#1, #2, #5, #8, #13, #15, #17), (3) captains like Virat Kohli focusing their resources and energy on Test cricket, (4) the rise of the West Indies/Pakistan.
One might argue that West Indies still have a dismal Test record. However, we can see that they made it in this list 3 times. They have definitely become a competitive force under Jason Holder although consistency is now needed. ‘Second tier Test’ teams like West Indies, Pakistan, Bangladesh, South Africa and Sri Lanka punching above their weights and winning overseas matches adds to the excitement (A Relegation-Promotion System in the World Test Championship might help out).
Anyway, here is to more great Test matches. Yes, live audience in Test cricket is decreasing and overkill of cricket/new formats might threaten Test Cricket, but as long as the cricket is good, Test matches will remain alive.
World Test Championship Final Review – Welcome to my 150th article! New Zealand lift the World Test Championship trophy via Jamieson, Conway, Williamson-Taylor show.
After two long, pandemic induced years, the inaugural World Test Championship has finally come to an end. The Kiwis are the world champions, and they thoroughly deserved it.
Traditional English rain, Dinesh Karthik’s meteorology/commentating debut, gritty Test match batting, tall and lanky fast bowlers, de Grandhomme’s hair, a reserve sixth day coming into play, BJ Watling’s retirement, a bit of Ashwin—we saw it all.
The run-rate might have been slow, but the tussle between the top two Test teams was intense. Bowlers bowling consistently in the channel & fighting it out. Great exhibition of Test cricket, ebb and flow throughout.
Here is the World Test Championship Final Review—Match summary, review of India and New Zealand’s key performers, a THANK YOU to our audience, WTC Prediction Results, 3-match Final Debate, Stats, and WTC XI!
Before we dive into “What Went Wrong For India” or “How did NZ Win,” let us discuss what made this Test match riveting. Amidst the rain when nobody expected a result, the fast bowlers from both team delivered.
Commentators had analyzed why Shami had been ‘unlucky’ in the last tour of England. Bowled beautifully but without any returns. Not anymore. In one of his later spells in the first innings, he changed the game. The BJ Watling bowled was the ball of the match. Ishant Sharma was at his consistent best. The way he bowled maidens after maidens to Devon Conway, which prompted an uncharacteristic loose shot, was brilliant. Even though Bumrah was not at his best, his final day spell almost brought India back if not for the Pujara drop.
R Ashwin will definitely go down as an all-time best. He has rediscovered himself of late, ending up as the highest wicket-taker in the WTC. Performed across all conditions, saved a Test match in Sydney, scored a century anplug 9 wickets in his home, Chennai, and kept India in the game in the 4th innings (10-5-17-2).
New Zealand – An All-Time Attack
What are the best all-time attacks? Think West Indies’ 1980s generation, Australia’s 2000s attack, Steyn-Morkel-Rabada-Philander for that one series, Anderson-Broad, and India now getting there.
Southee-Boult-Wagner-Jamiesonsurely rank among the top. Southee’s ball to dismiss Rohit Sharma was an epic change-up in his 4-fer. Boult chipped in with Pujara, Jadeja, Rahane, & Pant’s wickets. Wagner’s intensity was breathtaking and his setup of Rahane & Jadeja was magnificent. Jamieson took the wickets but his economy rate is what suffocated India. An economy of 1.40 after 22 overs in the 1st innings and 1.25 after 25 overs in the second took the steam out of the Indian batting. Add Colin de Grandhomme in these conditions, there was no respite on offer.
India
1. Rohit Sharma As an Overseas Test Opener: Great or Just OK?
Rohit Sharma was criticized for his Southee leave in the 2nd innings that had him LBW, just a few overs before close on the penultimate day.
Sharma has come into his own as a Test opener in the last couple of years. With 2679 runs in 39 Tests with 7-100s, 12-50s, and a best of 212, this looks like pretty decent career after a bumpy start.
The criticism comes from the lack of hundreds in recent overseas Tests.
Overall Record (last year): 44.83 average, 161 Vs England
Overseas Innings (last year): 26 (77) & 52 (98), 44 (74) & 7 (21), and 34 (68) & 30 (81) in the WTC Final
I think he did his job pretty well. Think Aakash Chopra 2003 or Joe Denly 2019rather than Sehwag-esque performance. Rohit tired the bowlers and took the shine off the new ball but has not been hitting those daddy hundreds fans at home have become accustomed to. Just the batters after him did not follow suit and NZ have four world-class bowlers to rotate through.
Shubman Gill has always looked calm, composed, and classy on the crease in his little career, but only 3 fifties in 15 innings with the best of 91 shows that Indian openers have a conversion problem.
2. The Pujara-Rahane Conundrum
Pujara
What can India do about Pujara & Rahane? Pujara’s 8 (54) & 15 (80) in the final does not inspire much confidence. His last three centuries came on that 2018 Australia tour. In this WTC cycle, he has hit nine fifties, played those against the pressure innings, taken some blows, and became a perfect foil to Pant in the Border-Gavaskar Trophy, but nothing in between.
Rahane
Rahane top-scored for India in the first-innings with a good-looking 49 (117) & briefly revived India with 15 (40). The concerning matter is his dismissals. First innings, Wagner had employed his troops into position. Short ball barrage was about to begin. First ball, Rahane top edges but safe. India 182-5. Next, another short ball, a lose pull, straight to the fielder. Rahane trapped. India collapse. 217-all out.
Second innings – same story. From 72-4 to 109. Good looking shots. Mini-revival after Pujara-Kohli were dismissed and Pant was dropped by Southee. Then out of the blue, he gets caught behind on the leg-side by Trent Boult. Just manages to get out in different ways.
Apart from his glorious overseas hundreds (& 96) or the twin tons in Delhi, there is not much to show. With KL Rahul, Hanuma Vihari, Abhimanyu Easwaran, and Mayank Agarwal in line, questions will be asked of the vice-captain.
Meanwhile Kohli’s hunt for his elusive 71st ton continues. His 44 was actually a good innings, but he did not convert either. When none of your middle order goes big, you are not going to win a Test, especially a final.
India 5/182 to 10/217 & 5/142 to 10/170. Ten wickets combined within 63 runs. New Zealand 5-162 to 10-249. 87 runs via Jamieson, Southee, & Boult.
That was the difference.
India has become a world-beater team with fast bowlers galore & growing depth over the past couple of years, but they have yet to counter the Sam Currans or Kyle Jamiesons.
New Zealand
1. Conway & Jamieson: Cricket Is A Piece of Cake
International cricket is a piece of cake for Devon Conway & Kyle Jamieson, isn’t it?
Conway
In the context of tough low-scoring match, a 70-run opening partnership between Latham and Conway was crucial. Conway’s 54 (153) was the highest score of New Zealand’s first innings. His mode of dismissal would concern him, but otherwise, pretty good start this.
3 Tests, 379 runs, 63.16 average, 1-100, 2-50s, best of 200 (at Lord’s debut)
3 ODIs, 225 runs, 75.00 average, 1-100, 1-50, best of 126
14 T20Is, 473 runs, 59.12 average, 4-50s, best of 99*
Jamieson
What about Jamieson, the man of the hour? He was literally head and shoulders above everyone. Rohit, Kohli, Pant among his first-inning wickets, 30-run 7th wicket partnership with a 21 (16), and finally breaking the game with Pujara-Kohli wickets on the final morning.
2. When The Time Comes, Kane Williamson & Ross Taylor Deliver
Kane Williamson & Ross Taylor are the two senior pros of the New Zealand batting lineup. Taylor has been there for 15 years, through unfortunate run-outs, tied finals, DRS decisions, captaincy controversies. In ICC knockouts, both have scored a few 30s and 40s, but never a match-changing innings.
Cometh the hour, cometh the men.
Williamson’s scratchy 49 (177) exuded his class. Despite not timing the ball and struggling, he stayed in the game and stitched the partnerships that got New Zealand to a respectable total.
In the fourth innings chase, the Kiwis were struggling at 44/2 in 20 overs. R Ashwin at the other end operating with his guile. Anything could have happened. The senior statesmen soaked in the pressure, with dot balls and maiden overs building.
After surviving the rough patch, they rotated the strike. A few overs later, the singles & doubles turned into boundaries. Couple of dropped catches signaled the end. Finally, the moment came with Ross Taylor hitting the winning runs. A fairytale script. What’s more? An iconic picture of brothers-in-arm to cap it off.
3. Catches Win Matches Feat Tom Latham & Henry Nicholls
In the preview, we said to watch out for Tom Latham & Henry Nicholls, the New Zealand of the New Zealand team. Nobody ever talks about them, but they have been consistent performers in the last couple of years. With the bat, except for Latham’s 30, there was not much of note.
It is the fielding where these two came alive. Latham’s three catches and fielding efforts almost saved 35+ runs. Nicholls’ running backwards-diving catch off Pant was the moment of the match for me. India’s hopes ended with that catch.
And what about BJ Watling? Perfection behind the stumps in the first innings (no byes given) and kept wickets through injury in the second. The runs might not have come, but New Zealand’s greatest ever keeper retires on a high.
Little contributions, but in a close low-scoring affair, these moments makes the difference.
The Moment
Ecstasy. Team spirit. Absolute Joy.
Here are some of my takes from the final moment:
Tribute to the Legendary Commentating Crew
From a fan’s point of view, the commentating and analysis put this final on another level. The Sky Sports crew has always been amazing with Nasser Hussain & Michael Atherton, but Ian Bishop, Sunil Gavaskar, Kumar Sangakkara, Isa Guha, Simon Doull, and debutant Dinesh Karthik took it to another level.
Analyzing batting techniques, debating who won each session, and playful sledging at its very best. Mohammad Shami’s “chances created vs wickets” analysis was especially intriguing.
Here is a look from DK, the weatherman, on the first couple of days updating social media with regular Twitter & Instagram updates.
Before I move to the Prediction Results section of the article, a brief thank you to our viewers. We have reached our daddy hundred—the 150 is up!
I wanted to take a moment and thank all of you for the support. The Broken Cricket Dream blog began exactly 11 months ago, when the 1st Test between West Indies & England ended. What a chase that was.
The Broken Dreams
That game reminded me of the love of the sport, what I had been missing in the months right after the coronavirus hit. So the journey began, word by word, paragraph by paragraph, blog post by post. The goal of this platform was to share our own dreams, hopes, and love of the game with each other. We all have dreamt of being a cricketer at some point in time but life does not go to plan. That is okay though, things happen for the better. Here is a list of Broken Dreams by our fellow cricket lovers. For me, writing about cricket itself is a dream come true.
None of this would have been possible without our fans and followers. I thoroughly enjoy the discussions and little debates. Keep them coming. Love the interaction!
Anyway, 150 articles and 158,000 words later, Broken Cricket Dreams is still going strong and will continue to grow. We have now spread to several social media platforms. Feel free to check them out below. COMMENT BELOW of your thoughts on the WTC Final, your Broken Dreams, or any feedback!
If you want some encouragement and life lessons from cricket, check these out:
Like this content on this World Test Championship Final Review so far? SUBSCRIBE HERE to receive updates about new articles right in your inbox! If you are on social media, give us a follow in any of the social media outlets below:
World Test Championship Final Review – Prediction Results
The Comments
Andrew Williamson: “Just hoping the winner isn’t going to be Noah and his Ark. If there is enough play, I think New Zealand have the attack to trouble India, on what should be a track with a fair bit in it for the quicks. Kane or Taylor will have to go for NZ to succeed.”
Halsey Nim: “May need a sporting declaration somewhere along the way.”
Jonny: “Pujara vital for India (assume they bat first as NZ best chance is to put them in), Ashwin with important late runs, Boult to shine. Latham grinds out runs, Kane obs, BJ won’t want to fail. Indian wickets spread evenly. Kohli 100 2nd innings. NZ fall just short…”
The criteria is the player has to be the best at that position. Kane Williamson & Labuschagne both were excellent #3s, but I had to pick Labuschagne at the expense of the WTC winning captain. Labuschagne was the best batter in the WTC – most runs (1675), most hundreds (5), and fifties (9).
Jamieson & Labuschagne were the finds of this WTC cycle, so they walk in the XI.
Rohit Sharma just edges out Dean Elgar for the opening spot. I was tempted to go with Elgar since South Africa is a tougher place for openers, but with Karunaratne already at the top, I went with a left-right, defensive-aggressive combination. Both Root & Smith were excellent, but Smith’s iconic 774 runs in the Ashes puts him at the coveted #4 position.
Middle Order
The #5-7 spots were interesting. Ben Stokes’ Headingly show, relentless bowling spells, and 4 tons/6 fifties gives him the all-rounder spot. I initially had Rahane, the fifth highest scorer in the WTC and highest for India but instead, went with both Rishabh Pant and Mohammad Rizwan. Pant has mastered a couple of iconic chases, and Rizwan has been a revelation in the last year with his overseas rearguard innings. Quinton de Kock was also close behind in the keepers race.
Bowlers
Finally, the bowlers were the toughest to pick. My XI coincidentally had good batters as well. Mohammad Shami (40 wickets at 20.47), Josh Hazlewood (47 @ 20.54), Neil Wagner (35 @ 22.97), Jimmy Anderson (39 @ 19.51), Tim Southee (56 @ 20.82), Ishant Sharma (39 @ 17.75) had better averages, Anrich Nortje & Kemar Roach were brilliant throughout. I have not even talked about Trent Boult, Kagiso Rabada, Mitchell Starc, Nathan Lyon, and Shaheen Shah Afridi—all wonderful bowlers who had a decent couple of years without lighting the world on fire.
What an era to live in.
World Test Championship Combined XI
Dimuth Karunaratne (C)
Rohit Sharma
Marnus Labuschagne
Steve Smith
Ben Stokes
Rishabh Pant (WK)
Mohammad Rizwan
Ravichandran Ashwin
Kyle Jamieson
Pat Cummins
Stuart Broad
Tim Southee
For more World XIs, check out the articles below!
World Test Championship Statistics
Finally to cap it off, here are the statistics. Ashwin went up to #1, Rahane and Rohit Sharma remained at #5 & #6 respectively. Rahaen, Taylor, Watling, and Pant show up in the catches/dismissals section.
Most Runs
Most Wickets
Most Catches
Most Dismissals
Marnus Labuschagne – 1675
Ravichandran Ashwin – 67
Joe Root – 34
Tim Paine – 65
Joe Root – 1660
Pat Cummins – 70
Steve Smith – 27
Quinton de Kock – 50
Steve Smith – 1341
Stuart Broad – 69
Ben Stokes – 25
Jos Buttler – 50
Ben Stokes – 1334
Tim Southee – 56
Ajinkya Rahane – 23
BJ Watling – 48
Ajinkya Rahane – 1159
Nathan Lyon – 56
Ross Taylor – 21
Rishabh Pant – 41
World Test Championship Final Review – Statistics
Best Scores
Best Bowling Figures
David Warner – 335* (Vs Pakistan – Adelaide)
Lasith Embuldeniya – 7/137 (Vs England – Galle)
Zak Crawley – 267 (Vs Pakistan – Southampton)
Ravichandran Ashwin – 7/145 (Vs South Africa – Visakhapatnam)
After two long years of Test cricket & coronavirus interruption, the World Test Championship Final is finally here.
Rising Kiwis are slightly better prepared against world beaters India with a series against England. India has been in England for a few weeks due to quarantine but have only played an internal practice match.
Two of the best teams on show, finally some context for Test cricket, BJ Watling’s retirement, but will rain spoil it all?
The idea of the World Test Championship is not a new one.
World Test Championship was supposed to become a reality in 2009, 2013, & 2017, but each of those iterations were cancelled in favor of much more lucrative, ICC ODI Champions Trophy.
Imagine an Indian team comprising of Sehwag, Sachin, Dravid, VVS Laxman, MS Dhoni, Zaheer Khan competing against McCullum’s 2015 team or even better, the golden South African era of Jacques Kallis, Graeme Smith, AB De Villiers, & Dale Steyn earlier in the decade.
Anyway, World Test Championship finally came into existence in 2019 and began with the England-Australia Ashes series. 58 matches later, India and New Zealand are deservedly in the finals, carrying bench strengths of envy.
25% spectator capacity will be allowed in the stadium.
ICC Changes implemented
The new ICC playing conditions are now in place. Two of the most prominent for this match will be:
The LBW zone for DRS umpire call decisions has been shifted a little bit. It would be interesting to see how many LBW decisions are overturned in this Test match.
A reserve sixth day will be utilized in case all possible overs are not recovered during the five days. Looks highly likely that the sixth day will come into play.
There is a 100% rain forecast for the first four days of the Tests and then down to 80% and 70% for the couple of days after. Well, it is England….
Recent ICC Record
Here is a recent ODI & T20I World Cup history for India and New Zealand. Both teams have underwhelmed over the past decade given their talent. Since 2007, here is how the teams stack up.
India At ICC Events
Champions Trophy – Winner (2013), Runners-Up (2017)
ODI World Cup – Winner (2011), Semi-finals (2015), Semi-finals (2019)
T20I World Cup – Winner (2007), Runners-Up (2014), Semi-finals (2016)
New Zealand At ICC Events
Champions Trophy – Runners-Up (2009)
ODI World Cup – Semi-finals (2007), Semi-finals (2011), Runners-Up (2015), Runners-Up (2019)
T20I World Cup – Semi-finals (2007), Semi-finals (2016)
These records are meaningless because tomorrow is a new day and Test cricket is just another beast.
India began by routing West Indies in the Caribbean, before securing points at home against lackluster South Africa & Bangladesh teams.
Then came the tours Down Under. While Kiwis routed India in swing bowling conditions, India delivered a masterclass of ages in Australia. After 36/9 in Adelaide, Rahane’s century resurrected India in Melbourne. Then, the Pujara-Pant-Vihari-Ashwin show ensured India survived the 3rd Test, and the youngsters Shardul-Sundar-Pant-Siraj broke the Gabba fort to retain the Border-Gavaskar Trophy.
Finally, the England home series was a completely one-sided event even after Joe Root’s classic gave England a headstart at Chennai. Ashwin’s all-round magic at home & Axar Patel’s memorable debut ensured India ease past England.
World Test Championship Final Preview – India’s Road To Glory
*Signifies away series
New Zealand
New Zealand’s road to glory was much more formulaic.
The Kiwis started with away tours of Sri Lanka & Australia. While they put on a good show in New Zealand, winning one match, they were hammered in Australia (barring Neil Wagner’s intense series).
At home, it was same old. Swinging conditions. Boult, Southee, and debutant of the year, Kyle Jamieson, wrecked havoc against India and West Indies. Only Pakistan provided any semblance of resistance with Fawad Alam’s classic fourth innings ton going in vain with four overs left in the Test match.
World Test Championship Final Preview – New Zealand’s Road To Glory
World Test Championship Final Preview – The Teams
India
Watch out for Ajinkya Rahane. He has a tendency to perform when it matters the most although his lack of consistency is frustrating. Rahane’s leadership & century in Melbourne was the catalyst for India in the memorable Border-Gavaskar Trophy. Since then, his form has gone hiding. England will bring back nice personal memories, and he is probably India’s best batter in swinging conditions. It is high time he shows up.
There were rumors that Mohammad Siraj would play in place of one of Mohammad Shami or Ishant Sharma, but that did not happen. India’s bowling has variety with Bumrah’s accuracy, Ishant’s seam, and Shami’s reverse swing. Looking forward to watch Ishant, who is in his 4th and most rewarding phase of his career. His 7-74 at Lord’s in the last tour was especially spectacular.
Tributes have started flowing in for BJ Watling in his retirement match. This one is my favorite, especially his mom’s statement. Watling has been a symbol of this rising team’s resilience and stability. Always solid behind the stumps, he will go down as Kiwis’s greatest keeper, but what I will miss the most is his rearguard action. NZ’s middle order rarely collapsed, but when it did, Watling was at the rescue. The question is, does he have one fighting innings left in him?
This is a very understated team, but do you know who is the New Zealand in the New Zealand team?Tom Latham & Henry Nicholls. When the Conways, Williamsons, or Taylors make huge scores around them, you can guarantee that Latham-Nicholls will provide ample solid support. Expect one of them to rise to the occasion in the finals.
Watch Out For
Sharma-Shubman Vs Pace brigade of Boult-Southee-Jamieson: This might as well set the tone for this match. A Mumbai Indians mini-match between Boult & Rohit Sharma.
Latham-Conway-Nicholls Vs R Ashwin: Ashwin has been India’s most successful bowler in this WTC cycle and has performed across all conditions (with both bat and ball). Conway is in the form of his life and the Kiwis have 2 other left-hand batters in the Top 5. Expect to see a lot of Ashwin.
The slip catching.England’s dropped catches were on show in the last series and they have been one of the worst slip catching sides in the past two years. So I am glad Ind-NZ are playing this week. Both teams have legendary fast bowlers, so the ball will go to the slips more than usual. Rest assured, the catches will be taken. Rahane, Taylor, Rohit, Kohli, Latham should do the job.
Starting XIs
India
India has revealed its XI ahead of time. Shardul Thakur, Washington Sundar, Mohammad Siraj, Hanuma Vihari, Axar Patel, Mayank Agarwal all played crucial roles in the lead up to the WTC Finals, but unfortunately did not make the final XI. This is also the first time that Jadeja-Ashwin-Sharma-Shami-Bumrah will play together. What a mouth-watering lineup.
Squad: Hanuma Vihari, Wriddhiman Saha (WK), Umesh Yadav, Mohammad Siraj
New Zealand
New Zealand’s lineup selects itself, but the crucial question is the #7-8 spot. Matt Henry, Neil Wagner, & Ajaz Patel performed admirably in the England series and Colin de Grandhomme has been out for a while, so will they go for a four-fast bowler strategy? Ajaz Patel should have done enough in the England series for a spin option in this Southampton pitch.
Tom Latham, Devon Conway, 3. Kane Williamson*, 4. Ross Taylor, 5. Henry Nicholls, 6. BJ Watling (WK), 7. Colin de Grandhomme/Kyle Jamieson/Matt Henry, 8. Tim Southee, 9. Neil Wagner, 10. Trent Boult, 11. Ajaz Patel
Squad: Will Young, Tom Blundell (WK)
Mitchell Santner, Daryl Mitchell, Doug Bracewell, Jacob Duffy, and Rachin Ravindra failed to make the final cut.
Prediction
I honestly cannot see a way past the weather. Both teams have excellent bowling options, so unless both teams suffer collapses twice, a result would be very hard to attain.
Would love if we get a full game, but for now, going with a Draw.
Verdict: Draw 0-0
If the game does happen, what am I excited for the most? Neil Wagner’s intensity, Colin de Grandhomme’s hairdo, Williamson-Kohli-Southee’s continuing journey from U-19 World Cup, Pujara-Pant combination, Ross Taylor’s wisdom, an emotional sunset to Watling’s wonderful career, and in general, just a hard-fought sporting final.
India
New Zealand
MVP
Ajinkya Rahane
Henry Nicholls
Most Runs
Rohit Sharma
Tom Latham
Most Wickets
Ishant Sharma
Tim Southee
X-Factor
Ravichandran Ashwin
Ajaz Patel
Verdict
Draw
Draw
World Test Championship Final Preview – Prediction
Like this content on World Test Championship Final Preview so far? SUBSCRIBE HERE to receive updates about new articles right in your inbox! If you are on social media, give us a follow in any of the social media outlets below:
Also comment below with out thoughts on this Alternative World Test Championship Table!
COPYRIGHT @Nitesh Mathur, aka Nit-X, 06/18/2021; Email at bcd@brokencricketdreams.com
World Test Championship Records
Are there are records that can be broken in the World Test Championship Final?
Batting
It is really interesting that even though NZ made it to the finals, there is nobody in the top 15 run-scorer. Combination of several players standing up and the fact that NZ did not play as many games. Kane Williamson is at 16th with 817 runs and Tom Latham is 25th with 680 runs.
India, on the other hand, have 5 batters in the Top 15:
Rahane – 1095 (5th)
Rohit Sharma – 1030 (6th)
Kohli – 877 (11th)
Agarwal – 857 (12th)
Pujara – 818 (15th)
Bowling
Ashwin is on #3 with 67 wickets and Southee is New Zealand’s best at #5 with 51 wickets.
Kyle Jamieson – 36 (12th)
Ishant Sharma – 36 (13th)
Mohammad Shami – 36 (14th)
Jasprit Bumrah – 34 (16th)
Trent Boult – 34 (18th)
Neil Wagner – 32 (20th)
Fielding and Dismissals
Both teams are pretty close on this list with BJ Watling – 43 dismissals (4th) and Rishabh Pant – 40 (5th).
In terms of catches, Rahane – 22 catches (4th) and Ross Taylor – 18 (5th) are at the top with Rohit Sharma – 16 (6th) and Virat Kohli – 16 (7th) close behind. New Zealand’s next best is Tom Latham – 14 (12th).
Time to reveal the results from my most substantial project of the year—Alternative World Test Championship Points Table. Consider this my thesis as a culmination of work that has taken almost a year to put in place.
On July 29, 2020, my friend and I proposed how To Fix the WTC Points Table? At that point, the idea was to expose the problems of the current WTC system and propose how an alternative points table could be constructed.
Fast forward eleven months — after analyzing each of the 23 WTC series & 58 scorecards inside & out, converting our proposal into a tangible algorithm, and programming it in R language, we have finally put the algorithm in action.
Here is the revelation: Australia should havebeen in that WTC Final later this week against India, and I now have the data to prove it.
*Disclaimer: Don’t get me wrong here. This article is not meant as a commentary on the New Zealand Cricket Team. The Kiwis have done a fantastic job over the past five-six years or so. Rather, this article is meant to expose the flaws in the World Test Championship Points Table and compare how a better-developed points table would have looked like.
Alright here we go. Here is how this article structure is going to work:
First we are going to display our results right away— Original vs Alternative WTC Points Table side by side. Then, we
Review the problems in the original system and restate the key motivations
Lay out the Proposal & Algorithm
Display interesting observations and debunk a myth
Illustrate the power of the alternative point system’s through series analysis— The Ashes, England vs West Indies/Pakistan, the Border-Gavaskar Trophy, New Zealand-Pakistan, & West Indies-Sri Lanka
Explain the process of collecting data & issues encountered
Finally go over implications of our proposal.
Notes:
The detailed result (team-by-team & series-by-series data) is displayed in the colorful Appendix Sectionat the bottom of the article for your kind reference.
Here are some abbreviations to keep in mind:
H/A: Home/Away
W/T/L: Won/Tied/Lost
RR: Run-rate
Australia (AUS), Bangladesh (BAN), England (ENG), India (IND), New Zealand (NZ), Pakistan (PAK), South Africa (SA), Sri Lanka (SL), West Indies (WI)
Alternative World Test Championship Points Table
Facts
Before we get into the Points Table, here are the facts of how each team performed. Pay special attention to the home and away.
Team
Matches (Away/Home)
W (Away/Home)
L (Away/Home)
D (Away/Home)
India
17 (8 A, 9 H)
12 (4 A, 8 H)
4 (3 A, 1 H)
1 (1 A, 0 H)
Australia
14 (5 A, 9 H)
8 (2 A, 6 H)
4 (2 A, 2 H)
2 (1 A, 1 H)
New Zealand
11 (5 A, 6 H)
7 (1 A, 6 H)
4 (4 A, 0 H)
0
England
21 (10 A, 11 H)
11 (6 A, 5 H)
7 (4 A, 3 H)
3 (0 A, 3 H)
Pakistan
12 (7 A, 5 H)
4 (0 A, 4 H)
5 (5 A, 0 H)
3 (2 A, 1 H)
Sri Lanka
12 (6 A, 6 H)
2 (0 A, 2 H)
6 (3 A, 3 H)
4 (3 A,1 H)
West Indies
11 (7 A, 4 H) *
3 (3 A, 0 H)
6 (4 A, 2 H)
2 (0 A, 2 H)
South Africa
11 (5 A, 6 H)
3 (0 A, 3 H)
8 (5 A, 3 H)
0
Bangladesh
7 (5 A, 2 H)
0
6 (4 A, 2 H)
1 (1 A, 0 H)
*The analysis is before the ongoing West Indies-South Africa series, which is another pointless concept. Why is a World Test Championship group stage game scheduled the same time as the WTC Final?
Alternative Vs Original WTC Points Table
The next table is listed in order of the Alternative WTC Points Table (With this ranking, India & Australia would have met at the WTC final later this week).
In comparison, the original rank is shown in the final column. Rankings for India (most stable team), England/Pakistan (most mediocre), & Bangladesh (worst/did not play as much) are the same, but the rest of the alternative rankings are different compared to the original.
The third and fourth column compares the percentage according to the alternative world test championship points table algorithm versus original WTC percentage. In general, the current WTC inflates how the teams were in real-life. The top teams were really not as good as the numbers suggests and vice-versa with the bottom teams.
We will describe how we got to the “Total Points” and “Points Possible” in the next two sections. (If you are curious about total points for every series per team, feel free to scroll to the Appendix at the bottom of the article).
Team
Total Points
Points Possible
Alternative Percentage
Original Percentage
Original Rank
India
551
846
65.13%
72.2%
1
Australia
414
684
60.52%
69.2%
3
New Zealand
312
546
57.14%
70.0%
2
England
564
1026
53.92%
61.4%
4
Pakistan
280
608
46.05%
43.3%
5
Sri Lanka
242
600
40.03%
27.8%
8
West Indies
217
562
39.74 %
33.3%
6
South Africa
181
530
32.97%
30.0%
7
Bangladesh
72
362
19.34%
4.8%
9
Alternative World Test Championship Points Table
*Sure Australia would have reached t
he WTC Finals if not for the -4 over-rate deduction in Melbourne vs India or if they had not cancelled their South Africa visit, but our Alternative algorithm displays this claim convincingly.
Background
Our Alternative World Test Championship Points Table fixes several of the problems encountered in the current system, a system dominated by the Big 3—India, Australia, & England.
Our proposal would work even better in an ideal balanced world where the problems listed below have been fixed.
Number of points fluctuate depending on # of games per series: A 2-match series is allotted 60 points per game, while 3, 4, and 5 match-series are awarded 40, 30, and 24 points respectively. This is totally absurd.
Number of Tests Played is uneven: In this WTC cycle, England played 21 Tests, while West Indies, South Africa, and New Zealand played 11 each. Marquee series like Ashes, Border-Gavaskar, Basil D’Oliveira Trophy, etc. are 4-5 Tests each while SL & NZ only play 2 Tests regularly.
Currently no distinction is made for Home/Away advantage: West Indies winning in Bangladesh, India winning in Australia, or Australia drawing in England should be worth more than home wins.
All-or-Nothing System:Test matches occur over 5 days or a max-of-15 sessions. One session can have a huge impact on the series. Yet, the points are awarded on an all-or-nothing basis.
Relegation-Promotion Needed:This WTC cycle exposed the gap between the top 4 teams and the rest of the table. The World Test Championship was supposed to provide context for Test cricket, especially for the lower-ranked teams. It has done just the opposite.
Proposal for the Alternative World Test Championship Points Table
The Goal
Our goal was to avoid the two spectrums of Simplicity vs Complexity. While the current WTC Points Table is simple, it does not do a good job at incorporating the numerous factors of a Test match.
On the other hand, we wanted to avoid a complicated system like Duckworth-Lewis-Stern or the ICC’s Rankings systems, that is barely understood even by the experts of the game.
The Proposal
We proposed a two-tiered system that incorporates (1) Session-by-session data and (2) Home/Away advantage. The proposal answered three specific questions:
Question 1:Why does the Losing Team in a 5-day Match Get 0 Points?
A Test match is long. After almost 40 hours of hard-fought battle, there is no way that a Fawad Alam-inspired Pakistan team that comes so close to a 5th day draw should receive 0 points only due to a Mitchell Santner jumping catch?
The beauty of a Test match is in its ebbs and flows, twists & turns.
A Stuart Broad spell, a Vihari-Ashwin blockathon, a Jermaine Blackwood-style counter-attack, or a Stokes-Pant-Myers/Bonner fourth innings special can change a match. There are periods where wickets are falling right and left, bowls just beating the edge. Oohs and ahhs. Later, the story might change with periods of fast run-scoring, counter-attacks, flat pitches, etc.
So how can we incorporate these moments into data?
Resolution 1: Session-by-Session Points
We first award points based on the number of sessions a team wins/ties/loses.
Since each day has 3 sessions, there is a maximum of 15 sessions possible in a Test. Since winning a session is awarded 2 points, the maximum session points possible is 30 (15*2).
Session
Points
Won
2
Tied/Even (or Washed Out/ Bad Light)
1
Lost
0
Session-By-Session Points
Question 2:How Can We Incorporate Home/Away Points?
This was the most popular concern and rightly so. It has always been tougher to win overseas Tests and the last decade has made it even more lopsided. Here is the fix. On top of the session-by-session data we add a:
Resolution 2: Fixed points system for Home and Away matches.
Combining resolution 1 & resolution 2, we get the total points available per Test match in the last column.
Points
Win
Draw
Loss
Maximum Points Possible (Per Match)
Home
16
8
0
46
Away
24
12
0
54
Average
20
10
0
50
Home & Away Points
*If the WTC cycle is scheduled with equal number of home and away games, for this portion we get an average of exactly 20 points for wins & 10 points for a draw. In total (with +30 from session points), it averages out to be 50 points per game.
Question 3:Is There An Equivalent of Net-Run Rate for Test Cricket?
In a Test match, how can we measure the magnitude of victory or defeat?
The ODI Super League at least has the Net Run Rate factor to signify how big a defeat or victory was. There is no such data in the current WTC Points Table. A 1-run victory achieved on the 5th day and an innings victory in a 2-day Test is worth the exact same.
Resolution 3: Bonus — Winning team is rewarded remaining sessions if match finishes early
When a team usually wins by an innings (or more than 100 runs, or with 8-10 wickets in hand for that matter), usually several sessions/days are still left.
Hence, the winning team is awarded the remaining session-by-session points (2* # of remaining sessions). This will incentivize teams on the edge to fight harder and take the game deeper even if they are on the verge of losing. On the other hand, it can convince captains to go for bold declarations in order to win earlier.
The Algorithm
In order to remove any semblance of subjectivity, we created the following algorithm to determine W/T/L for a session.
Here is the specific criteria along with the reasons as to why we added that part.
Sessions
If (0 overs are bowled – washed out session) OR if (RR >= 4 AND wickets >= 4)*
Session is tied and both teams get 1 point each
If (only 1 wicket falls) OR (RR >= 3.5 AND wickets <=3) OR (RR <= 2 AND Wickets <=2)
Batting team wins session and receives 2 points
Reason:If wickets are preserved and run-rates are decent, then the batting team should be rewarded. In some contexts like the first session of a Test match, even if the run-rate is slow, the batting team should be rewarded if only 2 or less wickets fall.
If 4 or more wickets fall OR (RR <= 2) OR (Wickets >= 4 AND RR >= 3.5)
Bowling teams wins session and receives 2 points
Reason: If the bowling team is disciplined and restricts the run-rate to a minimal or if they take more than 4 wickets in certain conditions, they should be rewarded.
Any other case
TiedSession; Both teams get 1 point each
*Special thanks to Vandit for co-creating this algorithm and working through the entire WTC process with me.
The Stokes-Pant-Bonner/Myers Outlier
*One may ask why did we need (RR>= 4 AND wickets >= 4) section? Usually the bowling team should be rewarded when a heap of wickets fall, but this session is what I like to call the Stokes-Pant-Bonner/Myers Outlier.
On paper, 5 wickets in a session would definitely be a bowler’s session, but as a viewer, we know 124 runs at a run-rate of 4.22 due to Stokes’ brilliance should at least be a tied session.
This just one of the few examples which helped us tweak our algorithm to align with real-life events.
Also comment below with out thoughts on this Alternative World Test Championship Table!
COPYRIGHT @Nitesh Mathur, aka Nit-X, 06/14/2021; Email at bcd@brokencricketdreams.com
Observations: Which Team Won the Most Sessions?
Now to the fun part—the analysis. After we applied the above algorithm to all the Test matches, here are some fascinating things we observed.
Observation 1: What Sets India Apart?
If we look at the sessions graph below, not much sets India and Australia apart. In fact, both Australia and India won exactly 74 session each. Sessions tied (IND 59-56 AUS) and sessions lost (IND 48-46 AUS) are pretty close as well.
What put India to another level is an additional108 Bonus Points. Altogether, India won by 54 sessions to spare – that is 18 days of Test cricket! Australia, in comparison, received 46 bonus points (23 sessions to spare).
Our algorithm rewarded India due to the fact that they won their WTC Test matches more convincingly than any other team (Well, it helped that at home, India played Bangladesh, a weak SA team, and an English team that was rolled over in 2-day Tests, but that is another story).
It is interesting that although Australia crushed Pakistan & New Zealand at home and blew India apart with that 36 All-Out, the last three Test matches in the BGT cost them important bonus points.
Observation 2: England Won, Tied, and Lost the Most sessions
England won 84 sessions, tied 102 sessions, and lost 83 sessions—the most for any team is all three categories. England play the most Test matches, which ended up biting them in the backside.
They won three overseas Tests against South Africa and two against an Embuldeniya inspired-Sri Lanka, two of the hardest touring venues in cricket (even though they are both in an extended transition zone). England also lost 7 matches, 3 at home (Australia, West Indies) and four abroad, the final three coming in the India series, where they lost by huge margins.
Tip of the Day: If England keep playing more Test cricket, it will increase their likelihood of losing more games, thereby reducing their chances to go to future WTC finals. Hence, it is in England’s own best interest to vouch for equal number of games (home & away) for every team in a WTC cycle.
Observation 3: The Importance of Draws
One of the stark differences between the original WTC Points Table and our table was Sri Lanka’s ranking. In the original ranking system, SL ranked 8th (27.8%) as opposed to our table, in which SL ranked 6th (40.03%).
Lanka actually drew most Tests than any other team (4), and 3 of them away. An away draw might be regarded higher than certain home wins.
Our Home/Away weightage boosted them right behind Pakistan, who are comparable in the graph below. One thing is clear—there is no way SA should have leapfrogged SL. SA lost more sessions, won/tied way less sessions than Sri Lanka, and their only wins were at home (3 wins compared to SL’s 2). Not even a draw abroad.
Unforeseen Effect of New Algorithm: Our algorithm helped the lower-ranked teams. If the Relegation-Promotion system was put in place, Pakistan (46.05%), Sri Lanka (40.03%), & West Indies (39.74%) would be in a heated battle rather than not having no context for lower-ranked teams. Even Bangladesh, which was at 4.8% in the original WTC Points table is at 19.34%, due to some flat roads in Sri Lanka.
Alternative World Test Championship Points Table – Session Data
Observation 4: The Moeen Ali Anomaly
Usually the team that wins the Test ends up winning the last session of the game. This was not the case in the 2nd Test of the India-England series.
Lunch at Day 4 – England were 116/7 in 48. 3 overs in a chase of 482 runs. Post-lunch, India would have expected to easily wrap up a 350+ run victory, but Moeen Ali had other plans.
Sent in at #9 (really #9, England team management?), Ali blitzed 43 (18) with 5 sixes and 3 fours. England scored 48 runs for 3 wickets at about 8.7 RR and won that final session, despite losing the Test by 317 runs.
Little did they know this would be their final shining light as they were systematically dismantled by Axar Patel for the final two Tests.
Observation 5: Pakistan Had It Rough
Pakistan played the second-least amount of games at home (5) after the West Indies and had away series in Australia, England, and New Zealand.
That schedule is asking for trouble.
Even though they competed admirably in England & New Zealand, one bad series in Australia ruined their figures. What’s more? Their series in Zimbabwe did not even count.
Still ended up at #5 in both the tables – the best of the 2nd half of the table.
Debunking The Myth
The Myth: NZ Got An Unfair Entry In the WTC Final Due to Home Games
New Zealand has received a lot of criticism that they loaded the points at home and hence jumped through the top.
Actually, England (11), Australia (9), India (9) had more designated home games, while Sri Lanka (6) & South Africa (6) had the same. On the other hand, New Zealand played the same of away games as Australia, South Africa, and Bangladesh had the same number of away games, five each.
Both NZ & SA played the exact same number of games (same home/away as well), and both places are tough touring destinations as well. The fact that NZ took advantage of their conditions speaks to their ability rather than pure luck. Otherwise, SA would have been right there up with NZ instead of languishing at the bottom of the table.
Oh yeah and also New Zealand played both home & away 2-Test series against England during this period, neither of which counted towards the WTC. They won 1-0 both of them each. (Another reason why FTP & the WTC should merge. Every game should count)
Series Illustration
We now illustrate the algorithm by comparing the Actual Series Total against the Alternative BCD (Broken Cricket Dreams) Series Total.
Ashes 2019
Actual Series Total: England56-56 Australia
Alternative BCD Series Total: England113-137 Australia
What do you recall from the 2019 Ashes? Steve Smith’s godly tour, David Warner’s Stuart Broad misery, Stokes’ Headingly conquest, Leach’s glasses, Tim Paine’s review & Nathan Lyon’s missed run-out, Marnus Labuschagne’s concussion-substitute surprise introduction, Jofra Archer’s brilliance?
Ashes of the ages. As close as it gets. At the face of it, 56-56 looks like a decent result but let us dig a little deeper. Australia won 2 away matches, drew 1 match, and barely lost Headingly.
Ask yourself, did Australia deserve to get 0 pointsfor the hard-fought HeadinglyTest? Oh yeah, and if you forgot, England were also bowled out for 67 in the first innings, another example where sessions can change the complexion of a match.
Altogether, 25 sessions were tied, Australia won 25, and England won 17. However, England won with a total of 7 sessions to spare in the series compared to Australia’s 2, which ensured they received more bonus points. Hence, the 137-113 was a better indicator of the competitive Ashes than the 56-56.
England Post-COVID
Actual Series Total:England80-40 West Indies, England66-26 Pakistan
Alternative BCD Series Total: England87-61 West Indies, England75-71 Pakistan
We should all be grateful to England, West Indies, Pakistan, & Ireland to get cricket started again post the initial COVID lockdown.
The matches in these two series were closer than they appear.
Jermaine Blackwood-led successful overseas chase in the first Test, Kemar Roach’s brilliance & #1 Test all-rounder Jason Holder were especially spectacular. Although West Indies fizzled out at the end, they were in the series for the most part. When they were not taking wickets, they kept the opposition’s run-rate down and tied most sessions. WI winning an away Test and being competitive throughout made it a 87-61 series.
Pakistan’s series was statistically even more interesting. In the last two Tests, Pakistan earned two away draws courtesy rain-affected games, so we should analyze the first Test by itself. If you remember, this was Shan Masood’s epic 156, where he almost carried the bat. Although Pakistan collapsed as usual towards the end and lost, the fact that they batted for the first five sessions of the game and won more sessions than England (7-W, 1-T, 4 L) gave them a series total of 75-71.
Super close without actually winning a single game.
Border-Gavaskar Trophy
Actual Series Total:Australia 40-70 India(36-70 with over-rate deduction)
Alternative BCD Series Total: Australia 91-113 India
Here is a thought experiment—Imagine if Rishabh Pant had gotten out in the last session of Day 5 in the Gabba chase and Tim Paine’s prophecy would have come true. India would have been heartbroken and the current WTC Points Table would have switched to Australia 70-40 India.
A session here or there and Australia, barely scraping by at home, would have received the exact same number of points as opposed to the blood, sweat, & tears via Vihari-Ashwin fightback, Siraj’s leadership, Shardul-Shubman-Sundar-Pant’s youth, & Pujara’s toil.
Our algorithm encodes these little moments in the session-by-session data. India won 14 crucial sessions, Australia won 18, and 17 were tied. Australia benefitted from bonus points after they wrapped India up in one session at Adelaide with 36/9. Just like Australia were in the Ashes, India’s 2 away wins & a draw boosted them up.
You see, there is something for everybody.
(Oh and if you were wanting confirmation, if India had lost Gabba, our algorithm would have awarded Australia 107-89 India, which is still pretty close).
Alternative BCD Series Total: New Zealand 72-20 Pakistan
New Zealand steamrolled almost every opposition at home except for Pakistan.
In the first Test, Pakistan lost with just 4-overs to go. Digest that for a second. There are 450 possible overs to bowl in a Test match. Just 4 overs…
Pakistan stalled for 123.3 overs in the 4th innings due to the heroics of missing-in-action-kid-of-the-decade Fawad Alam, Azhar Ali, and the ever-dependable Mohammad Rizwan. Even in the second Test, Azhar Ali-Abid Ali-Faheem Ashram-Mohammad Rizwan won Pakistan some sessions.
What did Pakistan get for challenging New Zealand in their own backyards? Exactly 0 points.
Neither were Pakistan bad enough to 0 points or New Zealand so brilliant to hoard 120 points all by themselves.
West Indies- Sri Lanka
Actual Series Total:West Indies 40-40 Sri Lanka
Alternative BCD Series Total: West Indies 45-55 Sri Lanka
This was the only instance of every match of the series being drawn. The two-Test series ended with a 0-0 score line. A 40-40 is a fair result, but with two away draws, Sri Lanka nudges slightly above with 55-45 in the alternative world test championship table.
Data Collection Process
Motivation
Initially, we did this the old school way.
For the first 33 Test matches, we literally perused through the commentary and Match Notes section of the scorecard and manually decided which team won each session. Talk about tedious…
This was difficult for two reason: (1) It was hard to keep up after every Test match, and more importantly, (2) it was completely subjective.
In order to standardize the process of determining who won each session and remove any biaswe had after watching the match, I decided to code our algorithm in R and re-do the process from scratch.
How Did We Get Our Data?
Before we could start implementing our proposal, we had to first get the data.
Our main data source was ESPN Cricinfo’s Match Results list for ICC World Test Championship, 2019-2021. As an input, I fed each scorecard individually into the program. The next step was to figure out how to get session-by-session data.
If you scroll to the bottom of the scorecard, there is a Match Notessection, which summarizes important moments at each interval of the match. The idea was to have our program read through these Match Notes and after preprocessing and removing the unnecessary characters, return data at“Lunch, “Tea”, “Innings Break”, and “End of Day.”
The important features to record at every interval were as follows: (1) Team Batting, (2) Runs, (3) Wickets, & (4) Overs. This data was stored in tables so all the data for lunch, tea, innings break, and end of day for all five days (or however long the Test match lasted) could be easily accessed.
Once the data was all nice and clean, things got a bit easier. At this point, we could compute the run-rate in each session and check if there was a switch of innings (all-out or declaration). Using this data, we could allocate points based on the proposal above.
We repeated this process for all the 58 matches and added up the points. Finally due to COVID*, we divided the total number attained by the total possible.
*Due to COVID-19 interruptions equal number of H/A games was not possible, so percentage was used.
Issues Faced
Initially I thought, reading data from a scorecard would be an easy task, right?Wrong. I was surprised by the inconsistency in some of the records.
For example, when a day is rained out, sometimes they will put: “Rain – 0/0, Lunch – 0/0, End of Day – 0/0.” Almost always, in a rained-out game, some of the sessions were missing which made it difficult to automate the program efficiently. Day/Night matches were especially hilarious. Instead of “Tea” & “Dinner”, in some games “Lunch” and Tea” were written. In others, it was a combination of all four!
A more subtle issue was when innings break occurred at the same time as an interval. In some occasions, Innings Break” and corresponding score was avoided, which caused our data table to have some missing values.
Anyway, you get the point. There were several other little issues, but I do not want to sound like a broken record. What this process influenced me to do confirm after every scorecard was read that all the data was stored correctly in the program.
Quality check.
Conclusion
The Alternative World Test Championship Points Table & the original table only had India (1), England (4), & Pakistan (5) in the same positions. Since our algorithm weighted away games more & took sessions in context, the rest of the rankings were different.
Is it the best algorithm? No, but it is definitely better than the current system by a landslide. I will continue to make improvements to this algorithm for the next iteration and apply this alternative system for the next cycle of the WTC.
Making Test cricket more equitable to all the cricket playing nations (and not just the Big 3) is definitely a challenge in the age of T20 leagues, but if huge financial restructure cannot happen, at least a change in the World Test Championship Points Table is a place to start.
In any case, end results are end results. No argument. Journey is the important part. We tend to ignore or forget the little pleasures in life by focusing on the end goal. Enjoy, smile, learn, & support each other.
My best wishes to India and New Zealand for the World Test Championship this week.
Before I end this, here are some thoughts by cricketers & commentators on the WTC Points Table.
What Cricketers & Commentators Say About the WTC Format
“I can’t quite work out how a five-match Ashes series can be worth the same as India playing Bangladesh for two Tests.”
“This difference in value for winning a Test match I thought didn’t take into account the enormity of a contest, the toughness of the contest, and thought if I had to conceive a plan to get to the final of the World Test Championship, I would play 2 Test matches at home on pitches that I like.”
“I think going forward, maybe the WTC could add context this way, two teams playing away from their home and sort of bringing the whole ebbs and flows of the game.”
“Ideally, in the long run, if they want to persist with the Test Championship, a best-of-three final will be ideal. As a culmination of two-and-a-half years of cricket around the globe.”
So what did you think about this article and the Alternative World Test Championship Points Table? COMMENT BELOW with your opinions! Would love to engage!
Appendix
The team-by-team and series-by-series (at the very bottom) tables are presented below.
Alternative World Test Championship Points Table Team-By Team Data
*symbolizes Away series. An away series has a maximum possible of 54 points, while a Home series has a maximum of 46 points.
List of Teams
India
India
Home/Away
Session
Bonus
Total
Matches
Total Possible
Vs WI*
48
27
14
89
2
108
Vs SA
48
51
20
119
3
138
Vs Ban
32
26
28
86
2
92
Vs NZ*
0
16
0
16
2
108
Vs Aus*
60
45
8
113
4
216
Vs Eng
48
42
38
128
4
184
236
207
108
551
17
846
(551/846)*100 = 65.13%
Sessions: 74-59-48 (W-T-L)
Australia
Australia
Home/Away
Session
Bonus
Total
Matches
Total Possible
Vs Eng*
60
75
2
137
5
270
Vs Pak
32
28
12
72
2
92
Vs NZ
48
48
18
114
3
138
Vs Ind
24
53
14
91
4
184
164
204
46
414
14
684
(414/684) * 100 = 60.53%
Sessions: 74-56-46 (W-T-L)
New Zealand
New Zealand
Bonus
Total
Matches
Total Possible
Vs SL*
0
56
2
108
Vs Aus*
0
24
3
162
Vs Ind
24
76
2
92
Vs WI
20
84
2
92
Vs Pak
6
72
2
92
50
312
11
546
(312/546)*100 = 57.14%
Sessions: 53-36-39 (W-T-L)
England
England
Home/Away
Session
Bonus
Total
Matches
Total Possible
Vs Aus
40
59
14
113
5
230
Vs SA*
72
57
10
139
4
216
Vs WI
32
51
4
87
3
138
Vs Pak
32
37
6
75
3
138
Vs SL*
48
28
10
86
2
108
Vs Ind*
24
38
2
64
4
216
248
270
46
564
21
1046
(54/1046)* 100 = 53.92%
Sessions: 84-102-83 (W-T-L)
Pakistan
Pakistan
Home/Away
Session
Bonus
Total
Matches
Total Possible
Vs Aus*
0
20
0
20
2
108
Vs SL
24
29
4
57
2
92
Vs Ban
16
15
10
41
1
46
Vs Eng*
24
47
0
71
3
162
Vs NZ*
0
20
0
20
2
108
Vs SA
32
29
10
71
2
92
96
160
24
280
12
378
(280/378) *100 = 46.05%
Sessions: 56-48-52 (W-T-L)
Sri Lanka
Sri Lanka
Home/Away
Session
Bonus
Total
Matches
Total Possible
Vs NZ
16
22
6
44
2
92
Vs Pak*
12
27
0
39
2
108
Vs SA*
0
21
0
21
2
108
Vs Eng
0
22
0
22
2
92
Vs WI*
24
31
0
55
2
108
Vs Ban
24
33
4
61
2
92
76
156
10
242
12
325
(242/600)*100 = 40.33%
Sessions: 48-60-49 (W-L-T)
West Indies
West Indies
Home/Away
Session
Bonus
Total
Matches
Total Possible
Vs Ind
0
19
0
19
2
92
Vs Eng*
24
37
0
61
3
162
Vs NZ*
0
8
0
8
2
108
Vs Ban*
48
30
6
84
2
108
Vs SL
16
29
0
45
2
92
88
123
6
217
11
562
(217/562)*100 = 39.74%
Sessions: 29-65-50 (W-T-L)
South Africa
South Africa
Home/Away
Session
Bonus
Total
Matches
Total Possible
Vs Ind*
0
19
0
19
3
162
Vs Eng
16
45
8
69
4
184
Vs SL
32
17
22
71
2
92
Vs Pak*
0
21
0
21
2
108
48
102
30
180
11
546
(180/546) = 32.97%
Sessions: 36-30-64 (W-L-T)
Bangladesh
Bangladesh
Home/Away
Session
Bonus
Total
Matches
Total Possible
Vs Ind*
0
6
0
6
2
108
Vs Pak*
0
5
0
5
1
54
Vs WI
0
24
0
24
2
92
Vs SL*
12
23
0
35
2
108
12
58
0
70
7
270
(70/270)*100 = 19.34%
Sessions: 14-30-37 (W-L-T)
AlternativeWorld Test Championship Points Table Series-By-Series Comparison
Series (H Vs A)
Matches in Series
Result
Alternative Series Total
Original Series Total
England Vs Australia (The Ashes)
5
2-2
137-113
56-56
Sri Lanka Vs New Zealand
2
1-1
44-56
60-60
West Indies Vs India
2
0-2
19-89
0-120
India Vs South Africa (Freedom Trophy)
3
3-0
119-19
120-0
India Vs Bangladesh (Ganguly-Durjoy Trophy)
2
2-0
86-8
120-0
Australia Vs Pakistan
2
2-0
72-20
120-0
Pakistan Vs Sri Lanka
2
1-0
57-39
80-20
Australia Vs New Zealand (Trans-Tasman Trophy)
3
3-0
114-24
120-0
South Africa Vs England (Basil D’Oliveira)
4
1-3
70-139
24-90 (*SA -6 for over-rate penalty in the 4th Test)
Pakistan Vs Bangladesh
1
1-0
41-5
60-0
New Zealand Vs India
2
2-0
76-16
120-0
England Vs West Indies (Wisden Trophy)
3
2-1
87-61
80-40
England Vs Pakistan
3
1-0
75-71
66-26
New Zealand Vs West Indies
2
2-0
84-8
120-0
Australia Vs India (Border-Gavaskar Trophy)
4
1-2
113-91
36-70 (*Aus -4 for over-rate penalty in the 2nd Test)
New Zealand Vs Pakistan
2
2-0
72-20
120-0
South Africa VS Sri Lanka
2
2-0
71-21
120-0
Sri Lanka Vs England
2
0-2
22-86
0-120
Pakistan Vs South Africa
2
2-0
71-21
120-0
Bangladesh Vs West Indies
2
0-2
24-84
0-120
India Vs England (Anthony de Mello Trophy)
4
1-3
128-64
90-30
West Indies Vs Sri Lanka (Sobbers-Tissera Trophy)
2
0-0
55-45
40-40
Sri Lanka Vs Bangladesh
2
1-0
61-35
80-20
*Note, we have not yet added the Sir Vivian Richards Trophy (West Indies Vs South Africa) since that is ongoing during the WTC Final.
 (400 x 100 px) (4)")