Growing up in the 2000s, it felt like Australia won EVERYTHING in cricket—World Cups, Champions Trophies, the Ashes, Commonwealth, women’s, men’s, U-19—you name it.
Likewise, the USA, China, Russia, Great Britain, Australia, and France dominate the Summer Olympics. Every. Single. Time.
Why do these countries keep winning? And why doesn’t Djibouti rack up more medals? (For the record, Djibouti won a solitary bronze in 1988 Men’s Marathon).
The easy answers? These developed nations have better facilities, grassroots programs, and a robust ‘sporting culture’. But can we quantify this?
By applying Maslow’s Hierarchy of Needs to the economies of the 12 Test-playing cricket nations, 9 FIFA World Cup powerhouses, and six summer Olympic titans, I will create an economic hierarchy for international sports and uncover what it takes for a nation to consistently dominate the global stage. Here are the main questions I’m tackling today:
What is the minimum GDP per capita threshold required for a nation to achieve its first global sporting glory?
How rich must a country win to dominate one team sport?
At what economical threshold does a country go from a one-sport nation to a “sporting culture” like Australia, Russia, China, or the United States?
Let’s begin.
Key Takeaways
To secure its first major team sporting achievement or an Olympic medal, a nation must meet a minimum GDP per capita of $75-$250. Pakistan won an Olympic gold in field hockey in 1960, when their GDP per capita was just $82. Brazil’s GDP per capita was $235.6 in 1960 when they rose in football, India was at $296 in 1983, Sri Lanka – $776.2 (1996), and Afghanistan was at $560.6 when they qualified for the 2010 T20 World Cup.
To become a dominant ‘one-sport’ nation, the GDP per capita must rise to a minimum of $1000-$2500.
West Germany’s GDP increased from $1162.7 in 1960 to $5659.7 in 1974, by which team they had won two World Cups. When Argentina won again in 1986, they had amassed $3436.1 GDP per capita. Brazil reached $3298 by 1994.
Jamaica’s GDP per capita rose from $1632 in 1988 (two Olympic medals) to $5029.8 in 2008 (11 medals).
India’s GDP per capita rose from $544.1 in 2003 to $1021.9 in 2007 before they were able to launch the IPL.
When a nation reaches a minimum of $15,000 GDP per capita, a Global Hunger Index (GHI) < 5, and a poverty rate of less than 2%, they are able to rise to an Olympic and multi-team sport supergiant. China’s current GDP per capita is $13,870. They reduced their GHI from 13.4 in 2000 to <5 by 2016. Australia’s GDP per capita almost double from about $20,000 to $40,000 between 1999-2007, and currently have a GDP per capita of $67,980.
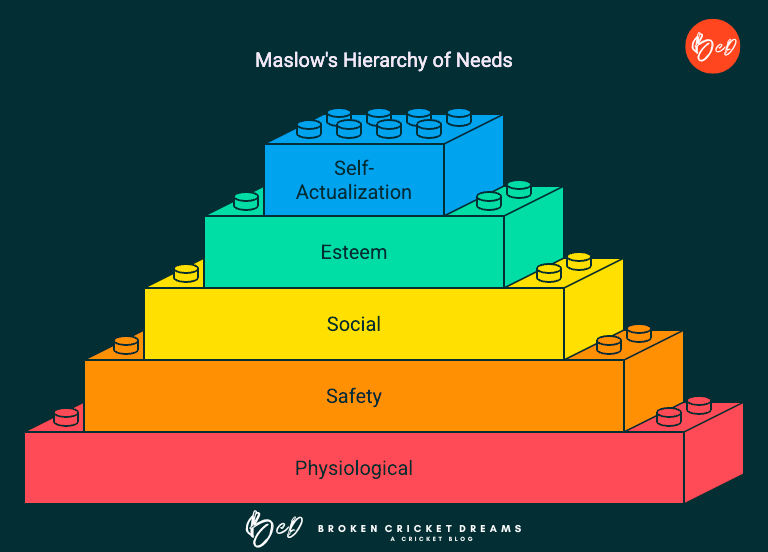
American psychologist, Abraham Maslow, proposed a model that distributed human behavior into five distinct levels:
Physiological Needs: Essentials like food, water, and shelter.
Safety: Security, financial stability, and health.
Love & Belonging: Relationships, intimacy, and connections.
Esteem: Self-respect, status, and recognition.
Self-Actualization: The pursuit of reaching one’s full potential.
The first two represent an individual’s ‘basic needs’, the next two are the ‘psychological needs,’ and the final level focuses on ‘self-fulfillment needs.’
My Theory on the Economics of Sports Dominance
The First Stage: Individual Triumphs
In a nation-state’s early stages, sporting success begins with individual pioneers who overcome socioeconomic hardships and limited infrastructure to achieve greatness. The only prerequisite is that the individual’s physiological needs are met during their physical growth. Think Milkha Singh’s story, rising against odds in post-Partition independent India to reach 4th in the 1960 Rome Olympics in the 400 meters.
The Second Stage: One-Sport Nations
As the nation progresses economically, it has the potential to become ‘one-sport’ nation based on cultural influences and accessible sports (for example, cricket in the British colonies, soccer globally). These teams often include athletes from both affluent and underprivileged backgrounds. Families meet Maslow’s safety needs, which enables the next generation to pursue sports. Think Pele’s Brazil in the 1960s or Sunil Gavaskar/Kapil Dev’s 1983 Indian cricket team).
The Third Stage: Middle Class Expands
Sustained economic growth strengthens the middle class, allowing nations to dominate in one sport and venture into others. By this stage, nations fulfill belonging and esteem needs, earning global respect among the sporting fraternity. Think China at the turn of the 21st century or India in the late 2000s.
The IPL in 2008 would not have been possible without India’s economic liberalization in 1991. Not only did the depth of Indian cricket increase drastically, the pool of business class citizens also increased—individuals who could afford to bet on the idea of the IPL.
This middle class and business growth also allowed India to form leagues like field hockey & Kabaddi and start winning individual Olympic medals in wrestling, badminton, gymnastics, shooting, etc.
The Fourth Stage: Cross-Sport Dominance
This can be a tricky transition phase for several nations due to population or limited resources. Dominating across multiple sports requires major investments across different sports, political will, and hosting global events. Before self-actualization, this can lead to a ‘Sleeping Giant’ phase. This is also the stage where nations typically begin excelling in women’s sports, as increased infrastructure and societal progress open doors for female athletes to thrive.
The All-Blacks from New Zealand may dominate rugby, the Kiwis and White Ferns are always competitive in cricket, and they win 10-20 Olympic medals every cycle, but with a population of 5 million, how much farther can they go?
The Fifth Stage: Self-Actualization
Decades of stability produce generations of affluent citizens, near-zero poverty, and world-class infrastructure. Athletes have the resources and environment to reach their full potential. Think the USA, USSR at the height of the cold war, China currently, Great Britain, Japan, and Australia.
Exceptions to the Rule
These conditions are the bare minimum necessary to be competitive. The reverse is not necessarily true. Economic stability does not guarantee sporting success.
For example, the men’s USA team still struggles to reach the Round of 16 after 40 years of investment, hosting the 1994 FIFA World Cup, and the MLS.
Adequate GDP per capita and strong sports culture does not guarantee success either. Mexico has a GDP per capita of ~ $13,360 and a bustling soccer scene. South Africa has a GDP per capita of $6,500 and a thriving cricket culture. Neither have won World Cups in these sports.
How much wealth it takes to win international sports.
Economic Trends of Various Sporting Teams (1960-Present)
We look at economies of the top countries who have played cricket, soccer, and achieved Olympic greatness.
Note: These countries also overlap with countries who tend to dominate field hockey, basketball, and ice hockey (except Finland). Baseball dominated countries (Cuba, Puerta Rico, Venezuela) golf & Winter Olympics (less accessible, high-end sports) are out of scope for this study.
Which Socioeconomic metrics do we look at and how were they collected?
We consider the following current socioeconomic stats:
GDP (Gross Domestic Product), population,GDP per capita, and if applicable, percentage of population under poverty, and Global Hunger Index (GHI).
GDP per capita can be skewed if there is high income inequality in the country. Hence, we also look at poverty rates and GHI to gauge a better picture of the population set.
Higher GDP and GDP per capita indicate stronger relative economy. Lower poverty rates and GHI levels reflect improved societal well-being.
Poverty rates are presented according to (1) World Bank’s 2017 data, where the extreme poverty line was defined as $2.15/day. Another poverty line, population under poverty (national) is presented if a nation’s self-defined poverty line is above the World Bank rate.
We source the current statistics from the IMF (International Monetary Fund) and the historical GDP per capita levels from the World Bank. The data is available from after 1960, when the World Bank started collecting this data. This coincides with the post-World War II era, when several nations became independent. World Cups were also beginning to take shape during this time.
Other Notes:
If GHI is not mentioned, that means the country is not analyzed by GHI (These are mostly first world countries that do not have hunger issues)
We combine results for Great Britain (Olympics), United Kingdom (GDP data), and England (1966 FIFA World Cup win, multiple cricket World Cup wins) under the same section.
I’ll use soccer instead of football for the rest of the article.
The sporting achievements listed are not an exhaustive list – just significant achievements spaced out to see trends in GDP.
All the sources we looked at are linked at the bottom of the article for your kind perusal.
Top 12 Richest Test Playing Cricketing Countries by GDP Per Capita
We begin by the 12 Test playing nations, ordered by 2025 GDP per capita.
For some countries, we also look at the GDP per capita at different points in their sporting history.
1. Ireland ($107,240)
Multi-sport nation
What was Ireland’s GDP per capita range at their first major sporting event?$2,516.9 (1974 Five Nations Rugby Union Championship, their first in the modern era, 10th since 1910). Their GDP per capita increased to $61,396.4 by the time they upset Pakistan in the 2007 ODI World Cup.
Ireland’s Current Socioeconomic Stats
GDP: $587.23 Billion
Population: 5.48 Million
GDP Per Capita: $107,240
Population Under Poverty (World Bank): 0.06% (2021)
Population Under Poverty (National): 14% (2021)
2024 Paris Olympic (Total Medals): 7
Most Popular Sports in Ireland: Gaelic Football, Rugby, golf, soccer, cricket
2. Australia ($67,980)
Global Sports Superpower
What was Australia’s GDP per capita at their first major sporting event?$8,252.7 (1978 Women’s ODI Cricket World Cup win)
Australia’s Current Socioeconomic Stats
GDP: $1.88 Trillion
Population: 27.67 Million
GDP Per Capita: $67,980
Population Under Poverty: 0.5% (2018)
2024 Paris Olympic (Total Medals): 53
Most Popular Sports in Australia: Australia Rules Football (AFL), Cricket, Rugby, Soccer, Tennis, Swimming
GDP Per Capita At a Glance
Year
GDP Per Capita
Significance
1963
$1967.2
Netball World Cup Win
1973
$4770.8
Women’s Cricket World Cup (CWC) Final
1975
$7003.8
Men’s CWC Final
1978
$8258.7
Women’s CWC Win
1987
$11651.3
Men’s CWC Win
1999
$20712.7
Men’s CWC Win
2007
$41051.6
3rd Consecutive Men’s ODI WC Win
2014
$62544.1
Women’s T20 WC Win
2023
$64820.9
Men’s CWC Win
3. United Kingdom ($54,280)
Global Sports Superpower
What was England’s GDP per capita at their first major sporting event?$1,987.6 (1966 FIFA World Cup)
UK’s Current Socioeconomic Stats
GDP: $3.73 Trillion
Population: 68.72 Million
GDP Per Capita: $54,280
Population Under Poverty: 0.2% (2021)
Great Britain 2024 Paris Olympic (Total Medals): 65
Most Popular Sports in the UK: Soccer, Cricket, Rugby, Tennis, Golf
GDP Per Capita At a Glance
Year
GDP Per Capita
Significance
1966
$1987.6
FIFA World Cup Win
1973
$3426.3
Women’s CWC Win
1979
$7804.8
Men’s CWC Final
1987
$13118.6
Men’s CWC Final
1992
$20487.2
Men’s CWC Final
2010
$39599
Men’s T20 WC Win
2019
$42662.5
Men’s ODI WC Win
4. New Zealand ($48,230)
Multi-sport nation
What was New Zealand’s GDP per capita at their first major sporting event? $12,330.9 (1987 Rugby World Cup)
NZ’s Current Socioeconomic Stats
GDP: $262.92 Billion
Population: 5.45 Million
GDP Per Capita: $48,230
Population Under Poverty:
2024 Paris Olympic (Total Medals): 20
Most Popular Sports in NZ: Rugby, Cricket, Netball, Soccer, Basketball
People tend to ask how New Zealand always ‘punches’ above their weights and make it to cricket World Cup semi-finals despite a population of 5.45 million?
Because they have the fourth highest GDP per capita and have most of the population above the poverty/GHI line, so individuals can focus on other worldly needs like sports.
GDP Per Capita At a Glance
Year
GDP Per Capita
Significance
1967
$2208.4
Netball WC Win
1987
$12330.9
RugbyWC Win
2000
$13641.1
Women’s CWC Win
2021
$49624.2
World Test Championship Win
5. West Indies ($19,823)
Multi-sport nation
West Indies teams from the 1975-1983 ODI World Cups, 2004 Champions Trophy, and 2012 & 2016 T20 World Cups included players from Guyana, Barbados, Jamaica, Trinidad & Tobago, and Saint Lucia
What was West Indies nations’ GDP per capita at their first major sporting event? (1975 World Cup)
What was Sri Lanka’s GDP per capita at their first major sporting event? $776.2 (Won the 1996 ODI World Cup)
SL’s Current Socioeconomic Stats
GDP: $74.59 Billion
Population: 22.4 Million
GDP Per Capita: $3,330
Population Under Poverty (World Bank): 0.96% (2019)
Population Under Poverty (National): 14.30% (2019)
Global Hunger Index: 11.3 (2024), 21.7 (2000)
2024 Paris Olympic (Total Medals): 0
Most Popular Sports in South Africa: Cricket, Volleyball, Athletics
GDP Per Capita At a Glance
Year
GDP Per Capita
Significance
1975
$279.8
Invited to CWC
1979
$230.8
Qualified for CWC
1996
$776.2
Won CWC
2007
$1578.6
ODI WC Runners-up
2014
$3971.9
T20 WC Win
8. India ($2,940)
One-Sport Dominant Nation, In-Transit to Become Multi-Sport Nation
What was Afghanistan’s GDP per capita at their first major sporting event?$296 (1983 ODI Cricket World Cup win)
India’s Current Socioeconomic Stats
GDP: $4.27 Trillion
Population: 1.45 Billion
GDP Per Capita: $2,940
Population Under Poverty (World Bank): 12.92 % (2021)
Global Hunger Index: 27.3 (2024), 38.4 (2000)
2024 Paris Olympic (Total Medals): 6
Most Popular Sports in India: Cricket, Field Hockey, Badminton, Kabaddi, Wrestling
GDP Per Capita At a Glance
Year
GDP Per Capita
Significance
1975
$161.1
Field Hockey WC Win
1983
$296
CWC Win
2003
$544.1
CWC Runners-Up
2007
$1021.9
T20 WC Win
2011
$1445.5
ODI WC Win
2024
$2700
T20 WC Win
(current USD $)
1983: $296
2003: $544.1
2007: $1021.9
2011: $1445.5
2013: $1432.8
2023: $2480.8
9. Bangladesh ($2,770)
One-Sport Dominant Nation
What was Bangladesh’s GDP per capita at their first major sporting event? $397.3 (Won the 1997 ICC Trophy and qualified for the 1999 ODI Cricket World Cup)
Bangladesh’s Current Socioeconomic Stats
GDP: $481.86 Billion
Population: 173.74 Million
GDP Per Capita: $2,770
Population Under Poverty (World Bank): 5.01% (2022)
Population Under Poverty (National): 18.7% (2022)
Global Hunger Index: 19.4 (2024), 33.8 (2000)
2024 Paris Olympic (Total Medals): 0
Most Popular Sports in Bangladesh: Cricket, Soccer, Kabaddi, Badminton
GDP Per Capita At a Glance
Year
GDP Per Capita
Significance
1997
$379.3
ICC Trophy Win
1999
$388
Qualified for CWC
2015
$1224.4
ODI WC Quarterfinals
10. Zimbabwe ($2,130)
One-Sport Dominant Nation
What was Zimbabwe’s GDP per capita at their first major sporting event? $716.8 (1975 Cricket World Cup – Had Kapil Dev not scored that 175*, we may be playing the ZPL)
Zimbabwe’s Current Socioeconomic Stats
GDP: $36.93 Billion
Population: 17.36 Million
GDP Per Capita: $2,130
Population Under Poverty (World Bank): 39.75% (2019)
Population Under Poverty (National): 38.30% (2019)
Global Hunger Index: 27.6 (2024), 35.3 (2000)
2024 Paris Olympic (Total Medals): 0
Most Popular Sports in Zimbabwe: Cricket, Soccer, Rugby, Athletics
GDP Per Capita At a Glance
Year
GDP Per Capita
Significance
1982
$1095.3
ICC Trophy Win, Qualified for 1983 WC
1995
$648
Hosted All-Africa Games
1999
$582
Best WC Show, 5 Wins
11. Pakistan ($1,590)
One-Sport Dominant Nation
What was Pakistan’s GDP per capita at their first major sporting event? $395.7 (1992 ODI Cricket World Cup Win)
Pakistan’s Current Socioeconomic Stats
GDP: $374.6 Billion
Population: 240.54 Million
GDP Per Capita: $1,590
Population Under Poverty (World Bank): 4.93% (2018)
Population Under Poverty (National): 21.9% (2018)
Global Hunger Index: 27.9 (2024), 36.6 (2000)
2024 Paris Olympic (Total Medals): 1
Most Popular Sports in Pakistan: Cricket, Field Hockey, Squash, Badminton
GDP Per Capita At a Glance
Year
GDP Per Capita
Significance
1960
$82
Field Hockey Olympic Gold
1979
$249.2
First CWC Semi-Finals
1992
$395.7
WC Win
1999
$418.2
WC Runners-Up
2009
$963.8
T20 WC Win
2017
$1519.2
Champions Trophy Win
2022
$1538.3
T20 WC Runners-up
12. Afghanistan ($410.93)
One-Sport Dominant Nation
What was Afghanistan’s GDP per capita at their first major sporting event?$560.6 (2010 – ICC Intercontinental Cup, ICC World T20 Qualifier Winners, qualify for 2010 T20 World Cup)
Afghanistan Current Socioeconomic Stats
GDP: $17.33 billion
Population: 42.17 Million
GDP Per Capita: $410.93
Population Under Poverty (World Bank): 34.9% (2023)
Population Under Poverty (National): 54.9% (2023)
Global Hunger Index: 30.8 (2024), 49.6 (2000)
2024 Paris Olympic (Total Medals): 0
Afghanistan’s Most Popular Sports: Cricket, Buzkashi
Since 1960, only the following countries have won the FIFA World Cup: Brazil, England, (West) Germany, Argentina, Italy, France, and Spain (Uruguay, Hungary, and Czechoslovakia are not considered here).
We will also explore Croatia, Portugal, and the Netherlands, who have been competitive.
1. Netherlands ($70,610)
Multi-Sport Nation
What was Netherland’s GDP per capita at their first major sporting event? $6,454.5 (1974 Finalists)
Current Socioeconomic Stats
GDP: $1.27 Billion
Population: 18.03 Million
GDP Per Capita: $70,610
Population Under Poverty (WB): 0.07% (2021)
Population Under Poverty (National): 14.5% (2021)
2024 Paris Olympic (Total Medals): 34
Most Popular Sports in Netherlands: Soccer, Cycling, Field Hockey
GDP Per Capita At a Glance
Year
GDP Per Capita
Significance
1974
$6450.5
FIFA World Cup (WC) Runners-up
1978
$11195.8
WC Runners-Up
2010
$51305.7
WC Runners-Up
2014
$53457.2
3rd Place
2. Germany ($57,910)
Global Sports Superpower
What was Germany’s GDP per capita at their first major sporting event? $1,162.1 (1960 – West Germany won the 1954 FIFA WC), $5,659.7 (1974)
Current Socioeconomic Stats
GDP: 4.92 Trillion
Population: 84.98 Million
GDP Per Capita: $57,910
Population Under Poverty (World Bank): 0.24% (2020)
Population Under Poverty (National): 16% (2020)
2024 Paris Olympic (Total Medals): 33
Most Popular Sports in Germany: Soccer, Tennis, Basketball, Handball
GDP Per Capita At a Glance
Year
GDP Per Capita
Significance
1966
$1870.8
FIFA WC Runners-Up
1974
$5659.7
WC Winners
1990
$22385.7
WC Winners
2003
$30711.1
Women’s FIFA WC Win
2008
$46386.3
Men’s Field Hockey Gold
2014
$48971.1
WC Winners
3. France ($49,530)
Global Sports Superpower
What was France’s GDP per capita at their first major sporting event? $9,311.9 (1984 Euro)
Current Socioeconomic Stats
GDP: $3.28 Trillion
Population: 66.3 Million
GDP Per Capita: $49,530
Population Under Poverty (World Bank): 0.06% (2021)
Population Under Poverty (National): 15.60% (2021)
2024 Paris Olympic (Total Medals): 64
Most Popular Sports in France: Soccer, Tennis, Rugby, Handball, Basketball
GDP Per Capita At a Glance
Year
GDP Per Capita
Significance
1986
$13430.5
FIFA WC 3rd Place
1995
$26791.8
Men’s Handball WC Win
1998
$24869.4
FIFA WC Win
2006
$36431.6
WC Runners-Up
2018
$41418.2
WC Winners
4. Italy ($41,710)
Multi-sports Nation
What was Italy’s GDP per capita at their first major sporting event? $1,718.5 (1968 UEFA Euro)
Current Socioeconomic Stats
GDP: $2.46 Trillion
Population: 58.96 Million
GDP Per Capita: $41,710
Population Under Poverty (World Bank): 0.81% (2021)
Population Under Poverty (National): 20.10% (2021)
2024 Paris Olympic (Total Medals): 40
Most Popular Sports in Italy: Soccer, Cycling, Tennis, Basketball, Volleyball, Formula 1
GDP Per Capita At a Glance
Year
GDP Per Capita
Significance
1970
$2111.7
FIFA WC Runners-up
1982
$7573.9
WC Win
1994
$19382.2
WC Runners-Up
2006
$33684.7
WC Win
2020
$32091.5
Euro Winners
5. Spain ($37,360)
Multi-sports Nation
What was Spain’s GDP per capita at their first major sporting event? $695 (1984 Euro)
Current Socioeconomic Stats
GDP: 1.83 Trillion
Population: 48.92 Million
GDP Per Capita: $37,360
Population Under Poverty (WB): 0.56%
Population Under Poverty (National): 20.4%
2024 Paris Olympic (Total Medals): 18
Most Popular Sports in Spain: Soccer, Basketball, Tennis, Cycling, Water Sports
GDP Per Capita At a Glance
Year
GDP Per Capita
Significance
1964
$695
Euro Win
1982
$5156
Hosted the FIFA WC
2005
$26451
Men’s Handball WC Win
2008
$35603.2
Euro Win
2010
$30658.7
WC Win
6. Portugal ($30,950)
One-Sport Dominant Nation
What was Portugal’s GDP per capita at their first major sporting event? $18,064.2 (2004 Euro Finalists)
Current Socioeconomic Stats
GDP: $319.93
Population: 10.34 Million
GDP Per Capita: $30,950
Population Under Poverty (WB): 0.23% (2021)
Population Under Poverty (National): 16.40% (2021)
2024 Paris Olympic (Total Medals): 4
Most Popular Sports in Portugal: Soccer, Futsal, Cycling
GDP Per Capita At a Glance
Year
GDP Per Capita
Significance
1966
$601.3
FIFA WC 3rd Place
2000
$11526.4
Futsal WC 3rd Place
2006
$19839.5
WC 4th Place
2016
$19980.3
Euro Win
7. Croatia ($25,080)
One-Sport Dominant Nation
What was Croatia’s GDP per capita at their first major sporting event? $5,712.6 (1998 FIFA WC Semi-Finals)
Current Socioeconomic Stats
GDP: $96.03 Billion
Population: 3.83 Million
GDP Per Capita: $25,080
Population Under Poverty (WB): 0.31% (2021)
Population Under Poverty (National): 18% (2021)
Global Hunger Index: < 5 (2024), 5.5 (2000)
2024 Paris Olympic (Total Medals): 7
Most Popular Sports in Croatia: Soccer, Basketball, Handball, Water Polo
Year
GDP Per Capita
Significance
1998
$5712.6
FIFA WC 3rd Place
2018
$15460.4
WC Runners-Up
2022
$18466.1
WC 3rd Place
8. Argentina ($12,050)
One-Sport Dominant Nation
What was Argentina’s GDP per capita at their first major sporting event? $3282.1
Current Socioeconomic Stats
GDP: $574.2 Billion
Population: 47.64 Million
GDP Per Capita: $12,050
Population Under Poverty (World Bank): 0.61% (2022)
Population Under Poverty (National): 39.20% (2022)
Global Hunger Index: 6.6 (2024), 6.6 (2000)
2024 Paris Olympic (Total Medals): 3
Most Popular Sports in Argentina: Soccer, Polo, Field Hockey
GDP Per Capita At a Glance
Year
GDP Per Capita
Significance
1978
$3282.1
FIFA WC Win
1986
$3436.1
WC Win
2014
$12233.1
WC Runners-Up
2022
$13935.7
WC Win
9. Brazil ($10,820)
One-Sport Dominant Nation. In-Transit to Become a Multi-Sports Nation
What was Brazil’s GDP per capita at their first major sporting event? $235.3 (1958 & 1962 FIFA World Cups)
Current Socioeconomic Stats
GDP: $2.31 Trillion
Population: 213.32 Million
GDP Per Capita: $10,820
Population Under Poverty: 3.5% (2022)
Global Hunger Index: 6.6 (2024), 11.7 (2020)
2024 Paris Olympic (Total Medals): 20
Most Popular Sports in Brazil: Soccer, Volleyball, Basketball, Martial Arts, Futsal
The combined Summer/Winter Olympics tally leaderboard are as follows: United States (3095 medals), Soviet Union (1204), Great Britain (1014), France (961), Germany (960), China (804), Italy (799), Sweden (690), Australia (619), Japan (618), Canada (578), Norway (576), Russia (542), Hungary (540), etc. These countries also happen to be the most developed countries.
On the other end of the spectrum, the following countries only have 1 Olympic medal: Guyana, Iraq, Senegal, Barbados, Paraguay, Sudan, Virgin Islands, Netherlands Antilles, Gabon, Togo, Burkina Faso, Mauritius, Samoa, Tonga, Djibouti, Cape Verde, Dominica, Turkmenistan, Eritrea, Montenegro. You get the point.
Burkina Faso would send its first Olympian in the 1972 Munich Olympics, when its GDP per capita was $99.6. In 1988, they sent 6 athletes ($301.1). When Djibouti won its bronze in 1988, it had a GDP per capita of $878.9.
1. USA ($89,680)
Global Sports Superpower
Current Socioeconomic Stats
GDP: $30.3 Trillion
Population: $338.29 Milllion
GDP Per Capita: $89,680
Population Under Poverty: 1.25% (2022)
2024 Paris Olympic (Total Medals): 126
Most Popular Sports in USA: American Football, Basketball, Baseball, Ice Hockey, Golf, Track and Fields, Tennis, Soccer
GDP Per Capita At a Glance
Year
GDP Per Capita
Significance
1960
$2999.9
71 Olympic Medals
1984
$17121.2
174 Medals
1991
$24342.3
Women’s WC Win
2002
$37997.7
Men’s WC Reaches its first Quarter Finals
2019
$65604.7
Women’s 4th WC Win
2. China ($13,870)
Global Sports Superpower
Current Socioeconomic Stats
GDP: $19.53 Trillion
Population: 1.41 Billion
GDP Per Capita: $13,870
Population Under Poverty: 0% (2021)
Global Hunger Index: < 5 (2024), 13.4 (2000)
China’s Global Hunger Index Trends
Year
GHI
Olympic Medals
2000
13.4
58
2008
7.2
100
2016
< 5
70
2024
< 5
91
2024 Paris Olympic (Total Medals): 91
Most Popular Sports in China: Table Tennis, Badminton, Swimming, Martial Arts, Basketball
GDP Per Capita At a Glance
Year
GDP Per Capita
Significance
1984
$250.7
32 Olympic Medals
2000
$959.4
58 Medals
2008
$3468.3
100 Medals, Hosted Olympics
2022
$10408.7
15 Medals at Winter Olympics (China’s Best Show)
3. Japan ($35,610)
Global Sports Superpower
Current Socioeconomic Stats
GDP: $4.39 Trillion
Population: 123.26 Million
GDP Per Capita: $35,610
Population Under Poverty: 0.73% (2013)
2024 Paris Olympic (Total Medals): 45
Most Popular Sports in Japan: Baseball, Sumo Wrestling, Soccer, Martial Arts
GDP Per Capita At a Glance
Year
GDP Per Capita
Significance
1960
$508.7
18 Medals
1982
$9780
Baseball World Cup Runners-up
2006
$35991.5
World Baseball Classic Win
2011
$48760.1
Women’s WC Win
2020
$40040.8
58 Medals, Hosted Olympics
4. Republic of Korea ($37,670)
Global Sports Superpower
*South Korea
Current Socioeconomic Stats
GDP: $1.95 Trillion
Population: 51.68 Million
GDP Per Capita: $37,670
Population Under Poverty: 0% (2021)
2024 Paris Olympic (Total Medals): 32
Most Popular Sports in South Korea: Soccer, Baseball, Archery, Golf, Taekwondo
GDP Per Capita At a Glance
Year
GDP Per Capita
Significance
1982
$1992.5
Baseball World Cup Win
1988
$4748.6
Hosted Olympics, 33 Medals
2002
$13165.1
FIFA WC 4th Place
2005
$19402.5
Baseball WC Runners-up
5. Canada ($55,890)
Global Sports Superpower
Current Socioeconomic Stats
GDP: $2.33 Trillion
Population: 41.7 Million
GDP Per Capita: $55,890
Population Under Poverty: 0.25% (2019)
2024 Paris Olympic (Total Medals): 27
Most Popular Sports in Canada: Ice Hockey, Lacrosse, Soccer, Basketball, Baseball, Athletics
GDP Per Capita At a Glance
Year
GDP Per Capita
Significance
1976
$8838.9
Hosted Summer Olympics, 11 Medals
1984
$13930.5
44 Medals, Canada’s Best Show
2002
$24256
Ice Hockey Olympic Gold
2010
$47560.7
Hosted Winter Olympic Medal, 26 Medals
2015
$43594.2
Hosted Women’s FIFA WC
6. Russia/USSR ($15,080)
Global Sports Superpower
Current Socioeconomic Stats
GDP: $2.2 Trillion
Population: 145.63 Million
GDP Per Capita: $15,080
Population Under Poverty (WB): 0.18% (2021)
Population Under Poverty (National): 12.10% (2010)
2020 Tokyo Olympic as ROC (Total Medals): 71
Most Popular Sports in Russia: Soccer, Ice Hockey, Gymnastics, Figure Skating
GDP Per Capita At a Glance
Year
GDP Per Capita
Significance
1990 (USSR)
~$9200
USSR Dissolves
1996 (Russia)
$2643.9
Russia Re-enters the Olympics, 89 Medals
2016
$8663.2
56 Medals
Final Thoughts and Future Work
In the future, it would be interesting to analyze countries that dominate less accessible sports like golf or sports in the Winter Olympics. Also nations like Sweden, Norway, Belgium, Uruguay, Czech Republic, Hungary, and Mexico were out of scope for this study, but would be interesting to look at in the future.
Another way to go is to look at the understood how America’s economy is able to support multiple flourishing sports league (NFL, College Football, College Basketball (Men’s/Women’s), NBA, MLS, etc.)
Also, why aren’t Ireland better at cricket? I was surprised to see that they are financially a lot more stable than other nations. The next step would be to look at social policies and government investments to study how countries can start winning consistently at an international stage after they have satisfied the bare minimum economic conditions.
In any case, thank you all for reading. Appreciate y’all! Comment below on what you think!
And please, share, subscribe to our social media channels (X, Facebook) and other platforms (Substack, Medium)
Four years ago I was really excited when the idea of the World Test Championship came out. I mean, it was partially a reason for me to start this blog.
However, with the recent overseas wins of NZ in India, SA in Bangladesh, and Bangladesh in Pakistan—that hope has rekindled.
Therefore, this is a good time for us to revisit the WTC alternative points table algorithm my friend and I had created four years ago to create a more balanced system. For this WTC cycle, I analyzed each of the 51 Test matches and 578 completed sessions one-by-one so you don’t have to.
Before we start, he is a quick refresher on how our alternative points table worked.
Our WTC points table algorithm (1) distributes points on a session-by-session basis rather than an all-or-nothing system for a Test match, (2) includes Home/Away points for both wins & draws, and (3) includes a bonus to reward massive victories (Test match net run rate equivalent).
Points are calculated as follows:
2 points per session won, 1 point per session Tied
There are 15 maximum sessions in a Test (3 sessions per day), so 30 points maximum per Test for the session-by-session category
The details of the algorithm used to decide who won each session is outlined in the original article and is left as an exercise to the reader.
Bonus: 2 * (Number of Sessions Remaining)
Example: If the Test finishes at the end of Day 4, the winning team would get 6 bonus points – (2 * (3 sessions remaining))
Home/Away
Away wins and away draws would be awarded more points.
16 – Home Win, 8 – Home Draw
24 – Away Win, 12 – Away Draw
The maximum points a team could earn per Test is outlined below (Example: 24 – away win points + 30 session points = 54 total if the team won all the sessions).
Points
Win
Draw
Loss
Maximum Points Possible (Per Match)
Home
16
8
0
46
Away
24
12
0
54
Average*
20
10
0
50
Home & Away Points
Finally, since each team plays a different number of matches, we will take a percentage determined by (total points earned)/(maximum points possible*).
The maximum points possible will be determined by (number of matches played * 50), where we choose 50 because it is the average between 46 & 54 and would hence, weight away wins & draws more.
I coded this algorithm in R & Python and double checked the calculations by hand for the session-by-session analysis.
🇦🇺 BEAT 🏴 by 2 wickets, Birmingham 🇦🇺 BEAT 🏴 by 43 runs, Lord’s 🇮🇳 BEAT 🌴 by inn & 141 runs, Roseau 🇵🇰 BEAT 🇱🇰 by 4 wickets, Galle 🇵🇰 BEAT 🇱🇰 by inn & 222 runs, SSC 🇳🇿 BEAT 🇧🇩 by 4 wickets, Mirpur 🇮🇳 BEAT 🇿🇦 by 7 wickets, Cape Town 🌴 BEAT 🇦🇺 by 8 runs, Brisbane 🏴 BEAT 🇮🇳… pic.twitter.com/b55YlIHHzZ
— Broken Cricket Dreams Cricket Blog (@cricket_broken) November 10, 2024
Key Takeaways
45% (23/51) WTC matches in this cycle so far have been won by away teams.
England (79) & India (76) won the most sessions so far, while Australia (47) have tied the most sessions. West Indies (24) & Bangladesh (29) have had the least session wins in this cycle of the WTC so far
We have had a spectacular run of dramatic overseas victories. Each team has had at least one overseas win:
South Africa 1-0 in West Indies & 2-0 in Bangladesh
Australia won 2 Tests each in England & New Zealand
Bangladesh won in Pakistan 2-0
Pakistan won 2-0 in Sri Lanka
Sri Lanka won 2-0 in Bangladesh and a Test in England
England won one Test each in India & Pakistan
The India vs South Africa Test at Cape Town was the shortest Test ever, lasting only 5 sessions.
South Africa won all 9 out of 9 sessions in the recent 2nd Test vs Bangladesh and received the maximum possible 54 points for the Test in our points system.
WTC 2023-2025 Alternative Points Table – Results
Here is our alternative WTC 2023-25 points table at a glance.
Team
Total Points
AverageMax Points Possible*
BCD Percentage
Actual WTC Percentage
Australia
379
600
63.17%
62.50%
India
410
700
58.60%
58.33%
South Africa
233
400
58.25%
54.17%
Sri Lanka
239
450
53.11%
55.56%
New Zealand
277
550
50.36%
54.55%
England
411
950
43.26%
40.79%
Pakistan
206
500
41.2%
33.33%
Bangladesh
162
500
32.4%
27.50%
West Indies
122
450
27.11%
18.52%
*Note: We have added the same over-rate deductions as the current WTC table does (19 for England, 10 – Australia, 8 – Pakistan, 3 – Bangladesh 2 – India)
Observations
Our points table heavily rewards South Africa, who have dominated 3 overseas Tests (1 vs WI, 2 vs Bangladesh).
Sri Lanka are close by with 3 overseas Tests wins as well (2 vs Bangladesh, 1 vs England) but they lost points to Pakistan at home. Similarly, NZ had a good show vs Bangladesh & India away, but lost convincingly 0-2 against Australia (home) & Sri Lanka (away)
The interesting point our points table highlights is showcasing how close a Test match or Test series was. For example, the 2-2 Ashes translates into 132-118 in favor of Australia (due to overseas wins and draw).
In addition, no two Test series are alike.
The Pakistan-Bangladesh 2-Test series (where Pakistan batted well initially and even declared) resulted in 84-24 points in favor of Bangladesh. This series was closer than the SA-Ban series (101-7 in favor of SA), where SA completely decimated Bangladesh.
Appendix: WTC 2023-25 Match By Match Break Down
If you want to look at the particular series or team, here is a table of content organized by home team for easier access:
That got me thinking—How expensive is it to watch cricket around the world?
To conduct this analysis, I went through the checkout process and attempted to buy tickets for different types of matches in the first 10 Test playing nations.
If you would like to listen to an engaging conversational AI generated podcast about this article, check this out.
Key Takeaways
England & Australia are the most expensive places to watch cricket (they also have the most opportunities to watch along with India). Ticket prices can range from $185-1400 in a season for England to watch a couple of days of Tests, a few County matches, a few Hundred & Vitality Blast games, and 2-3 limited over internationals.
On the other hand, in Bangladesh, Sri Lanka, and Zimbabwe, a fan can watch matches for as low as $1 USD and can watch several games in a season for about $100 on the higher end.
Watching domestic cricket is completely FREE in India, New Zealand, and South Africa (both List A & 4-day). All you need to do is show up at the stadium (So GO, what are you waiting for?)
Cost of Watching Cricket: Most Expensive Places to Watch Cricket Around the World
We will provide ranges and consider a few different categories (if data is available):
Limited Over Internationals (LOI) – both men’s & women’s
Test Matches
Domestic Competitions
Franchise Leagues
For the sake of the cost comparison, we will be looking at General Admission ticket for Adult guests (in some countries like England, ‘members’ of the club receive discounted prices given that they have paid the annual membership fee). This analysis does not include member prices, bundles, or other discounts (or service/handling fees & taxes).
Note: These are ballpark ranges. Ticket prices may vary based on the match (for example, knockout and Finals matches may be more expensive) and the stadium.
If a spectator in England watched 2 days of a men’s Test, 5 County games, 1 men’s international, 2 Vitality Blast matches, 2 Hundred matches, 1 ODI cup, one women’s international, and 1 Women’s Hundred match in a season, they would spend (on tickets alone) between $260-$504 depending on the stadium and up to $1393.3 if they only chose premium seating.
Monthly Cost of Living: $1929
Average Monthly Net Salary: $3288.55
Annual Inflation Rate: 2.5%
Estimated Monthly Savings: $1359.55
Percent of Savings Spent on Cricket (Live): 4.54%-34.16%
*These economic numbers are for the United Kingdom as a whole, not just England.
Type of Match
General Admission Ticket Price (Adult)
Premium Tickets
A Day of a Test
£38-85 ($50.6-113.1)
£95-145 ($126.6-192.9)
Men’s LOI
£20-40 ($26.6)
£135 ($179.9)
Women’s LOI
£5-10 ($6.7-13.3)
£65 ($86.6)
County
£6-15 ($8.0-20.0)
£23 ($30.6)
Vitality Blast
£15-25 ($20-33.3)
£150 ($199.5)
The Hundred
£11 ($14.7)
£35 ($46.6)
One Day Cup
£5-20 ($6.7-26.6)
£37 ($49.2)
*These are ticket prices for non-members
How Did We Estimate the Ticket Price Range?
The international costs above are estimated from the upcoming England-Zimbabwe Test, India-England Women T20I series, and the men’s South Africa-England series, while the domestic costs are a ballpark number based on perusing several County’s websites.
Note: The prices for domestic price tickets in England vary vastly based on the County/stadium. For example, Kia Oval is at the more expensive side: £15-20 for County Championship matches, £32-40 for Vitality Blast, £40-85 for a men’s T20I, £18-30 for a women’s T20I, and £85-145 for a Test match.
Other Costs: Car Parking (£5+), Guided Tours: (£0-30), Full Season Membership (£240-270), Food, Drinks, Concessions (varies)
Where To Buy Tickets: Tickets can be purchased on the County, stadium, or ECB website. For international matches, you have to enter a ballot and hence, may not be guaranteed a ticket if there is high demand.
If a cricket fan in Australia went to watch 2 days of a men’s Test, 1 ODI, 1 Sheffield Shield match, 2 BBL matches, one women’s international, and 1 WBBL match in a season, they would spend (on tickets alone) at least $180 AUD ($122.6 USD)and as much as $900 $(613 USD) if they chose the premium seating.
Monthly Cost of Living: $1,944
Average Monthly Net Salary: $3,819.73
Annual Inflation Rate: 3.5%
Estimated Monthly Savings: $1875.73
Percent of Savings Spent on Cricket (Live):2.2%-10.89%
Day 4 Tickets: For the Boxing Day Test MCG, the General Admission has a starting price for $30 with reserve stands as high as $85.
Type of Match
General Admission Ticket Price (Adult)
Premium Tickets/Lounge/SkyDeck
A Day of a Test
$30 AUD ($20.4 USD)
$170 AUD ($115.8 USD)
Men’s LOI
$30 ($20.4)
$170 ($115.8)
Women’s LOI
$20 ($13.6)
Domestic Cricket
$10 ($6.8)
Franchise Cricket(BBL)
$27.5 ($18.7)
$165 ($112.4)
WBBL
$10 ($6.8)
*Note: For some Tests (for example, Adelaide BGT, there are ‘Twilight Adult’ prices if the entry is after 5 PM at a discounted price of $22.5).
Watching 2 days of a Test, 2 SuperSmash matches, a men’s limited overs game, and a women’s limited over game can cost anywhere between $109 to $160 in a season.
Monthly Cost of Living: $1782
Average Monthly Net Salary: $3156.96
Annual Inflation Rate: 3.1%
Estimated Monthly Savings: $1,374.96
Percent of Savings Spent on Cricket (Live):1.96%-2.81%
Type of Match
General Admission Ticket Price (Adult)
Premium Tickets
A Day of a Test
$45 NZD ($28 US)
$70 NZD ($43.6)
Men’s LOI
$35 ($21.8)
$65 ($40.5)
Women’s LOI
$20 ($12.5)
Domestic Cricket
FREE
SuperSmash
$15 ($9.4)
*Note: A Test Match Pass (all 5 days) can be purchased, which ranges from $145-220 NZD.
Entry to Plunkett Shield (first class) and Ford Trophy (List A) are free.
Two days of a men’s Test, 1 Men’s ODI, 1 Women’s ODI, and 2 SA20 matches in Bangladesh would cost a spectator somewhere in the range of $44-89 in one season.
Monthly Cost of Living: $974
Average Monthly Net Salary: $1446.04
Annual Inflation Rate: 4.9%
Estimated Monthly Savings: $472.04
Percent of Savings Spent on Cricket (Live):3.1%-6.3%
In India, watching 2 days of a men’s Test, 1 ODI, 2 IPL matches, 1 women’s international, and 1 WPL match in a season, would cost (on tickets alone) between $30-140 on the lower end and about $294 on the higher end over a season. Keep in my end, that or certain IPL teams like RCB, tickets can go as high as $634 alone!
Monthly Cost of Living: $423
Average Monthly Net Salary: $633.49
Annual Inflation Rate: 4.6%
Estimated Monthly Savings: $210.49
Percent of Savings Spent on Cricket (Live): 14.25%+
*This is a bit skewed since population of India has widespread economic disparity. Those who can probably afford to purchase tickets are the only ones that would purchase those premium/VIP tickets.
Type of Match
General Admission Ticket Price (Adult)
Premium/VIP
A Day of a Test
INR 125-200 ($1.5-2.4)
INR 1000-2000 ($12-24)
LOI
INR 750 ($9)
INR 10000 ($119.8)
Women’s International
FREE*
INR 150 ($1.8)
Domestic Cricket
FREE
IPL
INR 700-5000 ($8.4-60)
INR 5000-52938 ($59.9-$634.4)
WPL
INR 100-500 ($1.2-6)
As per Hindustan Times, “Pricing is decided as per demand and supply, affordability, culture, and the eagerness of the people to pay” when it comes to IPL prices. Hence, there is a wide range in IPL tickets depends on which player/teams are playing and when the ticket has been purchased.
Here are some other notes:
Non-international matches are free to attend.
*The entry to women’s Test between India & South Africa was free, while the T20Is were priced for INR 150.
Long story short, watching sports can be a fun and expensive experience.
Final Thoughts
The main thought of writing this article was to answer the question, “Is cricket affordable for the common man?”
With rising cost of living standards around the world and mobile/TV accessibility of cricket, are boards doing enough to incentivize followers to go to the ground?
In general, cricket is not as expensive as other sports. However, if Test cricket is to survive, £95 Day 4 tickets is probably not going to help.
If the trend continues, cricket will become only an elitist game. It began as an elitist game, but do we want to keep it that way?
If you are interested in cricket & finance, consider checking out the following:
Umpires bringing out their light meters out is a common sight in England’s overcast conditions.
We cannot control the weather. So, how can we fix this?
Several proposals have come up over the years: Better Drainage systems (see Sri Lanka), pink ball all the time (especially England), and earlier starts in the day for late-summer months.
All are good ideas, but let’s consider another idea that has been vaguely mentioned—A covered or ‘retractable’ stadium.
Remember that one stadium where the Shahid Afridi hit 12 runs in one ball? Yep, that’s the one.
Key Takeaways
In one of our previous analysis, “How Much Money Does It Take to Host a Test Match?,” we estimated that it takes about $350,000-$1.4 million per 5-day Test depending on the technology used i.e. about $70,000-$280,000 per day of cricket.
It takes about $100-$150 million to add a retractable roof in a stadium (although in some cases the expenses ballooned up to $300 million). For maintenance & repairs, a future budget between $20-30 million needs to be kept aside.
It would take about 357-4,286 days of rain affected matches for the cost of the retractable roof to recover*
In England’s 2024 home season (men’s), six days were rain-affected, one of which was washed out and 5 others were affected by bad light. In 2023, 9 Tests & 5 ODIs were impacted by rain, five of which were no results or complete wash outs. At least 2-5 Hundred matches were marred by rain as well.
The 2024 T20 World Cup had 8 rain-affected games with four abandonments, while the 2019 ODI WC in England had 3 washouts, 4 reduced matches, and one two-day semi-final contest.
*If the roof is only used for international cricket and no other sport
The NFL cannot afford to lose millions of advertising dollars due to weather or unnecessary delays, so they are more inclined to pick stadiums with a covered roof.
Rick Schlesigner, the CEO of Brewers said that he is “very pleased with the roof.” As of 2018, the roof had been used 4,014 times and had “delivered its promise to fans.”
What About Maintenance?
Building the stadium is only a part of the equation, recurring repair & maintenance costs is the other. Brewers’ have estimated that future repairs, maintenance, ironworkers, engineers, roofers will cost about $37.1 million.
Building NFL stadiums is already a costly endeavor. According to Constructive Dive, the overall construction cost for the SoFi Stadium in Los Angeles cost a record $5.5 billion (most expensive stadium ever built), Mercedes-Benz Stadium in Atlanta was about $1.5 billion, and the U.S. Bank Stadium in Minneapolis was about $1.2 billion.
Similar, the owner of the MLB team, New York Mets, estimated that it would take them $800 million to add a retractable roof, while it would have only costed $125 million if it were to be installed during construction.
Here are a few examples of stadiums from different sports and how much their construction cost for a covered stadium. This is not an exhaustive list by any means.
Although cricket was a pioneer in adopting technologies like Hawkeye, it is way behind in architectural investment and innovation.
Archibald Stadium – Carrier Dome ($26.85 Million)
Sport: College Football
Location: Syracuse, New York
Capacity: 40,000
In 1980, Carrier Dome at Syracuse University was one of the first covered domes and the largest collegiate dome. It cost about $27 million back then. The dome was later renovated in 2021 for $118 million.
Huntington Bank Field, Cleveland Browns ($2.4 Billion – Proposed)
Sport: NFL
Location: Cleveland, Ohio
Capacity: 70,000
The proposed $2.4 billion investment for the dome would be split between public and private financing, making the $1.2 billion allocated for private investment as the largest private per capita stadium investment in the country.
This stadium will utilize ethylene tetrafluoroethylene (ETFE), essentially a plastic-see through roof. This is based of other stadiums that have used ETFE like the Allianz Arena in Munich, Dunedin’s Forsyth Barr Rugby stadium (cost around $200 million overall), Las Vegas bowl, and Bejing.
The ‘Big O’ Montreal Stadium ($875 Million – Proposed)
Sport: Olympics Stadium
Location: Montreal, Canada
Capacity: 73,000
*Note: The 1976 Olympic stadium is getting a makeover with the roof itself costing $875 million. The replacement roof will not be retractable, but will be translucent to allow for sunlight.
In most cases, the city that hosts the stadium is responsible for paying for any stadium, construction, and repair costs.
Influx of private partnership is helping alleviate some of the costs that the local government gets burdened with.
Due to the complex funding structure, the planning and construction process can go through political interference, red tape, delays, and budget overruns.
How Will A Retractable Stadium in Cricket Impact Playing Conditions?
Playing conditions play a major role in cricket.
Will the amount of swing decrease in England? Do we want natural elements to go out of the game?
To find out how much money cricket lost to rain, we first figured out how many days were affected by rain.
We will consider the last three home seasons for the England’s men’s team as well the last few ICC tournaments.
England Home Season (Men’s)
*Note: W/O denotes complete wash out. N/R denotes No Result
2024 Season
Rain Affected/Wet Outfield
Bad Light
3rd T20I v Pak (W/O) 3rd Test v WI, Day 2 1st Test vs SL, Day 2 1st Test vs SL, Day 3 3rd Test vs SL, Day 3
1st Test vs WI, Day 1 1st Test vs SL, Day 1 2nd Test vs SL, Day 3 3rd Test vs SL, Day 1 Day 2 Day 3
2023 Season
Rain Affected/Wet Outfield
Ashes 1st Test, Day 3 1st Test, Day 5 2nd Test, Day 1 2nd Test, Day 3 3rd Test, Day 3 4th Test, Day 4 4th Test, Day 5 (W/O) 5th Test, Day 4 5th Test, Day 5 Ire v Ban, 1st ODI (N/R) Ire v Ban, 2nd ODI(45-over ODI) Ire v Eng, 1st ODI (W/O) Ire v Eng, 3rd ODI (N/R) NZ v Eng, 2nd ODI (34-over ODI)
*Note: Not many matches were affected by Bad Light in 2023, most of the interruptions were all rain/wet outfield related.
2022 Season
Rain Affected/Wet Outfield
Bad Light
1st Test* v Ind, Day 2 Day 3 Day 5 (W/O) 2nd Test* v Ind, Day 1 5th Test v Ind, Day 1 Day 2 Day 3 1st Test v NZ, Day 3 2nd Test v NZ, Day 2 3rd Test v NZ, Day 1 Day 3 Day 5 2nd ODI v SA (29-over ODI) 3rd ODI v SA (N/R) 1st Test v SA, Day 1 3rd Test v SA, Day 1 (W/O) Day 2 (W/O)
1st Test v Ind, Day 2 2nd Test v Ind, Day 4 3rd Test v Ind, Day 3 4th Test v Ind, Day 3 3rd Test v SA, Day 3 SA, Day 4
*Note: We exclude these matches from our calculations since the 1st 4 Tests of the Pataudi Trophy were held in 2021
ICC & Other Tournaments
2024 T20 World Cup
2024 (M): Match 6 (N/R), Match 23 (W/O), Match 30 (W/O), Match 33 (W/O), Match 34 (10-over), Match 44 (11.2-over DLS), Match 50 (17-over DLS), Match 52 (19-over DLS)
2023 (W): Match 18 (8.2-over DLS)
ODI World Cup
2023 (M): Match 35 (25.3-Overs DLS)
2022 (W): Match 5 (27-over), Match 20 (20-over), Match 23 (N/R), Aus-WI SF (45-over)
2019 (M): Match 7 (41-over), Match 11 (W/O), Match 16 (W/O), Match 18 (W/O), Match 21 (48-over), Match 22 (40-over DLS), Match 25 (49-over), Ind-NZ SF (2 days)
2017 (W): Match 6 (W/O), Match 21 (24-over DLS), Ind-Aus SF (42-over)
The Hundred
2024 (W): Match 21 (W/O), Match 32 (N/R)
2024 (M): Match 21 (N/R), Match 29 (44-balls), Match 30 (N/R), Match 32 (30-balls)
2023 (W): Match 2 (W/O), Match 3 (W/O), Match 6 (W/O), Match 7 (W/O), Eliminator (N/R)
2023 (M): Match 2 (40-balls), Match 6 (N/R), Match 7 (W/O), Match 11 (NR), Match 18 (90-balls)
2022 (M/W): None
Note: We only consider England’s home season and The Hundred. County Championship, Royal One Day Cup, and the T20 Vitality Blast lose a number of matches.
For a sport that seems to be struggling financially on a larger scale, adding a retractable roof in cricket is, in most cases, a bad idea.
Of course, we cannot build a retractable in every stadium. However, countries that can afford and/or have a dire need may be able to afford this on a case-by-case basis.
For example, the Wankhede, Eden Gardens, or the Narendra Modi Stadium in India, SSC in Sri Lanka, Lord’s in England (in case they host the WTC Final for the next 100 years), and the MCG in Australia for some of the larger occasions.
Richer leagues like the NFL & MLB may help subsidize the cost of ultra-expensive stadiums in the USA. With IPL’s growing wealth, the BCCI may be able to help subsidize these types of stadium enhancements around the world as well. Who knows.
What do you think?
Anyway, retractable roofs in cricket are just one part of the alternative. We will do deep dive into how drainage systems work in cricket and other sports at a different time.
“First problem in solving any problem is recognizing there is one.”
– Will McAvoy, The Newsroom
England cricket is having a mid-life crisis for about a decade now.
Although The Hundred is at the heart of that conversation, we should recognize that the larger issues that plague English cricket are finances and scheduling.
Today, we look at how scheduling has changed for first-class counties over the past 50 years and excavate some patterns.
Let’s dive right in.
Key Takeaways
The Vitality T20 blast is currently at a 133-match season. When it began in 2003 (as the Twenty20 Cup), it was only a 48-match tournament and reached its peak with a 151-match season during 2010-11.
Back in 1962, each County team played between 28-32 matches for a total of 254 three-day matches. 50 years later, The County Championship has become a 126 four-day match affair, where each team plays 14 matches.
48.92% of the 1987 first class season was County Championship matches (204/417), whereas only 34.05% of the 2024 season is County matches (126/370).
In 1975, there were 25 days of international cricket (5 Tests). By the time we got to 2010, the English home season had 51 days of international cricket.
In other news, Tymal Mills has criticized the scheduling of the T20 Blast since international players will most likely miss the final. The finals is slated for September 14th, the same week England-Australia T20Is will take place.
These are all valid issues. However, why is it that the English domestic cricket schedule is scrutinized all the time, but the Indian domestic system is not?
Mainly weather.
English Weather and Summer Break
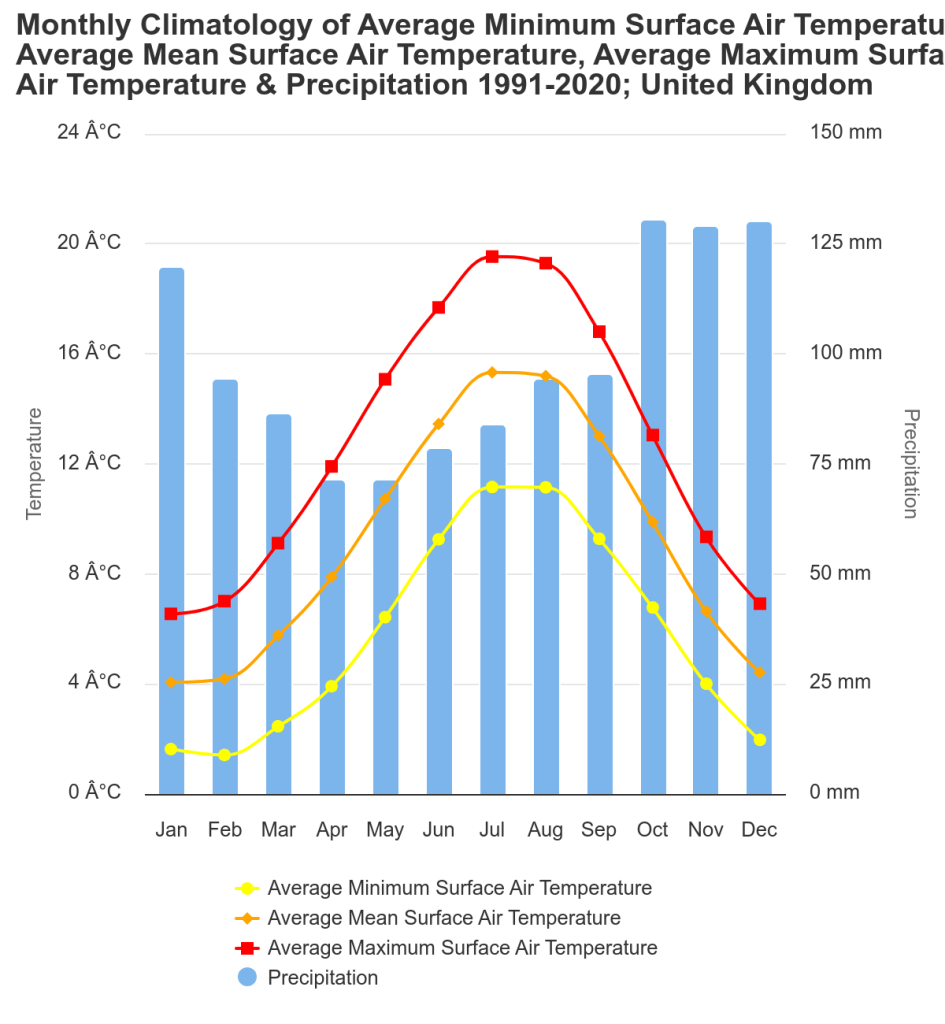
According to the climate portal of the World Bank Group, average precipitation in the UK increases dramatically between September and October from about 90 mm to 130 mm.
May is the driest month, while July is the hottest month.
Attention Spans are Getting Shorter
With AI taking over the world and everybody glued to their phones, it is no surprise that attention spans are getting shorter.
Students in the UK usually have a summer break from mid-July to late August, and schools go back in session around September. That’s not all—The Wimbledon takes place between the end of June & mid-July with the English Premier League following in mid-August.
The challenge for English domestic cricket is to simultaneously capture the attention of the public and escape from rain. Trying to fit international cricket, County Championship, and 3 separate limited over tournaments within 3-4 months and with the same group of players is nigh impossible and borderline, insane.
Indian cricket has the luxury to host the IPL between March-May and still have the Ranji Trophy & their Test between October-February. The rest of the year, India can host bilaterals and other tournaments like the Duleep Trophy, Syed Mushtaq Ali, etc.
English Domestic Season in a Nutshell
The modern English domestic season mainly consists of the following four types of tournament:
County Championship (first class), ODI Cup (List A), T20 Blast (domestic T20), experimental (currently, The Hundred)
For this analysis, we have looked at the schedules of County Championship, T20 Blast, The Hundred,Benson & Hedges Cup, Gillette Cup, Royal London One Day Cup, Sunday League, Bob Willis Trophy, and England’s international schedules.
*Note: Competitions involving National/minor counties, universities, MCC exhibition matches, and and tournaments such as Gentleman vs Players (ran from 1806-1963) are not considered in this analysis.
How Does the Current 2024 Domestic Season Look Like?
In theory, a three-format English cricketer who plays all possible matches in domestic cricket and The Hundred can play a maximum of 125 days of cricket at home given there is no overlap. That is 68.30% of the 183 total days between April 1st and September 30th.
2024 Season (Current Format with the Hundred)
Total Domestic Matches: 370
Max Days of Internationals: 37
Max Day of Domestic Cricket Per County: 88 (56 first class, 32 limited overs)
County Championship: 14 Matches (4 day per match)
Royal One Day Cup: 8
Vitality T20 Blast: 14
The Hundred: 10
International Home Season Breakdown
May 22-May 30: 4 T20Is vs Pakistan (4 maximum days of cricket)
July 10-July 28: 3 Tests vs West Indies (15 maximum days of cricket)
August 21-September 10: 3 Tests vs Sri Lanka (15)
September 11-September 29: 3 T20Is, 5 ODIs (8)
Competition
Type
Matches
Date Range
County Championship
First-Class
126
5 Apr-29 Sept
One Day Cup
50 Overs
77
30 May-14 Sept
T20 Blast
20 Overs
133
24 Jul-22 Sept
The Hundred
100 Balls
34
23 Jul-18 Aug
County Championship (1948-2024)
Before 1988, all County Championship Matches were played as 3-day games. After 1993, all matches became 4-day affairs and between 1988-1992, it was a mix of 3 and 4 day games.
Here are some additional notes:
In 1992, Durham was added as the 18th team in the County Championship. Before 1988, we have 17 teams and 18 teams after.
Between 1960-1962, a team could play a maximum of 32 first class games or a maximum of 96 days of cricket (since County was only 3 days back then).
Between 1988-1991, each team played sixteen 3-day matches (120 matches total) and six 4-day matches.
In comparison, a player in the 2024 County Championship could play a maximum of 14 first class games or a maximum of 56 days of first class cricket (4-day).
The ‘cricketing days’ column is the (number of matches) * (3 or 4) depending if it is a 3-day or 4-day match. This does not represent the actual days played since multiple County matches may overlap on a single day.
Years
Total Matches
Cricketing Days
Matches Per Team
1948-1949
221
663
26
1950-1959
238
714
28
1960-1962
254
762
Mix of 28/32
1963-1968
238
714
28
1969-1971
204
612
24
1972-1976
172
516
20
1977-1982
187
561
22
1983-1987
204
612
24
1988-1991
187
628
22
1992
198
628
22
1993-1999
152
608
17
2000-2016
144
576
16
2017-2019
126
504
14
2020*
46 (Bob Willis Trophy)
184
–
2021
126 (+1 BW Trophy)
508
14
2022-2024
126
504
14
Note*: In 2020, the County Championship was cancelled, and only the Bob Willis Trophy took place.
“There’s never really been a perfect schedule…I thought it worked well when T20s were on Friday nights and there seemed to be a regularity in the season, but I also liked a little bit of B&H & Gillette Cup!”
Between 2003-2019, the format of the T20 Blast, formerly known as the Twenty20 Cup, changed a staggering 7 times ranging from 48-matches to 151-matches.
The Early Years (2003-2009)
The early years had a pretty decent number of matches gradually increasing from 48 to 97.
(Side note: There is no direct correlation between an earlier end date for the T20 Blast and number of rained out matches as we can see from 2007-2008).
Year
Matches
Finals Date
Rained Out Matches
2003
48
19th July
0
2004
52
7th August
4
2005
79
30th July
11
2006
79
12th August
2
2007
79
4th August
19
2008
97
26th July
20
2009
97
15th August
3
Twenty20 Cup (2003-2009)
The Expansion and T20 Blast Scheduling Overkill (2014-2020)
The 2010s were when the scheduling problem amplified not only in the English domestic scene, but also internationally.
The domestic schedule could theoretically afford the increase from 97 games in 2009 to 151 in 2010 since the Gillette Cup & Sunday League ended and morphed into a single ECB 40 competition, but it realistically made the domestic schedule even more complex.
Year
Matches
Finals Date
Rained Out Matches
2010
151
14th August
5
2011
151
27th August
23
2012
97
25th August
20
2013
97
17th August
1
2014
133
23rd August
12
2015
133
29th August
9
2016
133
20th August
15
2017
133
2nd September
16
2018
133
15th September
12
2019
133
21st September
24
2020*
97
4th October
12
T20 Blast (2010-2020)
Post The Hundred (2021-2024)
Year
Matches
Finals Date
Rained Out Matches
2021
133
18th September
13
2022
133
16th July
6
2023
133
15th July
2
2024
133
14th September
10
T20 Blast (2021-2024)
The Hundred
The reason The Hundred has become a point of contention is not necessarily due to the new format created of out of the whim.
Rather, it goes back to attention span. Late July to mid-August is a coveted window in the English domestic calendar.
The Hundred being scheduled during this valuable time slot means that T20 Blast matches becomes a secondary tournament. Furthermore, Test series are delayed to September, where there is a higher likelihood of being affected by rain or bad light. In addition, some rounds of the T20 Blast and the Royal One Day occur during this time, which means County teams have to find a second XI to field their teams (since most marquee players would be at The Hundred).
Year
Starting Date
Ending Date
2021
23rd July
18th August
2022
1st August
27th August
2023
3rd August
3rd September
2024
21st July
21st August
The Hundred (2021-2024)
T20 Vitality Blast Attendance
In 2003, the Vitality Blast begun with an attendance of about 257,759. Over the years, the attendance has ebbed and flowed and has slightly dipped since the inception of the 100-ball competition:
The Hundred is not the first time England cricket is pioneering a new format. They started with 65 overs back in the early 1960s, created a 40-over tournament that built the backbone of England’s 2009 WC winning squad, and are now experimenting with 100-ball cricket.
Here is a brief timeline:
2014-2024: Royal London One Day Cup
2021-2024: The Hundred
2010-2013: ECB 40
1972-2002: Benson & Hedges Cup (55-overs first few years, then 50 overs)
1969-2009: Sunday League/National League/NatWest Pro40 (50, 45, then 40 overs)
By 1975, the modern English domestic season was established, and ODI cricket had taken its root in England. This was an interesting season because it also had an Ashes series and the inaugural ODI World Cup.
Max Days of Internationals: 25
Max Days of Domestic Cricket Per County: 88 (60 first class, 28 limited overs)
County Championship: 60 (20 matches)
Sunday League: 16
Benson & Hedges Cup: 7
Gillete Cup: 5 (Knockout format)
County Championship
Gillete Cup, Sunday League, Friends Provident Trophy
International Home Season
10 July 1975-3 September 1975: 4-Test Ashes (20 days max)
ODI World Cup: 5 Matches Max (3 Group, semi-final, and final)
2010 Season (Inaugural ECB40, Expansion of T20 Blast)
Total Domestic Matches: 424
Max Days of Home International Cricket: 51
Max Days of Domestic Cricket Per County: 96 (64 first class, 32 limited overs)
County Championship: 64 (16 matches)
T20 Blast: 18
ECB 40: 14
International Home Season
May 27-June 6: 2 Tests vs Bangladesh (10)
June 22-July 3: 5 ODIs vs Australia (5)
July 8-July 12: 3 ODIs vs Bangladesh (3)
July 29-August 26: 4 Tests vs Pakistan (24)
September 5-September 7: 2 T20Is vs Pakistan (2)
September 10-September 22: 5 ODIs vs Pakistan (5)
Note: Prior to the home season, 2010 T20 World Cup occurred between April 30-16 May in the West Indies, and England were the winners. They played 7 matches during this campaign.
Max Days of Domestic Cricket Per County: 95 (57 first class, 38 limited overs)
County Championship: 56 (14 matches)
1 tour Match
Vitality T20 Blast: 17
One Day Cup: 11
The Hundred: 10
International Home Season
June 1-4: 1 Test vs Ireland (4-Day Test)
One tour Match took place
June 16-July 31: 5-Test Ashes vs Australia (25)
August 30-September 15: 4 T20Is, 4 ODIs vs New Zealand (8)
2 Tour matches
September 20-26: 3 ODIs vs Ireland (3)
*Note: The ICC World Test Championship took place between 7-11th June at the Oval.
Competition
Type
Matches
Date Range
County Championship
First-Class
126
6 Apr-29 Sept
One Day Cup
50 Overs
77
1 Aug-16 Sept
T20 Blast
20 Overs
133
20 May-15 July
The Hundred
100 Balls
34
1 Aug-27 Aug
Final Thoughts
From the ECB point of view, I get it. More limited over matches means more attendance, and in the long term, better financial stability (hopefully), but is the overkill of cricket really worth it?
“We all recognise that the Twenty20 Cup has been a startling success…Yet I would make a plea to the ECB and the administrators around the counties who smell a golden goose…Cricket is not good at this. At international level, look at the congested schedules that are exhausting players and spectators alike. Short-term greed will backfire.“
– Vic Marks
That was 2003, when the Twenty20 Cup was only 48 matches, and The Hundred did not exist. 21 years later with the proliferation of franchise leagues and ICC tournaments every year, the situation has become even worse.
The ECB continued with the same 133-match format for the T20 Blast even after The Hundred. Maybe there is a case to go back to 2005-07 format, where 79-matches were played throughout or abolish The Hundred altogether.
Is there a Solution to England’s Schedule Woes?
Is there a solution?
Probably, but that is beyond the scope of this article (I have a ‘truly marvelous’ solution to this issue, but the margins are too narrow to contain it).
However, little changes can go a long way.
For starters, as Adam Collins argues on his podcast, scheduling September Test matches earlier in the day or adding lost overs to the beginning of the next day can be a start.
Does Test cricket in the UK start too late in September?
🗣️ "Surely it's 10:30 starts? Why are we starting a Test match in September at 11?" – @collinsadam
Remember, today’s goal was not to solve England’s domestic scheduling problem. Rather, it was to realize that this is the main problem for England’s administration to solve.
****
Thank you all for reading!
What do you all think about how to resolve the domestic English schedule? Comment below, would love to know your thoughts!
If You Like Reading about Problems & Solutions in Cricket, you may enjoy
Do you know how many undergraduate collegiate varsity cricket teams exist in the United States?
ONE.
You read that right. Haverford College in Pennsylvania is the only American institution that has an official varsity cricket team (more on them later).
As we learned from Avinash’s journey earlier, America has numerous cricket clubs across the country. In addition, there is the National College Cricket Association and the American College Cricket League. However, neither are officially affiliated with USA’s official body to regulate university sport, the National Collegiate Athletic Association (NCAA).
If cricket has any chance of survival and wants to be considered a professional sport in the USA, it has to make an effort to become a part of the NCAA sporting fraternity.
What is the NCAA?
The NCAA is a member-led non-profit organization that regulates university sports in the United States.
In the 1904 American college football season, 18 college athletes died and another 159 were injured.
Something had to be done.
So, President Theodore Roosevelt called upon the major universities to regulate football. Several athletic leaders met, 62 colleges signed the inaugural charter, and the Intercollegiate Athletic Association of the United States (IAAUS) was born, which would later be renamed as the NCAA in 1910.
In 1973, NCAA’s current structure of Division I-III sports was established.
In 2022, Division I NCAA institutions reported a revenue of $17.5 billion, $11.2 billion of which was generated by the athletic departments themselves and $6.3 billion came from government and student fees.
In the same year, Division I institutions also reported spending$17.1 billion. $3 billion of which were spent on student financial aid and $3.3 billion was spent on coach compensation.
Apart from student financial aid and coach compensation, NCAA helps fund sports camps, facilities, medical, recruiting, game travel, etc.
Note: This is only Division I data. More money is spend overall in NCAA sports if we also consider Division II & III.
How NCAA Include a New Sport?
I wanted to learn how a new sport can become a part of the NCAA program.
The Emerging Sports Program for Women is one such program that aims to provide more athletic opportunities for women and can help a new sport achieve NCAA championship status.
The Emerging Sports Program for Women
To learn how cricket can be part of the NCAA, I reached out to the NCAA themselves and asked the following questions:
What is the process for a sport to become NCAA recognized?
What is the timeline like, and is there data available for how long it took each sport to complete the NCAA eligibility (both men’s and women’s)?
Has any organization applied for cricket to become a NCAA sport?
According to the Associate Director of Communications of the NCAA,
“Any sport can be considered” to be a part of the NCAA. However, she had not yet “heard of [cricket’s] application for the emerging sports program.”
After a sporting organization submits the initial application,
“The Committee on Women’s Athletics will review the proposal to determine if it is granted entrance to the Emerging Sports for Women program.”
How Can An Emerging Sport Reach NCAA Championship Status?
At least 20 NCAA active members must sponsor the sport at varsity or club level
These members need to demonstrate at least 5 intercollegiate contests during an academic year
At least 10 letters of commitment are needed from members to sponsor the sport at the varsity level in the year under review
The institution’s chancellor/president, the director of athletics, and senior women administrator must sign the commitment
Supporting materials for the application include:
Budget, Roster size, full-time/part-time coaches, description of facilities, competition opportunities, ‘relationship with sport governing body/organization’
Suggested NCAA regulations (Playing Rules, Financial Aid limits, etc.)
Data (Injury Rates, Health/Safety, Ethnicity/Race, High school participation rates, etc.)
The organization can also submit additional documents from the U.S. Olympic/Paralympic committees, professional sport organizations, etc.
A sport has 10 years from the time it becomes an emerging women’s sport to get to 40 active members, after which it can apply for the NCAA championship status.
What is the Application Process?
A representative of the national governing body must submit an interest form and an official application. Applications open between May 1-August 1 each year, and a sport can apply every two years if is not accepted.
Her final question to me was,
“Have you worked with the governing body for Cricket in the U.S.?
I have not yet worked with the governing body for Cricket in the U.S., but if we are serious about making a collective push for cricket to be included in the NCAA, one of us has to reach out to USA cricket and officially apply for the Emerging Sports program.
Beach volleyball (2015), bowling (2003), water polo (2000), ice hockey (1996), and rowing (1996) have all achieved NCAA championship status recently. Women’s wrestling is on track to become the next one.
Currently, acrobatics & tumbling, equestrian, rugby, stunt, and triathlon are other sports to have become part of the emerging program.
According to an ESPN article, Haverford’s “cricket team also has a unique quirk: It’s the only collegiate varsity team in the country.”
Cricket has a rich history at Haverford College dating back to the 1850s. Kamran Khan, a former Pakistan and USA player, has helped coach the team and increase its popularity in recent decades.
Final Thoughts: Are Things Moving in the Right Direction for USA Cricket?
Apart from USA cricket’s administrative issues, cricket seems to be moving in the right direction in America.
Major League Cricket (MLC) has had a couple of successful season, US co-hosted the 2024 T20 World Cup World Cup, and cricket is now a part of the 2028 Los Angeles Olympics. Support from the Indian diaspora, IPL teams, and Australian partnerships have all proved to be fruitful, and the MLC has largely avoided going the way of previous failed attempts to bring cricket to the US.
The initial impetus has been provided, but it has still not become a part of the general American sporting experience.
Lots of promising players are coming up in the American circuit. However, if financial aid, proper facilities, and incentive to continue playing cricket are not provided, talent may switch to other sports.
Therefore, if cricket has to succeed or even stay remotely relevant in the American market, it has to break through the American college market first.
****
That was my tidbits, what do you think should be done to grow cricket in America? Comment below and share ahead. Thanks for reading!
If you like reading about Cricket in America, you may also like: