At 3:30 AM, I woke up with a jolt. First instinct: check Cricinfo. Were Kohli and Rohit still batting? Had I overslept my the innings-break nap?
Kohli was in the 20s, Rohit nearing his fifty. Phew. Relief. Breathe. They were still alive.
With one eye half-shut and one thumb on Twitter, I watched the duo bat on, one ball at a time.
At 4:47 AM, Rohit brought up his century, moments after Kohli reached his 50. Kohli gave him a hug. Both smiled. The crowd erupted. For that moment, the world seemed to pause. As if nothing else mattered.
Through the series, I celebrated each run, every fist bump, every catch and dive of Rohit and Kohli. My dad and brother would talk before and during each game as if the world’s luck depended on us.
I’d pray that India win the toss and bat. And shut off the TV after Kohli’s ducks.
But why was I acting like this? Growing up, you wouldn’t called me RoKo’s #1 fan. I used to watch every ball of any international game, follow all the T20 leagues, and stay up for a Bangladesh-Zimbabwe Test. So, why did this meaningless ODI bilateral series suddenly matter so much?
Maybe it was the realization that the end is near. Maybe because Australia appreciated these two players and knew how to give a proper farewell.
Both Kohli and Rohit retired from T20Is after winning the T20 World Cup. Expected.
Both retired from Tests. Slightly unexpected.
Then Rohit was replaced by Gill as ODI captain. Shocking. Questions started to murmur: Are they going to make it two more years? Will every series be an examination? Why is Jaiswal waiting in the wings?
And then Kohli scored two consecutive ducks for the first time in his career and waved goodbye to his beloved Adelaide supporters. All hell broke loose. Was the 3rd ODI going to be his last? Is his form dropping off the cliff? Was our childhood finally coming to an end?
We have seen transitions before. Father Time waits for no one.
Gavaskar and Kapil faded, Tendulkar and Dravid retired, Dhoni left (kinda). With each passing generation, India found new heroes, leaving behind a tinge of nostalgia for the past.
But for that one hour and seventeen minutes, Father Time paused, letting Rohit and Kohli shine, giving us a glimpse of what two upcoming emotional years could look like.
The post-match interviews ended. The sun rose. I drifted back to sleep. Time had moved on, but the memory of that morning will stay with me forever.
Thank you all for reading!
This is part of a new series of short articles, all under 500 words, where I try to make every word count. This one ended up at 429 words.
“The King Is About to Arrive”
I will leave you with these pieces of commentary gold from SEN cricket.
“It would be lovely to just look at this here this week and go, why do we complain, why do we worry about Test match cricket?
…Why do people knock this format? It is just so wonderful, but I am afraid, other countries don’t have the luxury that England, India, Australia have…So, we and India and Australia have to keep an eye on the future of Test match cricket. If we let this go, we are not doing the game a service…We need to keep an eye on this and keep pushing it forward and look after those who are not as fortunate.”
Nasser Hussain
It is a beautiful sentiment, and most fans would likely agree, Nasser.
But it is also paradoxical.
This is probably not the ideal week to bring this up—not after five gripping Tests, packed crowds, and an absolute bonkers of a finish. But here is the uncomfortable truth:
In trying to save Test cricket, the Big 3 may be unintentionally suffocating it.
The Narrative that ‘Test Cricket Is Dying’ is Hurting the Game
Each time the Ashes, the Border-Gavaskar Trophy, or an India-England series rolls around, we hear the same recycled narrative: “Test Cricket is in Danger.”
But is it really?
The love for the format was evident in the World Test Championship final, with South Africa showcasing their quality and a neutral English crowd adding to the occasion.
Test cricket is thriving, at least in England, Australia, and India.
And that’s precisely the problem. In their effort to protect and profit from the format, the Big 3 have increasingly started playing exclusively amongst themselves.
The spectators get quality Test cricket, packed stadiums, polished broadcasts, and high TV ratings. The format “stays alive.”
The Never-Ending Tri-Series
At this point, Test cricket has morphed into a never-ending tri-series between India, England, and Australia.
ENG in IND (Nov 16-Feb 17)
AUS in IND (Feb-Mar 17)
IND in ENG (Jul-Sept 18)
ENG in AUS (Nov 17-Jan 18)
IND in AUS (Nov 18-Jan 19)
AUS in ENG (Aug-Sep 19)
IND in ENG (Aug-Sept 21/22)
IND in AUS (Nov 20-Jan 21)
ENG in IND (Feb-Mar 21)
ENG in AUS (Dec 21-Jan 22)
AUS in IND (Feb-Mar 23)
AUS in ENG (Jun-Jul 23)
ENG in IND (Jan-Mar 24)
IND in AUS (Nov 24-Jan 25)
IND in ENG (Jun-Aug 25)
ENG in AUS (Nov 25-Jan 26)
Whoever said it was right.
India vs England is prep for the upcoming Ashes. Just like the Ashes will be prep for the next BGT.
Meanwhile, the rest of the world waits:
Zimbabwe have not toured Australia for a Test series since 2003.
Australia last played a Test against Bangladesh in 2017.
England did not tour Sri Lanka between 2012 and 2018.
India last visited New Zealand 2-match Test series in February 2020 before the pandemic. That feels ages ago.
Even the popular NZ-Eng series hasn’t seen a four-Test series since 1999.
And these are just a few examples.
Test cricket has practically only grown from 2 thriving cricketing nations to 3 thriving nations in a 150 years.
— Broken Cricket Dreams Cricket Blog (@cricket_broken) August 5, 2025
The Game Theory Problem: Everyone for Themselves
The Prisoner’s Dilemma is a classic game theory problem, a study of how rational decisions made in self-interest can lead to worse outcomes for everyone involved.
Imagine two individuals who are both accused of a crime and interrogated separately. Each has two choices: stay silent (cooperate) or betray the other (defect):
If both stay silent, they get out with light sentences (let’s say 1 year each).
If one defects while the other stays silent, the defector goes free (0 years) while the other gets a heavy sentence (10 years).
If they both defect, they each serve moderate time (3 years).
Logically, each person would want to defect to avoid the worst-case scenario. But when both individuals make the ‘rational’ choice, they end up worse off than if they had trusted each other. And that’s the dilemma:
Acting in self-interest leads to a collectively worse outcome, even when cooperation would have helped them both.
Cooperation Requires Sacrifice, but Cricket’s Not Designed for It
We have all criticized the ICC at one point or another.
But let’s give them some grace. Unlike other global sporting bodies, the ICC isn’t a centralized power.
Cricket is not a single unified business. Rather, it is network of competing bodies trying to protect their self-interests with the ICC acting as a mediator. Consider the Test-playing nations:
12 International Boards with their own finances and calendars. The boards need to care of their players, staff, stadiums, and local boards.
And of course, the broadcasters, whose rights deals prop up the whole system
That’s 50+ separate individual business entities, each trying to show profits, satisfy sponsors, and keep their board of directors happy.
Now, in theory, this can work. Money is not a zero-sum game, and multiple businesses can succeed together.
However, cricket has two unavoidable constraints:
The calendar: There are only so many days of the year and even fewer in a cricket summer seasons are even shorter.
The players: Unlike soccer, where there is a plethora of international quality athletes, cricket keeps copying and pasting the same pool of global T20 stars (think Rashid Khan, Pooran, Klaasen, Faf, Russell, etc.).
And when everyone’s fighting for the same weeks and the same set of players, it turns into Survival of the Fittest, a capitalistic model where some thrive but at the expense of the others.
Supply and Demand: The Big 3 Leagues are Draining the World’s Talent
England and Australia have short cricket summers, which means cramming Tests, County, bilateral series, and T20 leagues in a tight window.
The impact?
We rarely see the stars like Steve Smith or Mitchell Starc playing a full season of Big Bash or Ben Stokes playing in The Hundred.
Here’s the catch: The Big Bash and The Hundred and the individual franchises still need to maintain profitability. So what do they do?
They import talent. They poach the West Indians, South Africans, Kiwis, Pakistanis, and beyond to elevate the standard of their own leagues.
While England, Australia, and India try to ‘preserve Test cricket’ at home, their T20 leagues drain the talent pipelines of Test cricket elsewhere.
The smaller nations have a supply of great talent, but they don’t have the financial strength to retain them. These players have to go where the demand is: The IPL, Big Bash, MLC, The Hundred, SA20, ILT20.
But wait, Cricket West Indies, PCB, CSA, NZC, they all need to make money too, right?
To survive in the limited calendar, they have to make tough choices: Launching their own T20 leagues, trimming down Test tours due to cost and scheduling clashes, and squeezing random bilateral ODI series with India to stay financially afloat.
This creates a cascading effect: (1) oversaturation of cricket, (2) early Pooran-esque retirements, (3) higher injury risks, and (4) growing friction between players and their boards.
The Vicious Cycle of Modern Test Cricket
We can summarize the vicious cycle of modern Test cricket that we have know become accustomed to.
1. Big 3 Dominate the Calendar
India, England, and Australia pack their summers with high-profile Test series, leaving no room for their stars in domestic T20 leagues (except for the IPL)
2. Top Players are Poached from Smaller Nations
Leagues like the BBL and The Hundred fill the gaps by importing talent from smaller nations.
3. Smaller Boards Cut Tests to Survive
With finances tight, smaller boards prioritize limited over bilateral and launch their own leagues, but are unable to retain their players.
4. Test Quality Drops Justifying More Big 3 Series
Then, once in a blue moon, an Australia visits a West Indian side and completely decimates it. The “Test cricket is dying” narrative returns, reinforcing the idea that only the Big 3 can keep the format alive.
Final Thoughts: The Big 3 Didn’t Mean to Kill It. But They Are
As fans, we want it all—packed stadiums in the Caribbean, epic five-Test rivalries, a thriving County game, an entertaining IPL season, the Poorans & Klaasens lighting up the 2026 T20 World Cup, an ODI game that still provides finishes like the 2019 WC Finals, return of the Champions League T20, room for Associates to grow, and much more.
Unfortunately, with a finite cricket calendar, a limited player pool, and every board, franchise, and broadcasters all acting rationally in their own self-interest, something has to give.
The Big 3 claim to be protecting Test cricket, but what have they actually sacrificed?
I finally got around to watching the cult classic, Field of Dreams last month, and I haven’t stopped thinking about it ever since.
It’s a story of broken baseball dreams. Of author Terence Mann. Of Archie “Moonlight” Graham, who played only one professional match and never got a chance to bat.
But more than anything, it is a story of sports and life. And a son and his dad. (If you haven’t watched it, go do that. Now. Trust me, you’ll shed a tear or two).
Watching it reminded me of why I started writing in the first place, back in June 2020 in the middle of the pandemic.
One random afternoon, my brother said, “Why don’t you write about cricket? You talk about it all the time. You used to enjoy writing essays in college. And you had a broken dream. I have an idea—You should start a blog and call it ‘Broken Cricket Dreams.’”
That was it. That’s how BCD was born.
Five years, 400 posts, and 685,500 words later, I am still writing.
Just like in our 200th Article Special which was filled with music from Frank Sinatra to John Lennon, this one is shaped by movie quotes.
1. “Words And Ideas Can Change the World…What Will Your Verse Be?”
Movie:Dead Poets Society (1989)
“No matter what anybody tells you, words and ideas can change the world.
We don’t read and write poetry because it is cute. We read and write poetry because we are members of the human race. And the human race is filled with passion.
Medicine, law, business, engineering, these are noble pursuits and necessary to sustain life. But poetry, beauty, romance, love, these are what we stay alive for.’
[Walt Whitman’s Poetry] ‘…That you are here. That life exists. An identity. The powerful play goes on, and you may contribute a verse.’
What will your verse be?”
Reflection #1
I think about this quote often.
In school, we were always sorted into boxes. You were either a “math or science” kid or a “literature and humanities” kid. I was placed in the STEM category, went on to study mathematics, and now work with computer technology.
But there was always another side. I liked geography. Loved music. Shakespeare and the Greek writers moved me.
Maybe I never had to choose just one. Maybe what makes life rich is the mix of the ‘noble pursuits’ that keep life going and the poetry that gives it meaning.
Because words and ideas can change the world. Sometimes, they start revolutions. Other times, they quietly shift the way someone sees things.
Dead Poets Society is in itself a work of art that changed the way I view society. And what a soulful performance by the late Robin Williams. Those speeches stayed with me since middle school.
Oh captain, my captain. Whatever my verse will be, I just hope it is honest.
2. “If You Build It, He Will Come.”
Movie:Field of Dreams (1989)
“The one constant through all these years Ray, has been baseball….
America…it’s been erased like a blackboard. Rebuilt and erased again. But baseball has marked the time.
This field, this game, it’s part of our past, Ray. It reminds us of all that once was good. And it could be again…Oh, people will come Ray. People will most definitely come.”
Reflection #2
This quote teaches me two things.
One: sports transcends boundaries. What baseball is to the US, soccer is to Brazil, and cricket is to India—these sports are a cultural heartbeat that connects folks from different walks of life.
Two: “If you build it, they will come” applies to more than just a ghostly baseball fantasy. It holds true in any business. If you do the groundwork and make something worthwhile, people will come.
For me, that was the blog. For years, I felt like I was writing into the oblivion. But now, people have started to come. And I am grateful for every connection this journey has brought me.
3. “Is This Heaven? No, It’s Iowa.”
Movie:Field of Dreams (1989)
“Is there a heaven? Oh yeah…It’s where dreams come true.
….Maybe, this is heaven.”
Reflection #3
This one hits especially close. I spent four years in Iowa and looking back, those were some of the best years of my life. That place shaped me in ways I am still discovering.
We are always chasing the next thing—the next degree, job, or milestone. But sometimes, if we just stop for a moment and look around, we realize that maybe this is enough. Maybe, this, indeed, is heaven.
And the final scene from Field of Dreams? Still gets me every time.
4. “Let me speak endlessly, kindly. And even by accident—Let no harm come from my words.”
Movie:Anand (1971)
“Mann ko aashirvaad Baba. Jo sada hasta rahe.
Main Kabhi chup na rahun. Bolta rahun. Beshumar Bolun. Achha Bolun.
Galti se bhi burai na nikle mere moon se.”
Translation
“Bless my heart, old sage. That I shall always laugh.
Let me never be silent. Let me speak endlessly, kindly.
And even by accident—Let no harm come from my words.”
Reflection #4
One of the most beautiful moments of Hindi cinema.
Anand, a man going through terminal illness, chooses to live with joy even while knowing that his days are numbered. And when he asks for blessings, he doesn’t pray for healing, but for the strength to keep spreading light until his last breath.
That’s a motto I’d like to live by.
5. “Each Man’s Life Touches So Many Other Lives.”
Movie:It’s a Wonderful Life (1946)
“Strange, isn’t it? Each man’s life touches so many other lives. And when he isn’t around…it leaves an awful hole, doesn’t it?”
Reflection #5
I will keep writing. Some pieces might spark something in a reader just enough for them to feel that they are not the only one. Others won’t. But that’s okay, I’ll keep writing anyway.
It’s A Wonderful Life reminds me how precious life really is and not to take any of it for granted. We are all here for a reason and our words, work, or even a passing conversation can have an impact far beyond what we’ll ever realize.
So, Why Do I Write?
Sometimes my brain gets overcrowded. I am wrestling with my thoughts, going through internal debates. It can get muddled up there pretty quickly.
Writing helps me sort through it. It brings me clarity. Sometimes, I don’t even know what I’m really thinking until I write it down. My favorite days are the ones where I start with a pre-conceived notion and over the course of research and a few edits, my own viewpoint shifts completely.
In a way, every piece is its own journey of self-discovery.
****
I never thought I’d be a writer. But it turns out this is the one thing that brings me real flow. Maybe even more than watching or playing cricket itself.
When I am writing, I lose track of time. It’s well past midnight as I write this. I should sleep, but well, I’m still here trying to tie all the loose ends together.
This wasn’t the dream. But maybe, it’s something even better.
The freedom to think, to express whatever I want, whenever I want. To be able to share it with the world, and more than anything, to have a family that supports me no matter what.
Maybe, this is heaven.
****
Thank you all for reading and supporting over these past few years. I appreciate you all.
Before you Go, Consider Supporting and buying my book on Amazon!
Growing up in the 2000s, it felt like Australia won EVERYTHING in cricket—World Cups, Champions Trophies, the Ashes, Commonwealth, women’s, men’s, U-19—you name it.
Likewise, the USA, China, Russia, Great Britain, Australia, and France dominate the Summer Olympics. Every. Single. Time.
Why do these countries keep winning? And why doesn’t Djibouti rack up more medals? (For the record, Djibouti won a solitary bronze in 1988 Men’s Marathon).
The easy answers? These developed nations have better facilities, grassroots programs, and a robust ‘sporting culture’. But can we quantify this?
By applying Maslow’s Hierarchy of Needs to the economies of the 12 Test-playing cricket nations, 9 FIFA World Cup powerhouses, and six summer Olympic titans, I will create an economic hierarchy for international sports and uncover what it takes for a nation to consistently dominate the global stage. Here are the main questions I’m tackling today:
What is the minimum GDP per capita threshold required for a nation to achieve its first global sporting glory?
How rich must a country win to dominate one team sport?
At what economical threshold does a country go from a one-sport nation to a “sporting culture” like Australia, Russia, China, or the United States?
Let’s begin.
Key Takeaways
To secure its first major team sporting achievement or an Olympic medal, a nation must meet a minimum GDP per capita of $75-$250. Pakistan won an Olympic gold in field hockey in 1960, when their GDP per capita was just $82. Brazil’s GDP per capita was $235.6 in 1960 when they rose in football, India was at $296 in 1983, Sri Lanka – $776.2 (1996), and Afghanistan was at $560.6 when they qualified for the 2010 T20 World Cup.
To become a dominant ‘one-sport’ nation, the GDP per capita must rise to a minimum of $1000-$2500.
West Germany’s GDP increased from $1162.7 in 1960 to $5659.7 in 1974, by which team they had won two World Cups. When Argentina won again in 1986, they had amassed $3436.1 GDP per capita. Brazil reached $3298 by 1994.
Jamaica’s GDP per capita rose from $1632 in 1988 (two Olympic medals) to $5029.8 in 2008 (11 medals).
India’s GDP per capita rose from $544.1 in 2003 to $1021.9 in 2007 before they were able to launch the IPL.
When a nation reaches a minimum of $15,000 GDP per capita, a Global Hunger Index (GHI) < 5, and a poverty rate of less than 2%, they are able to rise to an Olympic and multi-team sport supergiant. China’s current GDP per capita is $13,870. They reduced their GHI from 13.4 in 2000 to <5 by 2016. Australia’s GDP per capita almost double from about $20,000 to $40,000 between 1999-2007, and currently have a GDP per capita of $67,980.
American psychologist, Abraham Maslow, proposed a model that distributed human behavior into five distinct levels:
Physiological Needs: Essentials like food, water, and shelter.
Safety: Security, financial stability, and health.
Love & Belonging: Relationships, intimacy, and connections.
Esteem: Self-respect, status, and recognition.
Self-Actualization: The pursuit of reaching one’s full potential.
The first two represent an individual’s ‘basic needs’, the next two are the ‘psychological needs,’ and the final level focuses on ‘self-fulfillment needs.’
My Theory on the Economics of Sports Dominance
The First Stage: Individual Triumphs
In a nation-state’s early stages, sporting success begins with individual pioneers who overcome socioeconomic hardships and limited infrastructure to achieve greatness. The only prerequisite is that the individual’s physiological needs are met during their physical growth. Think Milkha Singh’s story, rising against odds in post-Partition independent India to reach 4th in the 1960 Rome Olympics in the 400 meters.
The Second Stage: One-Sport Nations
As the nation progresses economically, it has the potential to become ‘one-sport’ nation based on cultural influences and accessible sports (for example, cricket in the British colonies, soccer globally). These teams often include athletes from both affluent and underprivileged backgrounds. Families meet Maslow’s safety needs, which enables the next generation to pursue sports. Think Pele’s Brazil in the 1960s or Sunil Gavaskar/Kapil Dev’s 1983 Indian cricket team).
The Third Stage: Middle Class Expands
Sustained economic growth strengthens the middle class, allowing nations to dominate in one sport and venture into others. By this stage, nations fulfill belonging and esteem needs, earning global respect among the sporting fraternity. Think China at the turn of the 21st century or India in the late 2000s.
The IPL in 2008 would not have been possible without India’s economic liberalization in 1991. Not only did the depth of Indian cricket increase drastically, the pool of business class citizens also increased—individuals who could afford to bet on the idea of the IPL.
This middle class and business growth also allowed India to form leagues like field hockey & Kabaddi and start winning individual Olympic medals in wrestling, badminton, gymnastics, shooting, etc.
The Fourth Stage: Cross-Sport Dominance
This can be a tricky transition phase for several nations due to population or limited resources. Dominating across multiple sports requires major investments across different sports, political will, and hosting global events. Before self-actualization, this can lead to a ‘Sleeping Giant’ phase. This is also the stage where nations typically begin excelling in women’s sports, as increased infrastructure and societal progress open doors for female athletes to thrive.
The All-Blacks from New Zealand may dominate rugby, the Kiwis and White Ferns are always competitive in cricket, and they win 10-20 Olympic medals every cycle, but with a population of 5 million, how much farther can they go?
The Fifth Stage: Self-Actualization
Decades of stability produce generations of affluent citizens, near-zero poverty, and world-class infrastructure. Athletes have the resources and environment to reach their full potential. Think the USA, USSR at the height of the cold war, China currently, Great Britain, Japan, and Australia.
Exceptions to the Rule
These conditions are the bare minimum necessary to be competitive. The reverse is not necessarily true. Economic stability does not guarantee sporting success.
For example, the men’s USA team still struggles to reach the Round of 16 after 40 years of investment, hosting the 1994 FIFA World Cup, and the MLS.
Adequate GDP per capita and strong sports culture does not guarantee success either. Mexico has a GDP per capita of ~ $13,360 and a bustling soccer scene. South Africa has a GDP per capita of $6,500 and a thriving cricket culture. Neither have won World Cups in these sports.
How much wealth it takes to win international sports.
Economic Trends of Various Sporting Teams (1960-Present)
We look at economies of the top countries who have played cricket, soccer, and achieved Olympic greatness.
Note: These countries also overlap with countries who tend to dominate field hockey, basketball, and ice hockey (except Finland). Baseball dominated countries (Cuba, Puerta Rico, Venezuela) golf & Winter Olympics (less accessible, high-end sports) are out of scope for this study.
Which Socioeconomic metrics do we look at and how were they collected?
We consider the following current socioeconomic stats:
GDP (Gross Domestic Product), population,GDP per capita, and if applicable, percentage of population under poverty, and Global Hunger Index (GHI).
GDP per capita can be skewed if there is high income inequality in the country. Hence, we also look at poverty rates and GHI to gauge a better picture of the population set.
Higher GDP and GDP per capita indicate stronger relative economy. Lower poverty rates and GHI levels reflect improved societal well-being.
Poverty rates are presented according to (1) World Bank’s 2017 data, where the extreme poverty line was defined as $2.15/day. Another poverty line, population under poverty (national) is presented if a nation’s self-defined poverty line is above the World Bank rate.
We source the current statistics from the IMF (International Monetary Fund) and the historical GDP per capita levels from the World Bank. The data is available from after 1960, when the World Bank started collecting this data. This coincides with the post-World War II era, when several nations became independent. World Cups were also beginning to take shape during this time.
Other Notes:
If GHI is not mentioned, that means the country is not analyzed by GHI (These are mostly first world countries that do not have hunger issues)
We combine results for Great Britain (Olympics), United Kingdom (GDP data), and England (1966 FIFA World Cup win, multiple cricket World Cup wins) under the same section.
I’ll use soccer instead of football for the rest of the article.
The sporting achievements listed are not an exhaustive list – just significant achievements spaced out to see trends in GDP.
All the sources we looked at are linked at the bottom of the article for your kind perusal.
Top 12 Richest Test Playing Cricketing Countries by GDP Per Capita
We begin by the 12 Test playing nations, ordered by 2025 GDP per capita.
For some countries, we also look at the GDP per capita at different points in their sporting history.
1. Ireland ($107,240)
Multi-sport nation
What was Ireland’s GDP per capita range at their first major sporting event?$2,516.9 (1974 Five Nations Rugby Union Championship, their first in the modern era, 10th since 1910). Their GDP per capita increased to $61,396.4 by the time they upset Pakistan in the 2007 ODI World Cup.
Ireland’s Current Socioeconomic Stats
GDP: $587.23 Billion
Population: 5.48 Million
GDP Per Capita: $107,240
Population Under Poverty (World Bank): 0.06% (2021)
Population Under Poverty (National): 14% (2021)
2024 Paris Olympic (Total Medals): 7
Most Popular Sports in Ireland: Gaelic Football, Rugby, golf, soccer, cricket
2. Australia ($67,980)
Global Sports Superpower
What was Australia’s GDP per capita at their first major sporting event?$8,252.7 (1978 Women’s ODI Cricket World Cup win)
Australia’s Current Socioeconomic Stats
GDP: $1.88 Trillion
Population: 27.67 Million
GDP Per Capita: $67,980
Population Under Poverty: 0.5% (2018)
2024 Paris Olympic (Total Medals): 53
Most Popular Sports in Australia: Australia Rules Football (AFL), Cricket, Rugby, Soccer, Tennis, Swimming
GDP Per Capita At a Glance
Year
GDP Per Capita
Significance
1963
$1967.2
Netball World Cup Win
1973
$4770.8
Women’s Cricket World Cup (CWC) Final
1975
$7003.8
Men’s CWC Final
1978
$8258.7
Women’s CWC Win
1987
$11651.3
Men’s CWC Win
1999
$20712.7
Men’s CWC Win
2007
$41051.6
3rd Consecutive Men’s ODI WC Win
2014
$62544.1
Women’s T20 WC Win
2023
$64820.9
Men’s CWC Win
3. United Kingdom ($54,280)
Global Sports Superpower
What was England’s GDP per capita at their first major sporting event?$1,987.6 (1966 FIFA World Cup)
UK’s Current Socioeconomic Stats
GDP: $3.73 Trillion
Population: 68.72 Million
GDP Per Capita: $54,280
Population Under Poverty: 0.2% (2021)
Great Britain 2024 Paris Olympic (Total Medals): 65
Most Popular Sports in the UK: Soccer, Cricket, Rugby, Tennis, Golf
GDP Per Capita At a Glance
Year
GDP Per Capita
Significance
1966
$1987.6
FIFA World Cup Win
1973
$3426.3
Women’s CWC Win
1979
$7804.8
Men’s CWC Final
1987
$13118.6
Men’s CWC Final
1992
$20487.2
Men’s CWC Final
2010
$39599
Men’s T20 WC Win
2019
$42662.5
Men’s ODI WC Win
4. New Zealand ($48,230)
Multi-sport nation
What was New Zealand’s GDP per capita at their first major sporting event? $12,330.9 (1987 Rugby World Cup)
NZ’s Current Socioeconomic Stats
GDP: $262.92 Billion
Population: 5.45 Million
GDP Per Capita: $48,230
Population Under Poverty:
2024 Paris Olympic (Total Medals): 20
Most Popular Sports in NZ: Rugby, Cricket, Netball, Soccer, Basketball
People tend to ask how New Zealand always ‘punches’ above their weights and make it to cricket World Cup semi-finals despite a population of 5.45 million?
Because they have the fourth highest GDP per capita and have most of the population above the poverty/GHI line, so individuals can focus on other worldly needs like sports.
GDP Per Capita At a Glance
Year
GDP Per Capita
Significance
1967
$2208.4
Netball WC Win
1987
$12330.9
RugbyWC Win
2000
$13641.1
Women’s CWC Win
2021
$49624.2
World Test Championship Win
5. West Indies ($19,823)
Multi-sport nation
West Indies teams from the 1975-1983 ODI World Cups, 2004 Champions Trophy, and 2012 & 2016 T20 World Cups included players from Guyana, Barbados, Jamaica, Trinidad & Tobago, and Saint Lucia
What was West Indies nations’ GDP per capita at their first major sporting event? (1975 World Cup)
What was Sri Lanka’s GDP per capita at their first major sporting event? $776.2 (Won the 1996 ODI World Cup)
SL’s Current Socioeconomic Stats
GDP: $74.59 Billion
Population: 22.4 Million
GDP Per Capita: $3,330
Population Under Poverty (World Bank): 0.96% (2019)
Population Under Poverty (National): 14.30% (2019)
Global Hunger Index: 11.3 (2024), 21.7 (2000)
2024 Paris Olympic (Total Medals): 0
Most Popular Sports in South Africa: Cricket, Volleyball, Athletics
GDP Per Capita At a Glance
Year
GDP Per Capita
Significance
1975
$279.8
Invited to CWC
1979
$230.8
Qualified for CWC
1996
$776.2
Won CWC
2007
$1578.6
ODI WC Runners-up
2014
$3971.9
T20 WC Win
8. India ($2,940)
One-Sport Dominant Nation, In-Transit to Become Multi-Sport Nation
What was Afghanistan’s GDP per capita at their first major sporting event?$296 (1983 ODI Cricket World Cup win)
India’s Current Socioeconomic Stats
GDP: $4.27 Trillion
Population: 1.45 Billion
GDP Per Capita: $2,940
Population Under Poverty (World Bank): 12.92 % (2021)
Global Hunger Index: 27.3 (2024), 38.4 (2000)
2024 Paris Olympic (Total Medals): 6
Most Popular Sports in India: Cricket, Field Hockey, Badminton, Kabaddi, Wrestling
GDP Per Capita At a Glance
Year
GDP Per Capita
Significance
1975
$161.1
Field Hockey WC Win
1983
$296
CWC Win
2003
$544.1
CWC Runners-Up
2007
$1021.9
T20 WC Win
2011
$1445.5
ODI WC Win
2024
$2700
T20 WC Win
(current USD $)
1983: $296
2003: $544.1
2007: $1021.9
2011: $1445.5
2013: $1432.8
2023: $2480.8
9. Bangladesh ($2,770)
One-Sport Dominant Nation
What was Bangladesh’s GDP per capita at their first major sporting event? $397.3 (Won the 1997 ICC Trophy and qualified for the 1999 ODI Cricket World Cup)
Bangladesh’s Current Socioeconomic Stats
GDP: $481.86 Billion
Population: 173.74 Million
GDP Per Capita: $2,770
Population Under Poverty (World Bank): 5.01% (2022)
Population Under Poverty (National): 18.7% (2022)
Global Hunger Index: 19.4 (2024), 33.8 (2000)
2024 Paris Olympic (Total Medals): 0
Most Popular Sports in Bangladesh: Cricket, Soccer, Kabaddi, Badminton
GDP Per Capita At a Glance
Year
GDP Per Capita
Significance
1997
$379.3
ICC Trophy Win
1999
$388
Qualified for CWC
2015
$1224.4
ODI WC Quarterfinals
10. Zimbabwe ($2,130)
One-Sport Dominant Nation
What was Zimbabwe’s GDP per capita at their first major sporting event? $716.8 (1975 Cricket World Cup – Had Kapil Dev not scored that 175*, we may be playing the ZPL)
Zimbabwe’s Current Socioeconomic Stats
GDP: $36.93 Billion
Population: 17.36 Million
GDP Per Capita: $2,130
Population Under Poverty (World Bank): 39.75% (2019)
Population Under Poverty (National): 38.30% (2019)
Global Hunger Index: 27.6 (2024), 35.3 (2000)
2024 Paris Olympic (Total Medals): 0
Most Popular Sports in Zimbabwe: Cricket, Soccer, Rugby, Athletics
GDP Per Capita At a Glance
Year
GDP Per Capita
Significance
1982
$1095.3
ICC Trophy Win, Qualified for 1983 WC
1995
$648
Hosted All-Africa Games
1999
$582
Best WC Show, 5 Wins
11. Pakistan ($1,590)
One-Sport Dominant Nation
What was Pakistan’s GDP per capita at their first major sporting event? $395.7 (1992 ODI Cricket World Cup Win)
Pakistan’s Current Socioeconomic Stats
GDP: $374.6 Billion
Population: 240.54 Million
GDP Per Capita: $1,590
Population Under Poverty (World Bank): 4.93% (2018)
Population Under Poverty (National): 21.9% (2018)
Global Hunger Index: 27.9 (2024), 36.6 (2000)
2024 Paris Olympic (Total Medals): 1
Most Popular Sports in Pakistan: Cricket, Field Hockey, Squash, Badminton
GDP Per Capita At a Glance
Year
GDP Per Capita
Significance
1960
$82
Field Hockey Olympic Gold
1979
$249.2
First CWC Semi-Finals
1992
$395.7
WC Win
1999
$418.2
WC Runners-Up
2009
$963.8
T20 WC Win
2017
$1519.2
Champions Trophy Win
2022
$1538.3
T20 WC Runners-up
12. Afghanistan ($410.93)
One-Sport Dominant Nation
What was Afghanistan’s GDP per capita at their first major sporting event?$560.6 (2010 – ICC Intercontinental Cup, ICC World T20 Qualifier Winners, qualify for 2010 T20 World Cup)
Afghanistan Current Socioeconomic Stats
GDP: $17.33 billion
Population: 42.17 Million
GDP Per Capita: $410.93
Population Under Poverty (World Bank): 34.9% (2023)
Population Under Poverty (National): 54.9% (2023)
Global Hunger Index: 30.8 (2024), 49.6 (2000)
2024 Paris Olympic (Total Medals): 0
Afghanistan’s Most Popular Sports: Cricket, Buzkashi
Since 1960, only the following countries have won the FIFA World Cup: Brazil, England, (West) Germany, Argentina, Italy, France, and Spain (Uruguay, Hungary, and Czechoslovakia are not considered here).
We will also explore Croatia, Portugal, and the Netherlands, who have been competitive.
1. Netherlands ($70,610)
Multi-Sport Nation
What was Netherland’s GDP per capita at their first major sporting event? $6,454.5 (1974 Finalists)
Current Socioeconomic Stats
GDP: $1.27 Billion
Population: 18.03 Million
GDP Per Capita: $70,610
Population Under Poverty (WB): 0.07% (2021)
Population Under Poverty (National): 14.5% (2021)
2024 Paris Olympic (Total Medals): 34
Most Popular Sports in Netherlands: Soccer, Cycling, Field Hockey
GDP Per Capita At a Glance
Year
GDP Per Capita
Significance
1974
$6450.5
FIFA World Cup (WC) Runners-up
1978
$11195.8
WC Runners-Up
2010
$51305.7
WC Runners-Up
2014
$53457.2
3rd Place
2. Germany ($57,910)
Global Sports Superpower
What was Germany’s GDP per capita at their first major sporting event? $1,162.1 (1960 – West Germany won the 1954 FIFA WC), $5,659.7 (1974)
Current Socioeconomic Stats
GDP: 4.92 Trillion
Population: 84.98 Million
GDP Per Capita: $57,910
Population Under Poverty (World Bank): 0.24% (2020)
Population Under Poverty (National): 16% (2020)
2024 Paris Olympic (Total Medals): 33
Most Popular Sports in Germany: Soccer, Tennis, Basketball, Handball
GDP Per Capita At a Glance
Year
GDP Per Capita
Significance
1966
$1870.8
FIFA WC Runners-Up
1974
$5659.7
WC Winners
1990
$22385.7
WC Winners
2003
$30711.1
Women’s FIFA WC Win
2008
$46386.3
Men’s Field Hockey Gold
2014
$48971.1
WC Winners
3. France ($49,530)
Global Sports Superpower
What was France’s GDP per capita at their first major sporting event? $9,311.9 (1984 Euro)
Current Socioeconomic Stats
GDP: $3.28 Trillion
Population: 66.3 Million
GDP Per Capita: $49,530
Population Under Poverty (World Bank): 0.06% (2021)
Population Under Poverty (National): 15.60% (2021)
2024 Paris Olympic (Total Medals): 64
Most Popular Sports in France: Soccer, Tennis, Rugby, Handball, Basketball
GDP Per Capita At a Glance
Year
GDP Per Capita
Significance
1986
$13430.5
FIFA WC 3rd Place
1995
$26791.8
Men’s Handball WC Win
1998
$24869.4
FIFA WC Win
2006
$36431.6
WC Runners-Up
2018
$41418.2
WC Winners
4. Italy ($41,710)
Multi-sports Nation
What was Italy’s GDP per capita at their first major sporting event? $1,718.5 (1968 UEFA Euro)
Current Socioeconomic Stats
GDP: $2.46 Trillion
Population: 58.96 Million
GDP Per Capita: $41,710
Population Under Poverty (World Bank): 0.81% (2021)
Population Under Poverty (National): 20.10% (2021)
2024 Paris Olympic (Total Medals): 40
Most Popular Sports in Italy: Soccer, Cycling, Tennis, Basketball, Volleyball, Formula 1
GDP Per Capita At a Glance
Year
GDP Per Capita
Significance
1970
$2111.7
FIFA WC Runners-up
1982
$7573.9
WC Win
1994
$19382.2
WC Runners-Up
2006
$33684.7
WC Win
2020
$32091.5
Euro Winners
5. Spain ($37,360)
Multi-sports Nation
What was Spain’s GDP per capita at their first major sporting event? $695 (1984 Euro)
Current Socioeconomic Stats
GDP: 1.83 Trillion
Population: 48.92 Million
GDP Per Capita: $37,360
Population Under Poverty (WB): 0.56%
Population Under Poverty (National): 20.4%
2024 Paris Olympic (Total Medals): 18
Most Popular Sports in Spain: Soccer, Basketball, Tennis, Cycling, Water Sports
GDP Per Capita At a Glance
Year
GDP Per Capita
Significance
1964
$695
Euro Win
1982
$5156
Hosted the FIFA WC
2005
$26451
Men’s Handball WC Win
2008
$35603.2
Euro Win
2010
$30658.7
WC Win
6. Portugal ($30,950)
One-Sport Dominant Nation
What was Portugal’s GDP per capita at their first major sporting event? $18,064.2 (2004 Euro Finalists)
Current Socioeconomic Stats
GDP: $319.93
Population: 10.34 Million
GDP Per Capita: $30,950
Population Under Poverty (WB): 0.23% (2021)
Population Under Poverty (National): 16.40% (2021)
2024 Paris Olympic (Total Medals): 4
Most Popular Sports in Portugal: Soccer, Futsal, Cycling
GDP Per Capita At a Glance
Year
GDP Per Capita
Significance
1966
$601.3
FIFA WC 3rd Place
2000
$11526.4
Futsal WC 3rd Place
2006
$19839.5
WC 4th Place
2016
$19980.3
Euro Win
7. Croatia ($25,080)
One-Sport Dominant Nation
What was Croatia’s GDP per capita at their first major sporting event? $5,712.6 (1998 FIFA WC Semi-Finals)
Current Socioeconomic Stats
GDP: $96.03 Billion
Population: 3.83 Million
GDP Per Capita: $25,080
Population Under Poverty (WB): 0.31% (2021)
Population Under Poverty (National): 18% (2021)
Global Hunger Index: < 5 (2024), 5.5 (2000)
2024 Paris Olympic (Total Medals): 7
Most Popular Sports in Croatia: Soccer, Basketball, Handball, Water Polo
Year
GDP Per Capita
Significance
1998
$5712.6
FIFA WC 3rd Place
2018
$15460.4
WC Runners-Up
2022
$18466.1
WC 3rd Place
8. Argentina ($12,050)
One-Sport Dominant Nation
What was Argentina’s GDP per capita at their first major sporting event? $3282.1
Current Socioeconomic Stats
GDP: $574.2 Billion
Population: 47.64 Million
GDP Per Capita: $12,050
Population Under Poverty (World Bank): 0.61% (2022)
Population Under Poverty (National): 39.20% (2022)
Global Hunger Index: 6.6 (2024), 6.6 (2000)
2024 Paris Olympic (Total Medals): 3
Most Popular Sports in Argentina: Soccer, Polo, Field Hockey
GDP Per Capita At a Glance
Year
GDP Per Capita
Significance
1978
$3282.1
FIFA WC Win
1986
$3436.1
WC Win
2014
$12233.1
WC Runners-Up
2022
$13935.7
WC Win
9. Brazil ($10,820)
One-Sport Dominant Nation. In-Transit to Become a Multi-Sports Nation
What was Brazil’s GDP per capita at their first major sporting event? $235.3 (1958 & 1962 FIFA World Cups)
Current Socioeconomic Stats
GDP: $2.31 Trillion
Population: 213.32 Million
GDP Per Capita: $10,820
Population Under Poverty: 3.5% (2022)
Global Hunger Index: 6.6 (2024), 11.7 (2020)
2024 Paris Olympic (Total Medals): 20
Most Popular Sports in Brazil: Soccer, Volleyball, Basketball, Martial Arts, Futsal
The combined Summer/Winter Olympics tally leaderboard are as follows: United States (3095 medals), Soviet Union (1204), Great Britain (1014), France (961), Germany (960), China (804), Italy (799), Sweden (690), Australia (619), Japan (618), Canada (578), Norway (576), Russia (542), Hungary (540), etc. These countries also happen to be the most developed countries.
On the other end of the spectrum, the following countries only have 1 Olympic medal: Guyana, Iraq, Senegal, Barbados, Paraguay, Sudan, Virgin Islands, Netherlands Antilles, Gabon, Togo, Burkina Faso, Mauritius, Samoa, Tonga, Djibouti, Cape Verde, Dominica, Turkmenistan, Eritrea, Montenegro. You get the point.
Burkina Faso would send its first Olympian in the 1972 Munich Olympics, when its GDP per capita was $99.6. In 1988, they sent 6 athletes ($301.1). When Djibouti won its bronze in 1988, it had a GDP per capita of $878.9.
1. USA ($89,680)
Global Sports Superpower
Current Socioeconomic Stats
GDP: $30.3 Trillion
Population: $338.29 Milllion
GDP Per Capita: $89,680
Population Under Poverty: 1.25% (2022)
2024 Paris Olympic (Total Medals): 126
Most Popular Sports in USA: American Football, Basketball, Baseball, Ice Hockey, Golf, Track and Fields, Tennis, Soccer
GDP Per Capita At a Glance
Year
GDP Per Capita
Significance
1960
$2999.9
71 Olympic Medals
1984
$17121.2
174 Medals
1991
$24342.3
Women’s WC Win
2002
$37997.7
Men’s WC Reaches its first Quarter Finals
2019
$65604.7
Women’s 4th WC Win
2. China ($13,870)
Global Sports Superpower
Current Socioeconomic Stats
GDP: $19.53 Trillion
Population: 1.41 Billion
GDP Per Capita: $13,870
Population Under Poverty: 0% (2021)
Global Hunger Index: < 5 (2024), 13.4 (2000)
China’s Global Hunger Index Trends
Year
GHI
Olympic Medals
2000
13.4
58
2008
7.2
100
2016
< 5
70
2024
< 5
91
2024 Paris Olympic (Total Medals): 91
Most Popular Sports in China: Table Tennis, Badminton, Swimming, Martial Arts, Basketball
GDP Per Capita At a Glance
Year
GDP Per Capita
Significance
1984
$250.7
32 Olympic Medals
2000
$959.4
58 Medals
2008
$3468.3
100 Medals, Hosted Olympics
2022
$10408.7
15 Medals at Winter Olympics (China’s Best Show)
3. Japan ($35,610)
Global Sports Superpower
Current Socioeconomic Stats
GDP: $4.39 Trillion
Population: 123.26 Million
GDP Per Capita: $35,610
Population Under Poverty: 0.73% (2013)
2024 Paris Olympic (Total Medals): 45
Most Popular Sports in Japan: Baseball, Sumo Wrestling, Soccer, Martial Arts
GDP Per Capita At a Glance
Year
GDP Per Capita
Significance
1960
$508.7
18 Medals
1982
$9780
Baseball World Cup Runners-up
2006
$35991.5
World Baseball Classic Win
2011
$48760.1
Women’s WC Win
2020
$40040.8
58 Medals, Hosted Olympics
4. Republic of Korea ($37,670)
Global Sports Superpower
*South Korea
Current Socioeconomic Stats
GDP: $1.95 Trillion
Population: 51.68 Million
GDP Per Capita: $37,670
Population Under Poverty: 0% (2021)
2024 Paris Olympic (Total Medals): 32
Most Popular Sports in South Korea: Soccer, Baseball, Archery, Golf, Taekwondo
GDP Per Capita At a Glance
Year
GDP Per Capita
Significance
1982
$1992.5
Baseball World Cup Win
1988
$4748.6
Hosted Olympics, 33 Medals
2002
$13165.1
FIFA WC 4th Place
2005
$19402.5
Baseball WC Runners-up
5. Canada ($55,890)
Global Sports Superpower
Current Socioeconomic Stats
GDP: $2.33 Trillion
Population: 41.7 Million
GDP Per Capita: $55,890
Population Under Poverty: 0.25% (2019)
2024 Paris Olympic (Total Medals): 27
Most Popular Sports in Canada: Ice Hockey, Lacrosse, Soccer, Basketball, Baseball, Athletics
GDP Per Capita At a Glance
Year
GDP Per Capita
Significance
1976
$8838.9
Hosted Summer Olympics, 11 Medals
1984
$13930.5
44 Medals, Canada’s Best Show
2002
$24256
Ice Hockey Olympic Gold
2010
$47560.7
Hosted Winter Olympic Medal, 26 Medals
2015
$43594.2
Hosted Women’s FIFA WC
6. Russia/USSR ($15,080)
Global Sports Superpower
Current Socioeconomic Stats
GDP: $2.2 Trillion
Population: 145.63 Million
GDP Per Capita: $15,080
Population Under Poverty (WB): 0.18% (2021)
Population Under Poverty (National): 12.10% (2010)
2020 Tokyo Olympic as ROC (Total Medals): 71
Most Popular Sports in Russia: Soccer, Ice Hockey, Gymnastics, Figure Skating
GDP Per Capita At a Glance
Year
GDP Per Capita
Significance
1990 (USSR)
~$9200
USSR Dissolves
1996 (Russia)
$2643.9
Russia Re-enters the Olympics, 89 Medals
2016
$8663.2
56 Medals
Final Thoughts and Future Work
In the future, it would be interesting to analyze countries that dominate less accessible sports like golf or sports in the Winter Olympics. Also nations like Sweden, Norway, Belgium, Uruguay, Czech Republic, Hungary, and Mexico were out of scope for this study, but would be interesting to look at in the future.
Another way to go is to look at the understood how America’s economy is able to support multiple flourishing sports league (NFL, College Football, College Basketball (Men’s/Women’s), NBA, MLS, etc.)
Also, why aren’t Ireland better at cricket? I was surprised to see that they are financially a lot more stable than other nations. The next step would be to look at social policies and government investments to study how countries can start winning consistently at an international stage after they have satisfied the bare minimum economic conditions.
In any case, thank you all for reading. Appreciate y’all! Comment below on what you think!
And please, share, subscribe to our social media channels (X, Facebook) and other platforms (Substack, Medium)
Niccolò Machiavelli argued in his famous political treatise, The Prince, that it is “much safer to be feared than to be loved.”
The BCCI has taken that philosophy to heart, wielding its soft power in ways that are gradually eroding trust in cricket.
The Champions Trophy may just be the tipping point.
The Accusations
Since cricket’s resumption after the financially and mentally taxing COVID-induced break, the BCCI has increasingly dictated terms. Subtle but significant decisions across the last four ICC tournaments have raised serious concerns.
2021 T20 World Cup: India’s last two matches were scheduled against Scotland and Namibia, conveniently positioned as the final group-stage fixtures—providing them the best chance to boost their NRR if needed.
Champions Trophy: On the flip side, in a format where an opening loss is nearly fatal, India starts against Bangladesh while their toughest fixture—New Zealand—is left until the end.
2024 T20 World Cup: Matches in the Caribbean were scheduled to suit Indian prime-time television, not local fans. It was decided ahead of the tournament that if India qualify for the 2024 T20 WC semi-final, they would get to play in Guyana irrespective of group stage standings.
Travel Disparities: In the same tournament, Sri Lanka had to face airplane delays and four flights at four venues, while India stayed in one location and had gap between their Sunday to Sunday matches.
And now, India are playing all their matches in the same venue at Dubai while South Africa take a trip from Pakistan to Pakistan via the UAE.
I am not claiming that this is outright corruption or that ICC tournaments are rigged. Far from it.
But, these are not mere coincidences either. It raises serious concerns about the independence of fixtures, and that independence is what keeps sport fair and compelling to watch.
South Africa flew out to Dubai from Karachi after playing England. Then flew back to Lahore barely 12 hours after landing in Dubai.
Ironically, it is Team India, one of the greatest ODI sides in modern history, that is suffering from this loss of trust.
Let’s take a look at the squad:
Virat Kohli – The greatest ODI Player of all time.
Rohit Sharma – Legendary opener, three double centuries, including a 264-run masterpiece.
Shreyas Iyer – Resolved India’s #4 conundrum and as Abhishek AB on Twitter mentioned, the only #4s with a 100+ SR and 50+ average.
KL Rahul – The finest #5 batter of this generation.
Shami – India’s best ICC ODI bowler.
– 54 batters have scored 1500+ runs at No.4 in ODIs. – Only 7 of them averaged 50+ at this position. – But among them, just one has a 100+ strike rate.
Besides the core, you have the all-rounder engine room of Axar Patel, Hardik Pandya, and Ravindra Jadeja. They can be the insurance policy and arrest the slide when wickets fall early or provide the finishing touch. On the field, they can stall opposition with economical spells, timely wickets, catches, and game-changing run-outs.
If the opposition somehow manages to get through these eight, then they pray that they do not run into ICC #1 Shubman Gill, the guile of Varun Chakravarthy, or Kuldeep Yadav’s artistry. The likes of Rishabh Pant are carrying drinks, and Jasprit Bumrah, Yashasvi Jaiswal, Abhishek Sharma, Tilak Verma, and Sanju Samson are not even in the squad.
Since 2011, India has lost just seven ICC ODI World Cup and Champions Trophy matches out of 51. England lost six in the 2023 World Cup alone.
Yet, because of the UAE-Pakistan hosting fiasco, even die-hard cricket fans are now questioning the seriousness of this tournament. Heck, Peter Della Penna is not even watching the tournament at all!
I haven't watched a single ball of this Champions Trophy, first time I've not watched a major ICC event since 2005. I can't exactly call it a boycott. I just can't watch it seriously with a straight face when the thumb is so blatantly on the scales for one team vs all others. https://t.co/ZIZWqhsI3S
— Peter Della Penna (@PeterDellaPenna) March 5, 2025
The Needless UAE Debate
This Indian side is one of the most balanced ODI sides in recent memory. However, the focus in the last couple of weeks has diverted to an unnecessary debate. Nasser Hussain & Mike Atherton claimed that India had an ‘undeniable advantage.’
Rassie van der Dussen pointed out that “If you can stay in one place, stay in one hotel, practice in the same facilities, play in the same stadium, on the same pitches it’s definitely an advantage. I don’t think you have to be a rocket scientist to know that.”
(Side note: As someone who has been stranded a bazillion times in the Dallas Fort Worth airport, I can relate to David Miller’s frustrations. Once, I almost landed at my destination only for the plane to turn sent back to Dallas due to a tornado warning, forcing me to sleep in the airport — I get it, David. Flights have a way of ruining a good night’s sleep or an entire weekend, but that’s a whole other story.)
When the Nasser Hussain’s of the world question India’s authority, the whole world erupts. Journalists, fans, cricketers all weigh in, and the Indian Newtonian brigade swiftly respond with their equal and opposite stingers.
As CricBlog argues, India only playing in the UAE isn’t really that much of an advantage as critics claim.
Frankly, they could have broken the 400 barrier in the flat pitches of Pakistan. This team would have dominated anywhere.
The point isn’t whether India needs these advantages — it’s that they exist at all.
And dude, these players are accustomed to playing double Super Overs on a Sunday night into Monday morning for IPL matches, squeezing interviews and sponsorship committments, getting a few of hours of sleep, and traveling to another city for a game just 36 hours later. The kind of relentless schedule and travel is the reality for today’s IPL generation of professional athletes.
Hypocrisy, Thy Name is India
As William Shakespeare most certainly did not say, “Hypocrisy, Thy Name is India.”
The BCCI’s stance on cricketing relations with Pakistan is simple: “We refuse to play bilateral cricket Pakistan due to geopolitical reasons. We will not play them at all (well, of course, except in the cases of money, TV rights, and yep that’s about it, money).
When ICC tournaments were held every four years, I could understand the financial weight India-Pakistan matches carried, but with these tournaments happening every year now, the matches no longer hold the same significance. And honestly, they have become predictably boring.
The argument always has been, the ICC earnings from these encounters would be reinvested into grassroot cricket and growth of the game worldwide. Growth of cricket, my foot!
In a Big-3 led 10-team World Cup sport, the ICC’s exploitation of India-Pakistan is just a cash cow, stripping ICC fixtures of their independence and adding logistical burden for every other nation. As Jarrod Kimber rightly exclaimed on this point, “Can we just grow up as sport?”
Mohammed Shami admits that playing all their Champions Trophy matches in Dubai has been an advantage for India 🗣️ pic.twitter.com/5FrE3fPmAf
In school, sometimes a new kid arrives and gets all the attention. In the cricket world, India is the new (financial) kid. And they also happen to be the smartest student in the room.
Social media is already pandering to Indian audiences due to the views and monetization. Not only has the tune of the high level administrators become more rosy towards India, but YouTube channels of Pakistani cricketers, podcasts from Australia and England — EVERYbody caters to Indian audiences.
Is that a bad thing? No, can actually be pretty entertaining to be honest.
Nobody questions the BCCI anymore. Everyone just quietly wants to be friends with them and take a piece of the pie.
Remember in 2003 when teams accused Ricky Ponting of playing with a “spring bat”? How could a team be so good (and slightly arrogant). Well, India is that team now, and the BCCI is that board.
The ICC-B team, also known as the BCCI, need to clean up their image.
We love the cricketers.
Let us enjoy the cricket too. I will end it with the complete quote from Machiavelli:
“It is much safer to be feared than loved because….love is preserved by the link of obligation which, owing to the baseness of men, is broken at every opportunity for their advantage; but fear preserves you by a dread of punishment which never fails.”
On the day when the cricketing world was consumed by the overhyped dullness known as the India-Pakistan non-rivalry, the retirement of legendary writer Ian Chappell almost went unnoticed.
Chappell, cricket’s voice of reason, officially retired from writing at the age of 81.
His final piece for ESPNCricinfowas titled, “The time has come to put down the pen and pack away the computer” and In theMid-Day, it was even more blunt, “That’s it folks, I’m done.”
Ian Chappell has called time on his journalistic career. After writing his first column in November 1973, his last piece appears in today’s @mid_day. Well played, Chappelli. pic.twitter.com/MsvgWE0QYO
For someone who had shaped so many of my views on cricket, it felt like an end of an era. Here is what Ian Chappell meant to me.
Carrying Cricket’s Moral Burden
Chappell wrote for nearly 50 years — writing tribute articles, analyzing batting techniques, recalling lovely cricket stories, reviewing World Cups and Test Series, and much more.
But what will I miss the most?
Without a doubt, I will miss his “Doom and Gloom” cricket articles. You can get a gist of these articles by the titles themselves:
It felt as if Chappell was carrying cricket’s burden on his own shoulders.
Throughout his career, he served as one of cricket’s two moral fulcrums, calling out administrators and shedding light on the game’s deeper issues. (The other one being, Michael Holding).
You may agree with his views, you may not. But what you cannot deny is that Chappell never shied away from using his voice.
He called it how he saw it and did not bow down to the tactics of regulation media.
How Ian Chappell’s Writing Style Influenced My Own Writing
As Mama Bear from Goldilocks would say, Chappell’s articles were never too long, nor too short, they were “just right.”
He did not fill his posts with flowery language or movie quotes. He got straight to the point.
I never realized that I admired Ian Chappell until I reflected upon my own style of writing.
Over the years, I have been drawn to Harsha Bhogle’s command of language, George Dobell’s simplicity, Andrew Fidel Fernando’s satirical ingenuity, Melinda Farrell’s insightful interviews, and Jarrod Kimber’s versatility in content creation.
Little did I realize, though, that Chappell’s approach had subtly influenced my own writing style and ideas. Here are a few examples:
Chappell did it all — radio, newspaper, TV, published books. To excel in one career in remarkable achievement. He did it in two. Don’t forget, he had earlier scored over 5,000 Test runs, 14 centuries, averaged 48.07 in the new ODI format, and enjoyed a nearly 20-year first-class career.
To build a legacy across separate careers spanning generations is a story that deserves accolades. His influence on Australian cricket and cricket media was second to none.
If cricket ends up collapsing in the future due to the Big 3 takeover, imbalance of formats, influx of T20 leagues, overkill of cricket, incompetence of the ICC, or corruption— All I can say is that Ian Chappell warned us.
I will leave y’all with this quote from Chappell’s final Cricinfo article:
“A justifiable part of writing is, it’s all your own work — it might be rubbish, but at least it’s your rubbish.”
Ian Chappell, ESPNCricinfo
It wasn’t rubbish at all, Ian. Each and every word was well worth it.
Thoughts and ideas live forever. Your legacy lives on. You have changed cricket for the better. What a spectacular journey it has been. Happy Retirement.
“The ICC is widely regarded as an event management company. They should add ‘and not a very good one.'”
“Creating a balance between the financial rewards of T20 and the need to full test players in longer contests in a big challenge. The question is, do the administrators have a duty of care to talented kids of the future so they have the opportunity to experience the thrill of Test cricket?“
“An international schedule that has lately flourished like a mushroom in the dark is now resembling a block of Jarlsberg cheese with its trademark holes.”
In The Alchemist, a young shepherd named Santiago from the Andalusian region of Spain leaves his simple life to chase a dream, which he calls his ‘Personal Legend.’
He embarks on a journey of self-discovery filled with unexpected twists and turns.
Along the way, he learns several life lessons. One of my favorites is,
“When you want something, all the universe conspires in helping you achieve it.”
– Paul Coelho, The Alchemist
****
New Zealand Lift the 2024 T20 Women’s World Cup
Just like Santiago, today we celebrate Sophie Devine’s incredible journey. After 14 long years, the universe has conspired to help Sophie Devine finally lift the T20 World Cup Trophy, this time as captain.
Remember, the White Ferns narrowly missed out on World cup glory in the inaugural 2009 and 2010 T20 World Cup editions.
What Happened in the 2010 T20 World Cup Final, You Ask?
14 years ago, the Boot Happened.
The Boot? Yes, the boot.
Specifically, Ellyse Perry’s boot.
5 runs needed in the final ball, 4 runs for a Super happen. Watch what happens yourself.
Sophie hit a crisp straight drive, only to be denied by Ellyse Perry.
She was stranded on 38*, just one hit away from a World Cup.
Sophie Devine must have been devastated. Unfortunately, it was not meant to be. In her own words,
“I have had nightmares about that Ellyse Perry right boot. Think we were so close in that match.”
Her love for sports came through her dad, who was also her first coach. She grew up playing all sorts of different sports but cricket & field hockey took center stage as she entered university.
She became the White Ferns captain in 2020 during the form of her life and the 2024 T20 World Cup was to be her last T20 tournament as captain.
“It’s Only Those Who are Persistent, and Willing to Study Things Deeply, who Achieve the Master Work.”
Devine wasn’t always the power-hitting batter we now come to think of.
She actually burst onto the scene as a young 17-year old bowler who batted at #11.
In T20Is, she wouldn’t play a major match-winning innings until she was promoted to #4 in 2010, scoring 35 & 48 against Australia. She would score her first fifty in 2012. Devine didn’t even play a single ODI between 2010 and 2013. She would make an ODI comeback in 2013 and score her first ODI hundred, a magnificent 145, that too in a World Cup.
With the ball, she brought her best to the T20 World Cups – 3/18 and 4/22 (semi-final) in 2016, and 3/18 in the 2020 T20 World Cup.
Her evolution in turning herself into a dependable top order batter and one of the greatest all-rounders the world has ever seen is a testament to the hard work and dedication she put in to hone her craft.
Santiago found help in his journey—a merchant under whose tutelage he learned trade skills, a Gypsy who interpreted his dreams, an Englishman who knew alchemy, the love of his life in Fatima that gave him direction, a tribal chief, and many others who guided him along the way.
****
Devine similarly had a cast of members she could depend upon in the 2024 World Cup.
She embraced herself as one of the self-proclaimed ‘grandmas’ of the team. Alongside Devine were Suzie Bates, who became the most capped women’s player across formats (and fun fact, she also represented NZ in the 2008 Olympics as a basketball player) and Lea Tahuhu, once the fastest women bowler in the world.
They also had a cast of up and coming players such as Eden Carson, Georgia Plimmer, Brooke Halliday, Rosemary Mair, and a 24-year old Amelia Kerr who already has eight years of international cricket, an ODI double century, and (now) 188 international wickets to her name.
“The secret of life, though, is to fall seven times and to get up eight times.”
The senior trio must have known deep in their hearts that 2024 was their final chance.
Sophie Devine & Suzie Bates had fallen 8 consecutive times, and this was to be Tahuhu’s 5th T20 World Cup as well. Their recent T20 World Cup record didn’t ooze much confidence.
And there must have been some doubts creeping in as well.
After all, the White Ferns were coming off a 10-match losing streak.
Tahuhu’s economy in the previous 5 matches before the WC hovered between 8-12.5. Bates hadn’t made a half-century for 12 straight games even as an opener. Apart from two fifties, Devine had nothing to show with the bat with scores of 17, 0, 9, 5, 12, 4, and 5 in the entirety of 2024.
In any case, even after falling for eight times and the losing streak, they got up for a 9th time.
And as it would turn out, 9th time was the charm for Devine & Bates.
“Sometimes There is No Way to Hold Back The River”
So, how did the White Ferns manage to win the T20 World Cup against all odds?
Devine’s 57* and Mair’s 4/19 against India set the tone, but the World Cup victory was definitely a team effort.
Amelia Kerr’s historic all-round effort while limping in the final, en route to becoming the player of the tournament, was superhuman. Halliday’s impetus in the final, Tahuhu’s 1-run over that caused South Africa’s collapse, Eden Carson’s semi-final performance (and her interviews), the find of Georgia Plimmer, the spinners’ contribution, Gaze’s gaze behind the stumps, and Maddy Green’s catching, it all added up in the end.
No New Zealand batter made the Top 4 run scorer list (Bates & Plimmer were NZ’s best with 150 runs each at joint #5). With the ball, Kerr was #1 (15 wickets), with plenty of support from Mair (10) and Carson (9).
Fielding was a hallmark of New Zealand’s campaign in an otherwise low catching standard for a World Cup. Bates (7 catches), Maddy Green (6), and Devine (5) dominated the catching charts.
Devine doesn’t necessarily like the cringy ‘Devine intervention’, but this time, maybe it was divine intervention.
Sometimes, what is bound to happen will happen. Sometimes there is no way to hold back the river.
37-year-old Suzie Bates. 35-year-old Sophie Devine.
Two legendary players of New Zealand cricket have won the World Cup, What a day in Cricket ♥️ pic.twitter.com/WYpE8KzXkU
What Can We Learn from Sophie Devine and the White Ferns?
After narrowly missing on the 2010 T20 World Cup win and consecutive World Cup defeats, Devine and Bates never gave up. Sometimes the universe does conspire to reward those who refuse to quit.
I’ll leave you with a final Alchemist quote,
“People are capable, at any time in their lives, of doing what they dream of.”
– Paul Coelho, The Alchemist
It doesn’t matter whether you are beginning your career or are towards the close. It is never too late to dream. Keep on dreaming even if it looks like the hope is fading away.
This is a remarkable victory, one of the greatest in New Zealand’s sporting history for sure. Remember though, more than winning, the journey is important, as it was in both Santiago & Devine’s cases. In Devine’s own words,
“I have played for 17-18 years now. It [World Cup win] will be something that will come with so much loss and hard times but also incredible memories and people along the way.”
– Sophie Devine
And why not end it with my favorite clip of the 2024 T20 World Cup?
That got me thinking—How expensive is it to watch cricket around the world?
To conduct this analysis, I went through the checkout process and attempted to buy tickets for different types of matches in the first 10 Test playing nations.
If you would like to listen to an engaging conversational AI generated podcast about this article, check this out.
Key Takeaways
England & Australia are the most expensive places to watch cricket (they also have the most opportunities to watch along with India). Ticket prices can range from $185-1400 in a season for England to watch a couple of days of Tests, a few County matches, a few Hundred & Vitality Blast games, and 2-3 limited over internationals.
On the other hand, in Bangladesh, Sri Lanka, and Zimbabwe, a fan can watch matches for as low as $1 USD and can watch several games in a season for about $100 on the higher end.
Watching domestic cricket is completely FREE in India, New Zealand, and South Africa (both List A & 4-day). All you need to do is show up at the stadium (So GO, what are you waiting for?)
Cost of Watching Cricket: Most Expensive Places to Watch Cricket Around the World
We will provide ranges and consider a few different categories (if data is available):
Limited Over Internationals (LOI) – both men’s & women’s
Test Matches
Domestic Competitions
Franchise Leagues
For the sake of the cost comparison, we will be looking at General Admission ticket for Adult guests (in some countries like England, ‘members’ of the club receive discounted prices given that they have paid the annual membership fee). This analysis does not include member prices, bundles, or other discounts (or service/handling fees & taxes).
Note: These are ballpark ranges. Ticket prices may vary based on the match (for example, knockout and Finals matches may be more expensive) and the stadium.
If a spectator in England watched 2 days of a men’s Test, 5 County games, 1 men’s international, 2 Vitality Blast matches, 2 Hundred matches, 1 ODI cup, one women’s international, and 1 Women’s Hundred match in a season, they would spend (on tickets alone) between $260-$504 depending on the stadium and up to $1393.3 if they only chose premium seating.
Monthly Cost of Living: $1929
Average Monthly Net Salary: $3288.55
Annual Inflation Rate: 2.5%
Estimated Monthly Savings: $1359.55
Percent of Savings Spent on Cricket (Live): 4.54%-34.16%
*These economic numbers are for the United Kingdom as a whole, not just England.
Type of Match
General Admission Ticket Price (Adult)
Premium Tickets
A Day of a Test
£38-85 ($50.6-113.1)
£95-145 ($126.6-192.9)
Men’s LOI
£20-40 ($26.6)
£135 ($179.9)
Women’s LOI
£5-10 ($6.7-13.3)
£65 ($86.6)
County
£6-15 ($8.0-20.0)
£23 ($30.6)
Vitality Blast
£15-25 ($20-33.3)
£150 ($199.5)
The Hundred
£11 ($14.7)
£35 ($46.6)
One Day Cup
£5-20 ($6.7-26.6)
£37 ($49.2)
*These are ticket prices for non-members
How Did We Estimate the Ticket Price Range?
The international costs above are estimated from the upcoming England-Zimbabwe Test, India-England Women T20I series, and the men’s South Africa-England series, while the domestic costs are a ballpark number based on perusing several County’s websites.
Note: The prices for domestic price tickets in England vary vastly based on the County/stadium. For example, Kia Oval is at the more expensive side: £15-20 for County Championship matches, £32-40 for Vitality Blast, £40-85 for a men’s T20I, £18-30 for a women’s T20I, and £85-145 for a Test match.
Other Costs: Car Parking (£5+), Guided Tours: (£0-30), Full Season Membership (£240-270), Food, Drinks, Concessions (varies)
Where To Buy Tickets: Tickets can be purchased on the County, stadium, or ECB website. For international matches, you have to enter a ballot and hence, may not be guaranteed a ticket if there is high demand.
If a cricket fan in Australia went to watch 2 days of a men’s Test, 1 ODI, 1 Sheffield Shield match, 2 BBL matches, one women’s international, and 1 WBBL match in a season, they would spend (on tickets alone) at least $180 AUD ($122.6 USD)and as much as $900 $(613 USD) if they chose the premium seating.
Monthly Cost of Living: $1,944
Average Monthly Net Salary: $3,819.73
Annual Inflation Rate: 3.5%
Estimated Monthly Savings: $1875.73
Percent of Savings Spent on Cricket (Live):2.2%-10.89%
Day 4 Tickets: For the Boxing Day Test MCG, the General Admission has a starting price for $30 with reserve stands as high as $85.
Type of Match
General Admission Ticket Price (Adult)
Premium Tickets/Lounge/SkyDeck
A Day of a Test
$30 AUD ($20.4 USD)
$170 AUD ($115.8 USD)
Men’s LOI
$30 ($20.4)
$170 ($115.8)
Women’s LOI
$20 ($13.6)
Domestic Cricket
$10 ($6.8)
Franchise Cricket(BBL)
$27.5 ($18.7)
$165 ($112.4)
WBBL
$10 ($6.8)
*Note: For some Tests (for example, Adelaide BGT, there are ‘Twilight Adult’ prices if the entry is after 5 PM at a discounted price of $22.5).
Watching 2 days of a Test, 2 SuperSmash matches, a men’s limited overs game, and a women’s limited over game can cost anywhere between $109 to $160 in a season.
Monthly Cost of Living: $1782
Average Monthly Net Salary: $3156.96
Annual Inflation Rate: 3.1%
Estimated Monthly Savings: $1,374.96
Percent of Savings Spent on Cricket (Live):1.96%-2.81%
Type of Match
General Admission Ticket Price (Adult)
Premium Tickets
A Day of a Test
$45 NZD ($28 US)
$70 NZD ($43.6)
Men’s LOI
$35 ($21.8)
$65 ($40.5)
Women’s LOI
$20 ($12.5)
Domestic Cricket
FREE
SuperSmash
$15 ($9.4)
*Note: A Test Match Pass (all 5 days) can be purchased, which ranges from $145-220 NZD.
Entry to Plunkett Shield (first class) and Ford Trophy (List A) are free.
Two days of a men’s Test, 1 Men’s ODI, 1 Women’s ODI, and 2 SA20 matches in Bangladesh would cost a spectator somewhere in the range of $44-89 in one season.
Monthly Cost of Living: $974
Average Monthly Net Salary: $1446.04
Annual Inflation Rate: 4.9%
Estimated Monthly Savings: $472.04
Percent of Savings Spent on Cricket (Live):3.1%-6.3%
In India, watching 2 days of a men’s Test, 1 ODI, 2 IPL matches, 1 women’s international, and 1 WPL match in a season, would cost (on tickets alone) between $30-140 on the lower end and about $294 on the higher end over a season. Keep in my end, that or certain IPL teams like RCB, tickets can go as high as $634 alone!
Monthly Cost of Living: $423
Average Monthly Net Salary: $633.49
Annual Inflation Rate: 4.6%
Estimated Monthly Savings: $210.49
Percent of Savings Spent on Cricket (Live): 14.25%+
*This is a bit skewed since population of India has widespread economic disparity. Those who can probably afford to purchase tickets are the only ones that would purchase those premium/VIP tickets.
Type of Match
General Admission Ticket Price (Adult)
Premium/VIP
A Day of a Test
INR 125-200 ($1.5-2.4)
INR 1000-2000 ($12-24)
LOI
INR 750 ($9)
INR 10000 ($119.8)
Women’s International
FREE*
INR 150 ($1.8)
Domestic Cricket
FREE
IPL
INR 700-5000 ($8.4-60)
INR 5000-52938 ($59.9-$634.4)
WPL
INR 100-500 ($1.2-6)
As per Hindustan Times, “Pricing is decided as per demand and supply, affordability, culture, and the eagerness of the people to pay” when it comes to IPL prices. Hence, there is a wide range in IPL tickets depends on which player/teams are playing and when the ticket has been purchased.
Here are some other notes:
Non-international matches are free to attend.
*The entry to women’s Test between India & South Africa was free, while the T20Is were priced for INR 150.
Long story short, watching sports can be a fun and expensive experience.
Final Thoughts
The main thought of writing this article was to answer the question, “Is cricket affordable for the common man?”
With rising cost of living standards around the world and mobile/TV accessibility of cricket, are boards doing enough to incentivize followers to go to the ground?
In general, cricket is not as expensive as other sports. However, if Test cricket is to survive, £95 Day 4 tickets is probably not going to help.
If the trend continues, cricket will become only an elitist game. It began as an elitist game, but do we want to keep it that way?
If you are interested in cricket & finance, consider checking out the following:
Today we will discuss the salary of a Pakistan Super League (PSL) player in Pakistan.
The PSL has finally become profitable over the last couple of years, and big names like Babar Azam, Shaheen Shah Afridi, and Haris Rauf make this a T20 competition to behold.
However, there’s one question on every cricket fan’s mind: just how much do these players make?
PSL Salary – By the Numbers
The average salary of a Pakistan Super League (PSL) player is $66,667 or about 1.89 Crore PKR (maximum 18 players in the squad with a salary cap of $1.2 million or 33.6 Crore PKR). Hence, the maximum amount spent in the entire PSL draft was $7.2 million for a maximum of 108 players, divided among 6 teams.
The average salary for a domestic Pakistan Super League player is $61,824 or 1.72 Crore PKR ($4.575 million spent for a total of 74 domestic players). The average salary for an overseas PSL cricketer is $77,206 or 2.16 Crore PKR ($2.625 million spent for 34 signed overseas players).
The Pakistan Super League (PSL) – How Much Was Each Draft Pick?
Draft Picks
Average Salary Amounts
Platinum
$150,000 (4,19,58,000 PKR)
Diamond
$72,500 (2,02,79,700 PKR)
Gold
$45,000 (1,25,87,400 PKR)
Silver
$20,000 (55,94,400 PKR)
Emerging
$7,500 (20,97,900 PKR)
Supplementary
$50,000 (1,39,86,000 PKR)
Conversion Rate: As of 12/18/2023, $1 United States Dollar (USD) = 279.72 Pakistan Rupee (PKR)
PSL 2024 Draft Picks – Salary of Pakistan Super League Player
According to The Cricketer in PSL (2021), here were the price ranges for each of the different categories. In the last three years, there has not been any changes to this structure. In addition, a range has been provided for each category. However, the exact amounts for a particular player are unknown.
Shadab Khan, Naseem Shah, Jordan Cox (Islamabad United), Kieron Pollard, Daniel Sams, Mohammad Nawaz (Karachi Kings), Shaheen Shah Afridi, Fakhar Zaman, Rassie van der Dussen (Lahore Qalandars), Mohammad Rizwan, Iftikhar Ahmed, David Willey (Multan Sultans), Babar Azam, Rovman Powell, Noor Ahmad (Peshawar Zalmi), Rilee Rossouw, Sherfane Rutherford, Mohammad Amir (Quetta Gladiators)
Azam Khan, Imad Wasim, Tymal Mills (Islamabad United), Tim Seifert, James Vince, Hasan Ali (Karachi Kings), Haris Rauf, David Wiese, Sahibzada Farhan (Lahore Qalandars), Khushdil Shah, Usama Mir, Dawid Malan (Multan Sultans), Saim Ayub, Tom Kohler-Cadmore, Asif Ali (Peshawar Zalmi), Mohammad Wasim Jnr, Jason Roy, Wanindu Hasaranga (Quetta Gladiators)
Rumman Raees, Matthew Forde, Salman Ali Agha, Qasim Akram, Shahab Khan (Islamabad United), Mir Hamza, Muhammad Akhlaq, M Amir Khan, Anwar Ali, Arafat Minhas (Karachi Kings), Mirza Tahir Baig, Rashid Khan, Mohammad Imran Jnr, Dan Lawrence, Ahsan Bhatti (Lahore Qalandars), Ihsanullah, Tayyab Tahir, Shahnawaz Dahani, Mohammad Ali, Usman Khan (Multan Sultans), Khurram Shahzad, Salman Irshad, Arif Yaqoob, Umair Afridi, Daniel Mousley (Peshawar Zalmi), Will Smeed, Saud Shakeel, Sajjad Ali Jnr, Usman Qadir, Omair Bin Yousaf (Quetta Gladiators)
5. Emerging Round Draft Pick ($7,500/21 Lakh PKR)
Price: $7,500 (20,97,900 PKR)
Hunain Shah, Ubaid Shah (Islamabad United), Sirajuddin, M Irfan Khan (Karachi Kings), Jahandad Khan, Syed Faridoun (Lahore Qalands), Faisal Akram, Yasir Khan (Multan Sultans), Haseebullah Khan, Mohammad Zeeshan (Peshawar Zalmi), Adil Naz, Khawaja Nafay (Quetta Gladiators)
Frequently Asked Questions (FAQ) – Salary of Pakistan Super League (PSL) player
What is the average salary for a Pakistan Super League (PSL) player in Pakistan?
The average salary of a Pakistan Super League (PSL) player is $66,667. Each PSL team has a purse of $1.2 million for 18 total players.
Is Pakistan Super League (PSL) the richest cricket league in the world?
No, the Indian Premier League (IPL) is the richest cricket league in the world. The PSL is the sixth richest cricket league in the world (based on average player salary).
Who was the most expensive player in the PSL 2024 draft?
The most expensive players in the PSL 2024 draft were as follows: Shadab Khan, Naseem Shah, Jordan Cox (Islamabad United), Kieron Pollard, Daniel Sams, Mohammad Nawaz (Karachi Kings), Shaheen Shah Afridi, Fakhar Zaman, Rassie van der Dussen (Lahore Qalandars), Mohammad Rizwan, Iftikhar Ahmed, David Willey (Multan Sultans), Babar Azam, Rovman Powell, Noor Ahmad (Peshawar Zalmi), Rilee Rossouw, Sherfane Rutherford, Mohammad Amir (Quetta Gladiators). They all were the Platinum Draft Pick for their respective teams.
Here is a quick preview: India is going with experience to help them go all the way in this upcoming World Cup.
Let’s dive right in.
Key Takeaways from India World Cup 2023 ODI Squad
The average age of India Asia Cup 2023 squad is 32.7. India is going with a squad that has lots of experience but there are a couple of new faces as well. They have youngsters like Shubman Gill (24), and Ishan Kishan (25), On the other end of the spectrum, we havestalwarts like Ravichandran Ashwin (37), Virat Kohli (34) and Rohit Sharma (36).
The 15-member India’s World Cup squad has average ODI match experience of 97 ODIs (1449 ODIs among 15 players). Virat Kohli (281), Rohit Sharma (251) & Ravindra Jadeja (186) are their most experienced players.
India’s squad composition is as follows: 7 proper batters (0 part time bowlers), 4 all-rounders, and 4 proper bowling options. In total, India has 8 bowling options (1 off spin, 1 left arm spin, 1 left arm wrist spin, and 5 right arm pace) in their squad if absolutely needed. India do not have a leg-spinner or left arm pace bowler.
India has 2 left-handed batting options (Kishan) and two wicketkeeping options.
Axar Patel has been ruled out due to quadriceps strains.
KL Rahul has been nursing a back injury since IPL 2023. Shreyas Iyer has been out since the beginning of the year due to a thigh injury. They both returned to the fold.
Jasprit Bumrah is returning after a back injury. Prasidh Krishna is returning from a back injury as well. They have both returned, but Krishna did not make it to the final squad.
10 India Players Who Were Unlucky to Miss Out
Axar Patel, Yuzvendra Chahal, Washington Sundar, Bhuvneshwar Kumar, Arshdeep Singh, Deepak Chahar, Shikhar Dhawan, Ruturaj Gaikwad, Yashasvi Jaiswal, Ravi Bishnoi
Usually with India’s squads, you have a feeling of how the campaign is going to go.
This time, I cannot really say. With an overkill of cricket, ODIs have been squeezed out of the ODI calendar.
Add to that, KL Rahul, Shreyas Iyer, Bumrah, Prasidh Krishna are just coming out of injury, Tilak Verma has not played a single ODI, and Shami hasn’t played for a while. At the same time, there is discussion about who didnt’t make the squad, Yuzvendra Chahal & one of the off-spin options.
This is still a great squad, with a mix of youth & experience. My only concern is the lack of match time, recurring injuries, and relative instability.
But with home advantage, you never know. Can India repeat the magic of 2011? Have your say in the comments below!
Frequently Asked Questions – India World Cup 2023 Squad
What is the average age of India’s 2023 Cricket World Cup squad?
The average age of India Asia Cup 2023 squad is 32.7. India is going with a squad that has lots of experience but there are a couple of new faces as well. They have youngsters like Shubman Gill (24), and Ishan Kishan (25), On the other end of the spectrum, we havestalwarts like Virat Kohli (34) and Rohit Sharma (36).
Who is selected for India’s 2023 Cricket World Cup and India Asia Cup 2023 squad?
Rohit Sharma (C), Shubman Gill, Ishan Kishan (WK), Virat Kohli, Shreyas Iyer, KL Rahul, Ravindra Jadeja, Hardik Pandya, Ravichandran Ashwin, Kuldeep Yadav, Jasprit Bumrah, Shardul Thakur, Mohammad Shami, Mohammad Siraj, and Suryakumar Yadav made it in India’s 2023 Cricket World Cup squad.
Can India win the 2023 ODI World Cup?
Yes, India can win the 2023 ODI World Cup if they make full use of home conditions and home injuries do not occur anymore.
Will Bumrah play the 2023 ODI World Cup?
Yes, it seems that Jasprit Bumrah has recovered from his injury and will play in the 2023 ODI Cricket World Cup. Bumrah has been selected for the 2023 Asia Cup squad.
 (400 x 100 px) (4)")


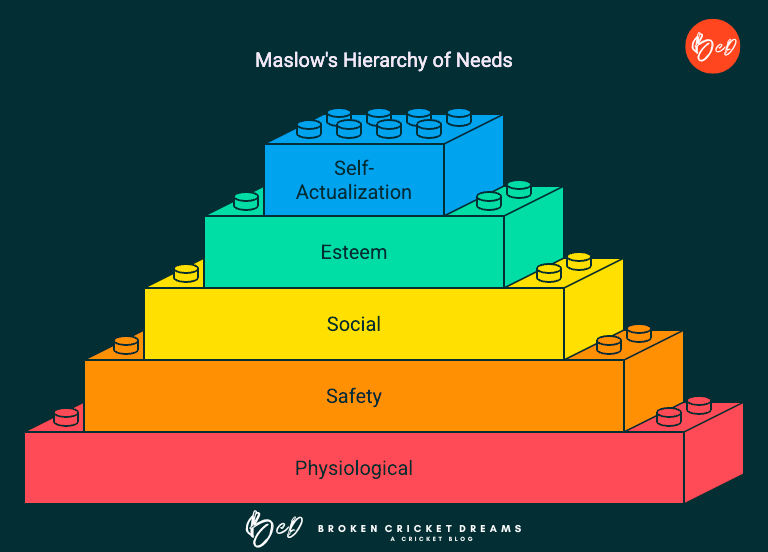


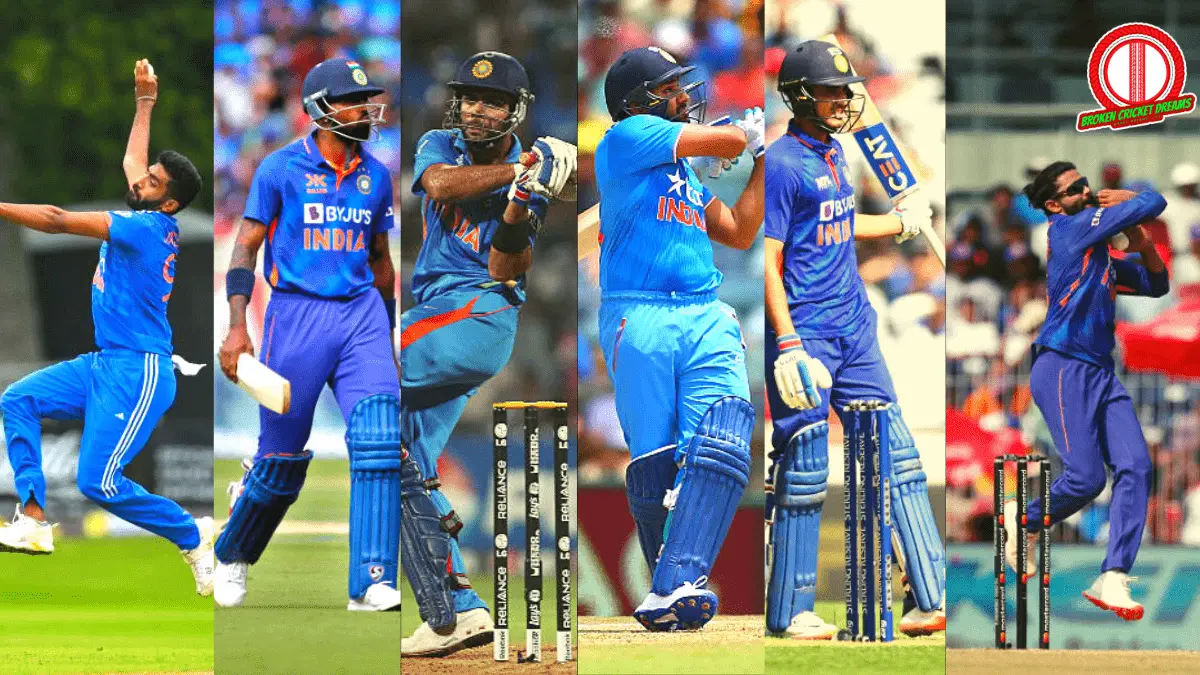
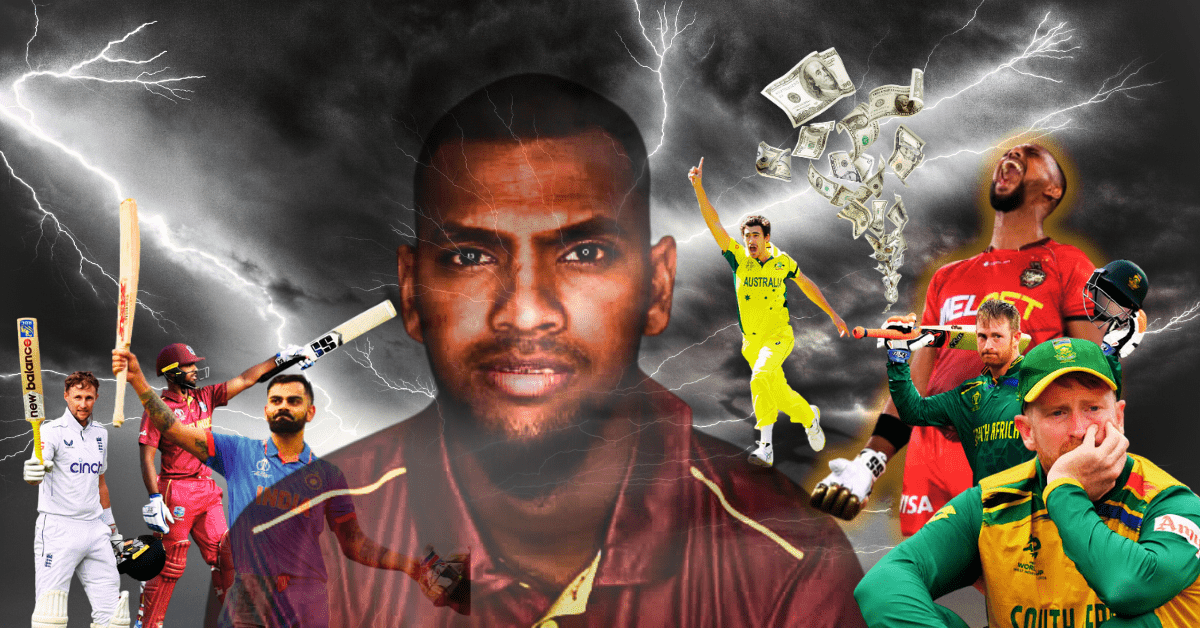