 (400 x 100 px) (4)")
Let’s discuss the most valuable IPL cricketers—with a twist.
In the 17 years of the Indian Premier League (IPL), which batter has provided the best return on investment in terms of hitting sixes? The #1 batter on this list may surprise you!
Let’s find out.
Key Takeaways
- Chris Gayle (357), Rohit Sharma (257), AB De Villiers (251), MS Dhoni (239), and Virat Kohli (234) have hit the most sixes in the IPL.
- Ambati Rayudu ($34,442), Chris Gayle ($37,808), Jos Buttler ($43,812), and Andre Russell ($45,430) have the best ratios of dollar per six in IPL history, while Rohit Sharma ($116,381), MS Dhoni ($119,280), and Virat Kohli ($120,470) have been the most expensive buys per six in this list.
- Andre Russell is just a beast in the frequency of sixes he hits. He takes approximately 6.74 balls per six, that is almost one per over! Russell is comfortably ahead of the other two West Indians on this list—Chris Gayle (9.34), Kieron Pollard (10.39) who are then followed by AB de Villiers (13.56), Yusuf Pathan (14.18), Jos Buttler (14.58), and Shane Watson (14.78).
- Chris Gayle (2.53), KL Rahul (1.54), and AB De Villiers (1.48) have the best ratio for the most sixes per innings.
Most Sixes in IPL Career
To begin our analysis, here is the list of players with the most number of sixes hit in the IPL.
| Player | Innings | Sixes |
| Chris Gayle | 142 | 357 |
| Rohit Sharma | 143 | 257 |
| AB de Villiers | 170 | 251 |
| MS Dhoni | 218 | 239 |
| Virat Kohli | 229 | 234 |
| David Warner | 176 | 226 |
| Kieron Pollard | 171 | 223 |
| Suresh Raina | 200 | 203 |
| Andre Russell | 96 | 193 |
| Shane Watson | 141 | 190 |
| Sanju Samson | 148 | 182 |
| Robin Uthappa | 197 | 182 |
| Ambati Rayudu | 187 | 173 |
| KL Rahul | 109 | 168 |
| Glenn Maxwell | 120 | 158 |
| Yusuf Pathan | 154 | 158 |
| Jos Buttler | 95 | 149 |
| Yuvraj Singh | 126 | 149 |
| Shikhar Dhawan | 218 | 148 |
Honorable Mentions: Faf du Plessis – 145, Dinesh Karthik – 139, Nitish Rana – 131, and Brendon McCullum – 130 miss out).
Top 19 Most Valuable Six Hitters in the Indian Premier League (IPL)
*Note: We have limited our analysis to the top 19 six hitters in the IPL (cutoff of 148 sixes).
Also note that before 2014, IPL auctions were held in US dollars. The auctions have been held in INR (Indian Rupees) ever since. For comparison, we have kept everything in $USD. The conversion we used is based on the $US dollar-INR conversation rate on that year (2008-2023) as shown in the table here.
Here is a quick preview of the Top 10 most valuable cricketers by the number of sixes hit versus the salary amount they were purchased at.
Let’s dive in!

1. Ambati Rayudu – 173 Sixes ($34,422 Per Six)
Since it took about $5,955,000 for his 173 sixes, Ambati Rayudu cost his franchises about $34,422 per six in the IPL.
- Teams: MI, CSK
- Matches/Innings: 204/187
- Runs (Balls): 4348 (3409)
- Strike Rate (Sixes/Fours): 127.54 (173/359)
Average IPL Salary: $425,357 ($5,955,000 over 14 seasons)
- Number of Balls Per Six: 19.71 (3409/173)
- Number of Sixes Per Innings: 0.93 (173/187)
Ambati Rayudu’s IPL Salary Over the Years
| Year | Team | Salary | Sixes |
| IPL 2010 | MI | $25,000 | 13 |
| IPL 2011 | MI | $66,000 | 9 |
| IPL 2012 | MI | $66,000 | 14 |
| IPL 2013 | MI | $66,000 | 4 |
| IPL 2014 | MI | $641,000 (INR 4 Crore) | 8 |
| IPL 2015 | MI | $641,000 (INR 4 Crore) | 16 |
| IPL 2016 | MI | $641,000 (INR 4 Crore) | 12 |
| IPL 2017 | MI | $641,000 (INR 4 Crore) | 3 |
| IPL 2018 | CSK | $346,000 (INR 2.2 Crore) | 34 |
| IPL 2019 | CSK | $346,000 (INR 2.2 Crore) | 7 |
| IPL 2020 | CSK | $346,000 (INR 2.2 Crore) | 12 |
| IPL 2021 | CSK | $346,000 (INR 2.2 Crore) | 17 |
| IPL 2022 | CSK | $892,000 (INR 6.75 Crore) | 15 |
| IPL 2023 | CSK | $892,000 (INR 6.75 Crore) | 9 |
2. Chris Gayle – 357 Sixes ($37,808 Per Six)
Since it took $13,497,500 for his 357 sixes, Chris Gayle cost his franchises about $37,808 per six in the IPL.
- Teams: KKR, RCB, PBKS
- Matches/Innings: 142/141
- Runs (Balls): 4965 (3333)
- Strike Rate (Sixes/Fours): 148.96 (357/404)
Chris Gayle’s Average IPL Salary: $1.038 Million ($13,497,500 over 13 seasons)
- Number of Balls Per Six: 9.34 (3333/357)
- Number of Sixes Per Innings: 2.53 (357/141)
Chris Gayle’s IPL Salary Over the Years
*Note: Chris Gayle withdrew from IPL 2008
| Year | Team | Salary | Number of Sixes |
| IPL 2009 | KKR | $800,000 | 10 |
| IPL 2010 | KKR | $800,000 | 16 |
| IPL 2011 | RCB | $650,000 | 44 (Replacement) |
| IPL 2012 | RCB | $2,000,000 | 59 (Retained) |
| IPL 2013 | RCB | $2,000,000 | 51 |
| IPL 2014 | RCB | $1,521,000 (INR 9.5 Crore) | 12 (Retained) |
| IPL 2015 | RCB | $1,521,000 (INR 9.5 Crore) | 38 |
| IPL 2016 | RCB | $1,521,000 (INR 9.5 Crore) | 21 |
| IPL 2017 | RCB | $1,521,000 (INR 9.5 Crore) | 14 |
| IPL 2018 | PBKS | $314,500 (INR 2 Crore) | 27 |
| IPL 2019 | PBKS | $283,000 (INR 2 Crore) | 34 |
| IPL 2020 | PBKS | $283,000 (INR 2 Crore) | 23 |
| IPL 2021 | PBKS | $283,000 (INR 2 Crore) | 8 |
3. Jos Buttler – 149 Sixes ($43,812 Per Six)
Since it took about $6,528,000 for his 149 sixes, Jos Buttler cost his franchises about $43,812 per six in the IPL.
- Teams: MI, RR
- Matches/Innings: 96/95
- Runs (Balls): 3223 (2173)
- Strike Rate (Sixes/Fours): 148.32 (149/319)
Jos Buttler’s Average IPL Salary: $816,000 ($6,528,000 over 8 seasons)
- Number of Balls Per Six: 14.58 (2173/149)
- Number of Sixes Per Innings: 1.57 (149/95)
Jos Buttler’s IPL Salary Over the Years
| Year | Team | Salary | Sixes |
| IPL 2016 | MI | $560,000 (INR 3.8 Crore) | 11 |
| IPL 2017 | MI | $560,000 (INR 3.8 Crore) | 15 |
| IPL 2018 | RR | $692,000 (INR 4.4 Crore) | 21 |
| IPL 2019 | RR | $692,000 (INR 4.4 Crore) | 14 |
| IPL 2020 | RR | $692,000 (INR 4.4 Crore) | 16 |
| IPL 2021 | RR | $692,000 (INR 4.4 Crore) | 13 |
| IPL 2022 | RR | $1.32 Million (INR 10 Crore) | 45 |
| IPL 2023 | RR | $1.32 Million (INR 10 Crore) | 14 |
4. Andre Russell – 193 Sixes ($45,430 Per Six)
Since it took about $8,768,000 for his 193 sixes, Andre Russell cost his franchises about $45,430 per six in the IPL.
- Teams: DD (Delhi Daredevils), KKR
- Matches/Innings: 112/96
- Runs (Balls): 2262 (1300)
- Strike Rate (Sixes/Fours): 174.00 (193/150)
Andre Russell’s Average IPL Salary: $797,091 ($8,768,000 over 11 seasons)
- Number of Balls Per Six: 6.74 (1300/193)
- Number of Sixes Per Innings: 2.01 (193/96)
Andre Russell’s IPL Salary Over the Years
| Year | Team | Salary | Sixes |
| IPL 2012 | DD | $450,000 | 3 |
| IPL 2013 | DD | $450,000 | 0 |
| IPL 2014 | KKR | $96,000 (INR 60 Lakh) | 0 |
| IPL 2015 | KKR | $96,000 (INR 60 Lakh) | 19 |
| IPL 2016 | KKR | $96,000 (INR 60 Lakh) | 15 |
| IPL 2017 | KKR | Withdrawn | – |
| IPL 2018 | KKR | $1.1 Million (INR 7 Crore) | 31 |
| IPL 2019 | KKR | $1.1 Million (INR 7 Crore) | 52 |
| IPL 2020 | KKR | $1.1 Million (INR 7 Crore) | 9 |
| IPL 2021 | KKR | $1.1 Million (INR 7 Crore) | 14 |
| IPL 2022 | KKR | $1.59 Million (INR 12 Crore) | 32 |
| IPL 2023 | KKR | $1.59 Million (INR 12 Crore) | 18 |
5. David Warner – 226 Sixes ($55,690 Per Six)
Since it took about $12,586,000 for his 226 sixes, David Warner cost his franchises about $55,690 per six in the IPL.
- Teams: DD (Delhi Daredevils), SRH, DC (Delhi Capitals)
- Matches/Innings: 176/176
- Runs (Balls): 6397 (4572)
- Strike Rate (Sixes/Fours): 139.91 (226/646)
David Warner’s Average IPL Salary: $899,000 ($12,586,000 over 14 seasons)
- Number of Balls Per Six: 20.23 (4572/226)
- Number of Sixes Per Innings: 1.28 (226/176)
David Warner’s IPL Salary Over the Years
| Year | Team | Salary | Sixes |
| IPL 2009 | DD | $30,000 (15 Lakh, Pre-Signing) | 5 |
| IPL 2010 | DD | $30,000 (15 Lakh) | 14 |
| IPL 2011 | DD | $750,000 | 11 |
| IPL 2012 | DD | $750,000 | 14 |
| IPL 2013 | DD | $750,000 | 14 |
| IPL 2014 | SRH | $881,000 (INR 5.5 Crore) | 24 |
| IPL 2015 | SRH | $881,000 (INR 5.5 Crore) | 21 |
| IPL 2016 | SRH | $881,000 (INR 5.5 Crore) | 31 |
| IPL 2017 | SRH | $881,000 (INR 5.5 Crore) | 26 |
| IPL 2018 | SRH | Withdrawn | – |
| IPL 2019 | SRH | $1.7 Million (INR 12 Crore) | 21 |
| IPL 2020 | SRH | $1.7 Million (INR 12 Crore) | 14 |
| IPL 2021 | SRH | $1.7 Million (INR 12 Crore) | 6 |
| IPL 2022 | DC | $826,000 (INR 6.25 Crore) | 15 |
| IPL 2023 | DC | $826,000 (INR 6.25 Crore) | 10 |
6. Kieron Pollard – 223 Sixes ($55,780 Per Six)
Since it took about $12,439,000 for his 223 sixes, Kieron Pollard cost his franchises about $55,780 per six in the IPL.
- Teams: MI
- Matches/Innings: 189/171
- Runs (Balls): 3412 (2316)
- Strike Rate (Sixes/Fours): 147.32 (223/218)
Kieron Pollard’s Average IPL Salary: $1.037 Million ($12,439,000 over 13 seasons)
- Number of Balls Per Six: 10.39 (2316/223)
- Number of Sixes Per Innings: 1.30 (223/171)
Kieron Pollard’s IPL Salary Over the Years
| Year | Team | Salary | Sixes |
| IPL 2010 | MI | $750,000 | 17 |
| IPL 2011 | MI | $900,000 (Retained) | 6 |
| IPL 2012 | MI | $900,000 | 14 |
| IPL 2013 | MI | $900,000 | 29 |
| IPL 2014 | MI | $1.2 Million (INR 7.5 Crore) | 15 |
| IPL 2015 | MI | $1.2 Million (INR 7.5 Crore) | 28 |
| IPL 2016 | MI | $1.2 Million (INR 7.5 Crore) | 16 |
| IPL 2017 | MI | $1.2 Million (INR 7.5 Crore) | 22 |
| IPL 2018 | MI | $849,000 (INR 5.4 Crore) | 7 |
| IPL 2019 | MI | $849,000 (INR 5.4 Crore) | 22 |
| IPL 2020 | MI | $849,000 (INR 5.4 Crore) | 22 |
| IPL 2021 | MI | $849,000 (INR 5.4 Crore) | 16 |
| IPL 2022 | MI | $793,000 (INR 6 Crore) | 9 |
7. Sanju Samson – 182 Sixes ($62,121 Per Six)
Since it took about $11,306,000 for his 182 sixes, Sanju Samson cost his franchises about $62,121 per six in the IPL.
- Teams: DC, RCB
- Matches/Innings: 152/148
- Runs (Balls): 3888 (2834)
- Strike Rate (Sixes/Fours): 137.19 (182/304)
Average IPL Salary: $942,166 ($11,306,000 over 12 seasons)
- Number of Balls Per Six: 15.57 (2834/182)
- Number of Sixes Per Innings: 1.23 (182/148)
Sanju Samson’s IPL Salary Over the Years
*Note: Sanju Samson did not play a single game in IPL 2012 but was still in the squad.
| Year | Team | Salary | Sixes |
| IPL 2012 | KKR | $22,000 (Did not play) | – |
| IPL 2013 | RR | $22,000 | 5 |
| IPL 2014 | RR | $641,000 (INR 4 Crore) | 17 |
| IPL 2015 | RR | $641,000 (INR 4 Crore) | 8 |
| IPL 2016 | DD | $620,000 (INR 4.2 Crore) | 8 |
| IPL 2017 | DD | $620,000 (INR 4.2 Crore) | 19 |
| IPL 2018 | RR | $1.26 Million (INR 8 Crore) | 19 |
| IPL 2019 | RR | $1.26 Million (INR 8 Crore) | 13 |
| IPL 2020 | RR | $1.26 Million (INR 8 Crore) | 26 |
| IPL 2021 | RR | $1.26 Million (INR 8 Crore) | 17 |
| IPL 2022 | RR | $1.85 Million (INR 14 Crore) | 26 |
| IPL 2023 | RR | $1.85 Million (INR 14 Crore) | 24 |
8. Yusuf Pathan – 158 Sixes ($65,863 Per Six)
Since it took about $10,406,400 for his 251 sixes, Yusuf Pathan cost his franchises about $65,863 per six in the IPL.
- Teams: RR, KKR
- Matches/Innings: 174/154)
- Runs (Balls): 3204 (2241)
- Strike Rate (Sixes/Fours): 142.97 (158/262)
Average IPL Salary: $867,200 ($10,406,400 over 12 seasons)
- Number of Balls Per Six: 14.18 (2241/158)
- Number of Sixes Per Innings: 1.03 (158/154)
Yusuf Pathan’s IPL Salary Over the Years
| Year | Team | Salary | Sixes |
| IPL 2008 | RR | $475,000 | 25 |
| IPL 2009 | RR | $475,000 | 12 |
| IPL 2010 | RR | $475,000 | 24 |
| IPL 2011 | KKR | $2.1 Million | 13 |
| IPL 2012 | KKR | $2.1 Million | 7 |
| IPL 2013 | KKR | $2.1 Million | 14 |
| IPL 2014 | KKR | $521,000 (INR 3.25 Crore) | 20 |
| IPL 2015 | KKR | $521,000 (INR 3.25 Crore) | 12 |
| IPL 2016 | KKR | $521,000 (INR 3.25 Crore) | 13 |
| IPL 2017 | KKR | $521,000 (INR 3.25 Crore) | 6 |
| IPL 2018 | SRH | $298,700 (INR 1.9 Crore) | 11 |
| IPL 2019 | SRH | $298,700 (INR 1.9 Crore) | 1 |
9. AB De Villiers – 251 Sixes ($65,976 Per Six)
Since it took about $16,560,000 for his 251 sixes, AB De Villiers cost his franchises about $65,976 per six in the IPL.
- Teams: DD (Delhi Daredevils), RCB
- Matches/Innings: 184/170
- Runs (Balls): 5162 (3403)
- Strike Rate (Sixes/Fours): 151.68 (251/413)
AB De Villiers’ Average IPL Salary: $1.183 Million ($16,560,000 over 14 seasons)
- Number of Balls Per Six: 13.56 (3403/251)
- Number of Sixes Per Innings: 1.48 (251/170)
AB De Villiers’ IPL Salary Over the Years
| Year | Team | Salary | Sixes |
| IPL 2008 | DD | $300,000 | 1 |
| IPL 2009 | DD | $300,000 | 12 |
| IPL 2010 | DD | $300,000 | 0 |
| IPL 2011 | RCB | $1.1 Million | 14 |
| IPL 2012 | RCB | $1.1 Million | 15 |
| IPL 2013 | RCB | $1.1 Million | 15 |
| IPL 2014 | RCB | $1.2 Million (INR 7.5 Crore) | 24 |
| IPL 2015 | RCB | $1.2 Million (INR 7.5 Crore) | 22 |
| IPL 2016 | RCB | $1.2 Million (INR 7.5 Crore) | 37 |
| IPL 2017 | RCB | $1.2 Million (INR 7.5 Crore) | 16 |
| IPL 2018 | RCB | $1.89 Million (INR 11 Crore) | 30 |
| IPL 2019 | RCB | $1.89 Million (INR 11 Crore) | 26 |
| IPL 2020 | RCB | $1.89 Million (INR 11 Crore) | 23 |
| IPL 2021 | RCB | $1.89 Million (INR 11 Crore) | 16 |
10. Shane Watson – 190 Sixes ($67,563 Per Six)
Since it took about $12,837,000 for his 190 sixes, Shane Watson cost his franchises about $67,563 per six in the IPL.
- Teams: RR, RCB, CSK
- Matches/Innings: 145/141
- Runs (Balls): 3874 (2809)
- Strike Rate (Sixes/Fours): 137.19 (182/304)
Shane Watson’s Average IPL Salary: $1.070 Million ($12,837,000 over 12 seasons)
- Number of Balls Per Six: 14.78 (2809/190)
- Number of Sixes Per Innings: 1.35 (190/141)
Shane Watson’s IPL Salary Over the Years
| Year | Team | Salary | Sixes |
| IPL 2008 | RR | $125,000 | 19 |
| IPL 2009 | RR | Withdrawn | – |
| IPL 2010 | RR | $125,000 | 9 |
| IPL 2011 | RR | $1.3 Million (Retained) | 17 |
| IPL 2012 | RR | $1.3 Million (Retained) | 14 |
| IPL 2013 | RR | $1.3 Million (Retained) | 22 |
| IPL 2014 | RR | $2 Million (INR 1.25 Crore) | 14 |
| IPL 2015 | RR | $2 Million (INR 1.25 Crore) | 14 |
| IPL 2016 | RCB | $1.4 Million (INR 9.5 Crore) | 12 |
| IPL 2017 | RCB | $1.4 Million (INR 9.5 Crore) | 1 |
| IPL 2018 | CSK | $629,000 (INR 4 Crore) | 35 |
| IPL 2019 | CSK | $629,000 (INR 4 Crore) | 20 |
| IPL 2020 | CSK | $629,000 (INR 4 Crore) | 13 |
11. KL Rahul – 168 Sixes ($70,964 Per Six)
Since it took about $11,922,000 for his 168 sixes, KL Rahul cost his franchises about $70,964 per six in the IPL.
- Teams: RCB, KXIP, LSG
- Matches/Innings: 118/109
- Runs (Balls): 4163 (3097)
- Strike Rate (Sixes/Fours): 134.42 (168/355)
Average IPL Salary: $1.192 Million ($11,922,000 over 10 seasons)
- Number of Balls Per Six: 18.43 (3097/168)
- Number of Sixes Per Innings: 1.54 (168/109)
KL Rahul’s IPL Salary Over the Years
| Year | Team | Salary | Sixes |
| IPL 2013 | RCB | $22,000 | 0 |
| IPL 2014 | SRH | $160,000 (INR 1 Crore) | 3 |
| IPL 2015 | SRH | $160,000 (INR 1 Crore) | 5 |
| IPL 2016 | RCB | $160,000 (INR 1 Crore, Transferred) | 16 |
| IPL 2017 | RCB | Withdrawn | – |
| IPL 2018 | KXIP | $1.73 Million (INR 11 Crore) | 32 |
| IPL 2019 | KXIP | $1.73 Million (INR 11 Crore) | 25 |
| IPL 2020 | KXIP | $1.73 Million (INR 11 Crore) | 23 |
| IPL 2021 | KXIP | $1.73 Million (INR 11 Crore) | 30 |
| IPL 2022 | LSG | $2.25 Million (INR 17 Crore) | 30 |
| IPL 2023 | LSG | $2.25 Million (INR 17 Crore) | 4 |
12. Suresh Raina – 203 Sixes ($78,138 Per Six)
Since it took about $15,862,000 for his 203 sixes, Suresh Raina cost his franchises about $78,138 per six in the IPL.
- Teams: CSK, GL (Gujarat Lions)
- Matches/Innings: 205/200
- Runs (Balls): 5528 (4043)
- Strike Rate (Sixes/Fours): 136.73 (203/506)
Suresh Raina’s Average IPL Salary: $1.22 Million ($15,862,000 over 13 seasons)
- Number of Balls Per Six: 19.92 (4043/203)
- Number of Sixes Per Innings: 1.02 (203/200)
Suresh Raina’s IPL Salary Over the Years
| Year | Team | Salary | Sixes |
| IPL 2008 | CSK | $650,000 | 18 |
| IPL 2009 | CSK | $650,000 | 21 |
| IPL 2010 | CSK | $650,000 | 22 |
| IPL 2011 | CSK | $1.3 Million (Retained) | 17 |
| IPL 2012 | CSK | $1.3 Million (Retained) | 19 |
| IPL 2013 | CSK | $1.3 Million (Retained) | 18 |
| IPL 2014 | CSK | $1.2 Million (INR 7.5 Crore) | 19 |
| IPL 2015 | CSK | $1.2 Million (INR 7.5 Crore) | 16 |
| IPL 2016 | GL | $1.256 Million (INR 9.5 Crore) | 10 |
| IPL 2017 | GL | $1.256 Million (INR 9.5 Crore) | 13 |
| IPL 2018 | CSK | $1.7 Million (INR 11 Crore) | 12 |
| IPL 2019 | CSK | $1.7 Million (INR 11 Crore) | 9 |
| IPL 2020 | CSK | Withdrawn | – |
| IPL 2021 | CSK | $1.7 Million (INR 11 Crore) | 9 |
13. Glenn Maxwell – 158 Sixes ($79,911 Per Six)
Since it took about $12,626,000 for his 158 sixes, Glenn Maxwell cost his franchises about $79,911 per six in the IPL.
- Teams: DD (Delhi Daredevils), KXIP, RCB
- Matches/Innings: 124/120
- Runs (Balls): 2719 (1725)
- Strike Rate (Sixes/Fours): 157.62 (158/226)
Average IPL Salary: $1.148 Million ($12,626,000 over 11 seasons)
- Number of Balls Per Six: 10.92 (1725/158)
- Number of Sixes Per Innings: 1.32 (158/120)
Glenn Maxwell’s IPL Salary Over the Years
| Year | Team | Salary | Sixes |
| IPL 2012 | DD | $22,000 | 0 |
| IPL 2013 | MI | $1 Million | 4 |
| IPL 2014 | KXIP | $961,000 (INR 6 Crore) | 36 |
| IPL 2015 | KXIP | $961,000 (INR 6 Crore) | 8 |
| IPL 2016 | KXIP | $961,000 (INR 6 Crore) | 8 |
| IPL 2017 | KXIP | $961,000 (INR 6 Crore) | 26 |
| IPL 2018 | KXIP | $1.4 Million (INR 9 Crore) | 9 |
| IPL 2019 | KXIP | Withdrawn | – |
| IPL 2020 | KXIP | $1.5 Million (INR 10.75 Crore) | 0 |
| IPL 2021 | RCB | $1.96 Million (INR 14.25 Crore) | 21 |
| IPL 2022 | RCB | $1.45 Million (INR 11 Crore) | 15 |
| IPL 2023 | RCB | $1.45 Million (INR 11 Crore) | 31 |
14. Robin Uthappa – 182 Sixes ($82,478 Per Six)
Since it took about $15,011,000 for his 182 sixes, Robin Uthappa cost his franchises about $82,478 per six in the IPL.
- Teams: MI, RCB, RR, PWI, KKR, CSK
- Matches/Innings: 205/197
- Runs (Balls): 4952 (3799)
- Strike Rate (Sixes/Fours): 130.35 (182/481)
Average IPL Salary: $1 Million ($15,011,000 over 15 seasons)
- Number of Balls Per Six: 20.87 (3799/182)
- Number of Sixes Per Innings: 0.92 (182/197)
Robin Uthappa’s IPL Salary Over the Years
| Year | Team | Salary | Sixes |
| IPL 2008 | MI | $800,000 | 9 |
| IPL 2009 | RCB | $800,000 (traded) | 3 |
| IPL 2010 | RCB | $800,000 | 27 |
| IPL 2011 | PWI | $2.1 Million | 10 |
| IPL 2012 | PWI | $2.1 Million | 10 |
| IPL 2013 | PWI | $2.1 Million | 12 |
| IPL 2014 | KKR | $801,000 (INR 5 Crore) | 18 |
| IPL 2015 | KKR | $801,000 (INR 5 Crore) | 7 |
| IPL 2016 | KKR | $801,000 (INR 5 Crore) | 8 |
| IPL 2017 | KKR | $801,000 (INR 5 Crore) | 21 |
| IPL 2018 | KKR | $1 Million (INR 6.4 Crore) | 21 |
| IPL 2019 | KKR | $1 Million (INR 6.4 Crore) | 10 |
| IPL 2020 | RR | $421,500 (INR 3 Crore) | 7 |
| IPL 2021 | CSK | $421,500 (INR 3 Crore, Transferred) | 5 |
| IPL 2022 | CSK | $264,000 (INR 2 Crore) | 14 |
15. Yuvraj Singh – 149 Sixes ($94,605)
Since it took about $14,096,100 for his 149 sixes, Yuvraj Singh cost his franchises about $95,605 per six in the IPL.
- Teams: KXIP, PWI
- Matches/Innings: 132/126
- Runs (Balls): 2750 (2120)
- Strike Rate (Sixes/Fours): 129.71 (149/217)
Average IPL Salary: $1.281 Million ($14,096,100 over 11 seasons)
- Number of Balls Per Six: 14.23 (2120/149)
- Number of Sixes Per Innings: 1.18 (149/126)
Yuvraj Singh’s IPL Salary Over the Years
| Year | Team | Salary | Sixes |
| IPL 2008 | KXIP | $1.06 Million | 19 |
| IPL 2009 | KXIP | $1.06 Million | 16 |
| IPL 2010 | KXIP | $1.06 Million | 14 |
| IPL 2011 | PWI | $1.8 Million | 18 |
| IPL 2012 | PWI | Withdrawn | – |
| IPL 2013 | PWI | $1.8 Million | 15 |
| IPL 2014 | RCB | $2.24 Million (INR 14 Crore) | 28 |
| IPL 2015 | DD | $2.56 Million (INR 16 Crore) | 10 |
| IPL 2016 | SRH | $1.03 Million (INR 7 Crore) | 13 |
| IPL 2017 | SRH | $1.03 Million (INR 7 Crore) | 8 |
| IPL 2018 | KXIP | $314,500 (INR 2 Crore) | 2 |
| IPL 2019 | MI | $141,600 (INR 1 Crore) | 6 |
16. Shikhar Dhawan – 148 Sixes ($97,976 Per Six)
Since it took about $14,500,400 for his 148 sixes, Shikhar Dhawan cost his franchises about $97,976 per six in the IPL.
- Teams: DD (Delhi Daredevils), MI, DC (Deccan Chargers), SRH, DC (Delhi Capitals), PBKS
- Matches/Innings: 217/216
- Runs (Balls): 6617 (5203)
- Strike Rate (Sixes/Fours): 127.17 (148/750)
Average IPL Salary: $906,275 ($14,500,400 over 16 seasons)
- Number of Balls Per Six: 35.16 (5203/148)
- Number of Sixes Per Innings: 0.69 (148/216)
Shikhar Dhawan’s IPL Salary Over the Years
| Year | Team | Salary | Sixes |
| IPL 2008 | DD | $50,000 | 8 |
| IPL 2009 | MI | $50,000 (trade) | 0 |
| IPL 2010 | MI | $50,000 | 3 |
| IPL 2011 | DC | $300,000 | 7 |
| IPL 2012 | DC | $300,000 | 18 |
| IPL 2013 | DC | $300,000 | 5 |
| IPL 2014 | SRH | $2 Million (INR 12.5 Crore) | 7 |
| IPL 2015 | SRH | $2 Million (INR 12.5 Crore) | 6 |
| IPL 2016 | SRH | $2 Million (INR 12.5 Crore) | 8 |
| IPL 2017 | SRH | $2 Million (INR 12.5 Crore) | 9 |
| IPL 2018 | SRH | $817,600 (INR 5.2 Crore) | 14 |
| IPL 2019 | DC | $817,600 (INR 5.2 Crore, Transferred) | 11 |
| IPL 2020 | DC | $817,600 (INR 5.2 Crore) | 12 |
| IPL 2021 | DC | $817,600 (INR 5.2 Crore) | 16 |
| IPL 2022 | PBKS | 1.09 Milllion (INR 8.25 Crore) | 12 |
| IPL 2023 | PBKS | 1.09 Milllion (INR 8.25 Crore) | 12 |
17. Rohit Sharma – 257 Sixes ($116,381 Per Six)
Since it took about $29,910,000 for his 257 sixes, Rohit Sharma cost his franchises about $116,381 per six in the IPL.
- Teams: DC (Deccan Chargers), MI
- Matches/Innings: 243/238
- Runs (Balls): 6211 (4776)
- Strike Rate (Sixes/Fours): 130.04 (257/554)
Rohit Sharma’s Average IPL Salary: $1.869 Million ($29,910,000 over 16 seasons)
- Number of Balls Per Six: 18.58 (4776/258)
- Number of Sixes Per Innings: 1.08 (257/238)
Rohit Sharma’s IPL Salary Over the Years
| Year | Team | Salary | Sixes |
| IPL 2008 | DC | $750,000 | 19 |
| IPL 2009 | DC | $750,000 | 18 |
| IPL 2010 | DC | $750,000 | 14 |
| IPL 2011 | MI | $2 Million | 13 |
| IPL 2012 | MI | $2 Million | 18 |
| IPL 2013 | MI | $2 Million | 28 |
| IPL 2014 | MI | $2 Million (INR 12.5 Crore) | 16 |
| IPL 2015 | MI | $2 Million (INR 12.5 Crore) | 21 |
| IPL 2016 | MI | $2 Million (INR 12.5 Crore) | 16 |
| IPL 2017 | MI | $2 Million (INR 12.5 Crore) | 9 |
| IPL 2018 | MI | $2.36 Million (INR 15 Crore) | 12 |
| IPL 2019 | MI | $2.36 Million (INR 15 Crore) | 10 |
| IPL 2020 | MI | $2.36 Million (INR 15 Crore) | 19 |
| IPL 2021 | MI | $2.36 Million (INR 15 Crore) | 14 |
| IPL 2022 | MI | $2.11 Million (INR 16 Crore) | 13 |
| IPL 2023 | MI | $2.11 Million (INR 16 Crore) | 17 |
18. MS Dhoni – 250 Sixes ($119,280 Per Six)
Since it took about $29,820,000 for his 250 sixes, MS Dhoni cost his franchises about $119,280 per six in the IPL.
- Teams: CSK, RPS
- Matches/Innings: 250/218
- Runs (Balls): 5082 (3739)
- Strike Rate (Sixes/Fours): 135.91 (239/349)
MS Dhoni’s Average IPL Salary: $1.864 Million ($29,820,000 over 16 seasons)
- Number of Balls Per Six: 14.96 (3739/250)
- Number of Sixes Per Innings: 1.15 (250/218)
MS Dhoni’s IPL Salary Over the Years
| Year | Team | Salary | Sixes |
| IPL 2008 | CSK | $1.5 Million | 15 |
| IPL 2009 | CSK | $1.5 Million | 9 |
| IPL 2010 | CSK | $1.5 Million | 8 |
| IPL 2011 | CSK | $1.8 Million | 23 |
| IPL 2012 | CSK | $1.8 Million | 9 |
| IPL 2013 | CSK | $1.8 Million | 25 |
| IPL 2014 | CSK | $2 Million (INR 12.5 Crore) | 20 |
| IPL 2015 | CSK | $2 Million (INR 12.5 Crore) | 17 |
| IPL 2016 | RPS | $1.65 Million (INR 12.5 Crore) | 14 |
| IPL 2017 | RPS | $1.65 Million (INR 12.5 Crore) | 16 |
| IPL 2018 | CSK | $2.36 Million (INR 15 Crore) | 30 |
| IPL 2019 | CSK | $2.36 Million (INR 15 Crore) | 23 |
| IPL 2020 | CSK | $2.36 Million (INR 15 Crore) | 7 |
| IPL 2021 | CSK | $2.36 Million (INR 15 Crore) | 3 |
| IPL 2022 | CSK | $1.59 Million (INR 12 Crore) | 10 |
| IPL 2023 | CSK | $1.59 Million (INR 12 Crore) | 10 |
19. Virat Kohli – 234 Sixes ($120,470 Per Six)
Since it took about $16,560,000 for his 251 sixes, Virat Kohli cost his franchises about $120,470 per six in the IPL.
- Teams: RCB
- Matches/Innings: 237/229
- Runs (Balls): 7263 (5586)
- Strike Rate (Sixes/Fours): 130.02 (234/643)
Virat Kohli’s Average IPL Salary: $1.761 Million ($28,190,000 over 16 seasons)
- Number of Balls Per Six: 23.87 (5586/234)
- Number of Sixes Per Innings: 1.02 (234/229)
Also Read: Virat Kohli Net Worth 2023 (in Dollars USD and Indian Rupee INR): How Do Cricketers Earn Money?
Virat Kohli’s IPL Salary Over the Years
| Year | Team | Salary | Sixes |
| IPL 2008 | RCB | $50,000 | 4 |
| IPL 2009 | RCB | $50,000 | 8 |
| IPL 2010 | RCB | $50,000 | 12 |
| IPL 2011 | RCB | $1.8 Million | 16 |
| IPL 2012 | RCB | $1.8 Million | 9 |
| IPL 2013 | RCB | $1.8 Million | 22 |
| IPL 2014 | RCB | $2 Million (INR 12.5 Crore) | 16 |
| IPL 2015 | RCB | $2 Million (INR 12.5 Crore) | 23 |
| IPL 2016 | RCB | $2 Million (INR 12.5 Crore) | 38 |
| IPL 2017 | RCB | $2 Million (INR 12.5 Crore) | 11 |
| IPL 2018 | RCB | $2.67 Million (INR 17 Crore) | 18 |
| IPL 2019 | RCB | $2.67 Million (INR 17 Crore) | 13 |
| IPL 2020 | RCB | $2.67 Million (INR 17 Crore) | 11 |
| IPL 2021 | RCB | $2.67 Million (INR 17 Crore) | 9 |
| IPL 2022 | RCB | $1.98 Million (INR 15 Crore) | 8 |
| IPL 2023 | RCB | $1.98 Million (INR 15 Crore) | 16 |
Final Thoughts
Some interesting revelations here.
Ambati Rayudu may probably be one of the steals of the IPL auctions!
Because Rayudu was an uncapped player for early part of his IPL career, his IPL salary was comparatively low to his contemporaries. He was a clutch player for both MI & CSK over the years and was worth every penny.
However, take this list with a grain of salt. The fact that Rohit Sharma, MS Dhoni, and Virat Kohli end at the bottom of the list is due to the fact that they were retained almost every time. We are only comparing dollars per six here, but these three provided their IPL franchises a lot more value—Leadership, Fours, Runs, Orange Caps, IPL Titles, brand value, fan loyalty, match winning performances, and much more.
Thanks for reading, until next time.
Please do share ahead with your cricket loving friends!
Also Read:
- Top 36 Most Expensive IPL Auction Players (Salaries in US Dollars): Who are the Most Expensive IPL Auction Buys of All Time? (Updated 2023)
- Top 12 Richest Cricket Boards (RANKED 2023): Which Cricket Board Has the Highest Net Worth—BCCI, CA, ECB, CSA, or PCB?
- Top 11 Richest Cricket Leagues (By Average Salaries). Which Cricket League Pays the Most (2024)—SA20, IPL, BBL, PSL, MLC, ILT20, CPL, T10s, or the Hundred?
- What is the Salary of an Indian Premier League (IPL) player in India?
Frequently Asked Questions (FAQ)
Chris Gayle has hit the most sixes in the IPL (357), followed by Rohit Sharma (257) and AB De Villiers (251).
Ambati Rayudu ($34,442), Chris Gayle ($37,808), and Jos Buttler ($43,812) have the best ratios of dollar per six in IPL history.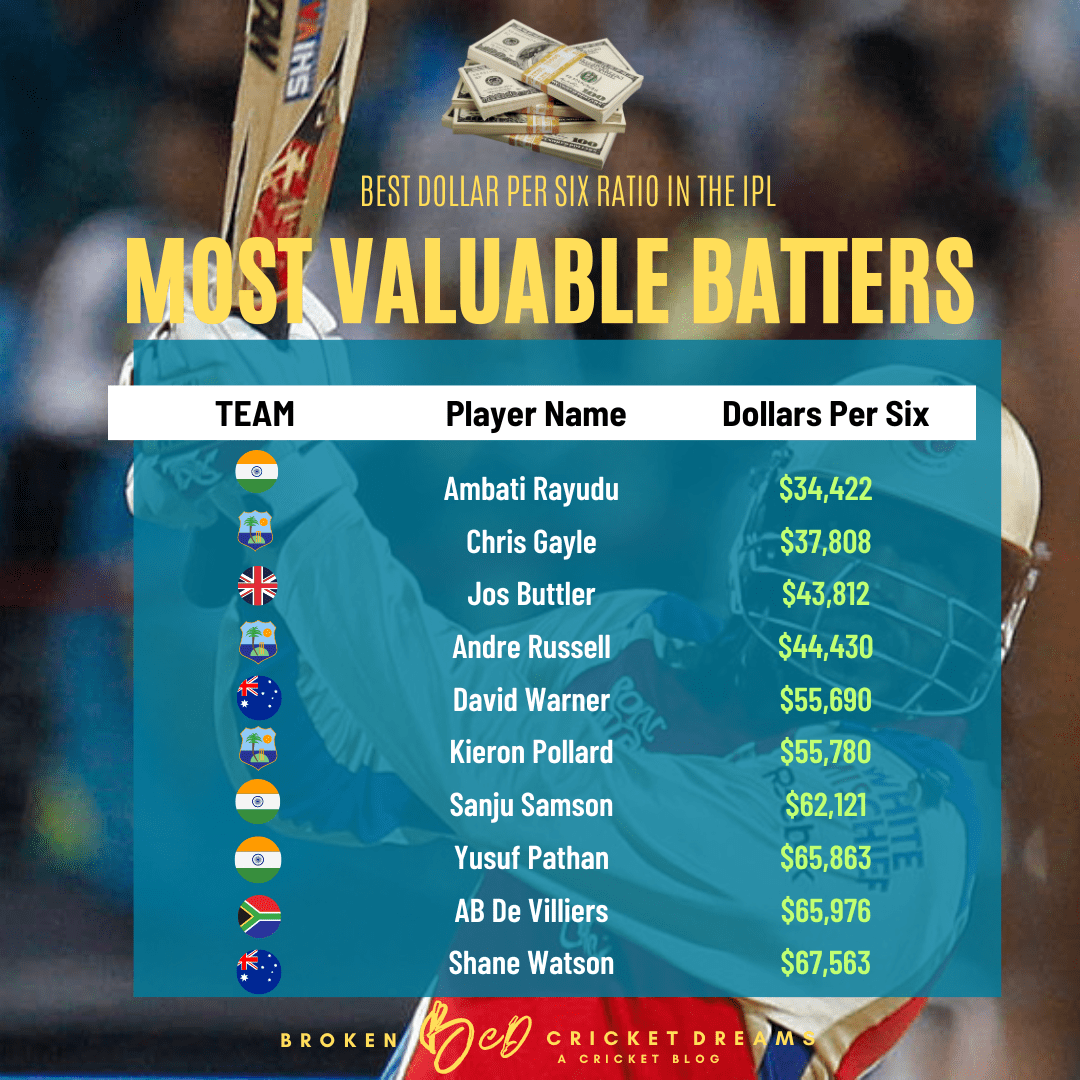
© Copyright @Nitesh Mathur and Broken Cricket Dreams, LLC 2023. Originally published on 03/16/2024. Unauthorized use and/or duplication of this material without express and written permission from this site’s author and/or owner is strictly prohibited. Excerpts and links may be used, provided that full and clear credit is given to Broken Cricket Dreams with appropriate and specific direction to the original content (i.e. linked to the exact post/article).

0 Comments