1403 days since Rishabh Pant steered the ball towards the rope against a relentless Josh Hazlewood at the Gabba, the most anticipated series of the 21st century is back!
Yes, I am talking about the Border Gavaskar Trophy. This time it is bigger and better—5 Tests instead of four.
After two back-to-back wins, can India secure a hat-trick in Australia and stamp their authority? Will the BGT remain competitive? Who will qualify for the WTC finals?
In the 2018/19 tour, Pujara scored 521 runs at an average of 74.42 with 3 hundreds and 1 fifty, helping India win their first Test series win in Australia. More importantly, he faced 1258 balls, 574 (or 95.4 overs) more than the next highest, Virat Kohli (684 balls faced). Australia’s best was Usman Khawaja at 592 balls.
In 2020/21, Pujara was not in as red hot form. He was the fourth highest run-scorer in the series with 271 runs at 33.87 average. However, yet again, he faced 928 balls, more than any batter on either side (Labuschagne faced 850 balls, best for Australia).
Gill was earmarked for this role. However, he is out with an injury in the first match. India needs to find 1-2 players to dent the new ball. For Australia, Khawaja-Labuschange both have the pedigree, but they need to stay in the game when it matters the most.
Let’s rewind back three years. It was one of the best Test series of all time, but it was marred by injuries.
Pucovski, Warner, Ishant Sharma, Bhuvneshwar Kumar were injured prior to the series. During the series, Kohli had to go back and Shami, Umesh, Ashwin, Vihari, Jadeja, Bumrah, Rahul, and Pucovski again were injured.
Pucovski’s career has sadly almost ended at the age of 26 due to his repeated concussion battles. For India, Mohammad Shami has been out of action for almost a year and just getting back to domestic cricket. Rohit Sharma will be starting late due to birth of a child, and Shubman Gill & KL Rahul have already had injury scares leading up to the first Test.
I hope these scares are temporary, and we have a hard fought but injury free two months from both sides.
Steve Smith re-invented himself as an opener last season with middling success—12, 11*, 6, 91*, 31, 0, 11, 9 against West Indies and New Zealand. It is time he gets back to his beloved #4 spot and solidifies Australia’s middle order along with India’s arch-nemesis November specialist, Travis Head.
All eyes will also be on the highly rated 25-year old Nathan McSweeney, who is coming off a rich vein of form: 55 & 127* in the first Sheffield Shield match and 137 (131) in a List A match that followed. He ended with 39, 88*, 14, & 25 in the India A series.
For India, without Rohit and Shubman, India would have to go with an inexperienced trio of Jaiswal, Rahul/Easwaran, and Padikkal. KL Rahul averages 40.02 batting at #1 with 4 hundreds & 8 fifties (41 innings) and 28.78 batting at #2 with 3 hundreds & 4 fifties (34 innings).
The opening session may dictate how each of the Test turns out. India somehow recovered from 36/9 to win the series 2-1 last time, but that is once in a generation kind of stuff. If Hazlewood & Starc get going in the first session of a match, they can run through India’s top order pretty quickly.
On the flip side, Rohit’s counterattacking approach could be a delight to watch and may put Starc off his lines.
Recent history shows that if India are to win, they have to take their 20 wickets. I am excited to watch Akash Deep and Prasidh Krishna (if he gets a chance) on bouncy Australian pitches. And I am looking forward to at least one surprising slower yorker from the one and only, Jasprit Bumrah.
Virat Kohli has been a shadow of himself in the recent past in Test cricket. However, if there is one nation where Kohli can get his aggressive in-form self back out, it is in Australia. The pitches will suit him, and the runs will hopefully follow.
🚨 Average of #4 Batters in the Last 4 Years (Minimum 20 Innings)
— Broken Cricket Dreams Cricket Blog (@cricket_broken) October 25, 2024
Bowling throughout the day against India’s middle order batters, will be Pat Cummins.
That man can bowl and bowl and keep on bowling. He bowled an absurd 162.1 overs in 2020/21 against India. Cummins vs Kohli will be a mouth watering match or even series-deciding.
Ravichandran Ashwin, 105 matches, 536 wickets, 37 5-fers. His batting has been a revelation in recent years as well.
Integral part of their respective sides in the last decade, we are sure to witness a final great battle between these two legends. The real question is, will Ashwin even get a look in, especially with Sundar’s show against New Zealand (and his knocks at the Gabba)? Where does Jadeja fit into the equation?
Three left-handers will be the X factors to watch out for. As always, the dangerous Rishabh Pant who has tilted the last two series on its head, the WTC final & World Cup final hero, Travis Head…and Alex Carey.
Did you say Alex Carey!?!
Yes, I said Alex Carey.
Yes, he had a pretty awful 2023, averaging just 24.26 after 20 innings. However, his 2024 looks a lot better, and he scored a 98* in his last Test vs New Zealand. Since September, his figures are as follows:
74, 77*, 13 (England ODIs), 90, 111, 42, 123*, 44, 42 (Sheffield Shield), 6, 36, 75 (List A). Something is brewing here…And we all know how India are against lower order batters and cleaning up the tail (Rewind your memories to Sam Curran 2018).
Pant has had meaningful contributions in every single one of his knocks in Australia. Surely, he can’t do it with this consistency yet again? Or can he?
*Rohit Sharma is currently out on fatherhood duties and Shubman Gill suffered an injury. For the first test, KL Rahul (looks like he has recovered from his injury scare) and Devdutt Padikkal (who performed well in the India A game in Australia) may make an appearance.
Expect to see Sarfaraz Khan and Prasidh Krishna to get a game or two throughout the series.
Others in Squad: Abhimanyu Easwaran, Ravindra Jadeja, Harshit Rana
Others in Squad for 1st Test: Scott Boland, Josh Inglis (WK)
Series Predictions
A jarring fact is that the senior Indian side are coming in with zero practice matches. They cancelled their official match against India A as well.
With a long drawn out 5-match series, I think the home side are favorites to begin with. No matter how it is going to end, it is going to be a cracker of a contest. Expect one Sydney 2020-like hard fought draw, 3 close contests with numerous ebbs and flows, and 1 completely one-sided contest.
What about the WTC? India’s chances are looking bleak at the moment. 3 or 4-0 win against Australia is a bit unreasonable to expect. If it happens, it would be a spectacle! But once again, would give Australia an upper hand (and do not forget, South Africa, Sri Lanka, New Zealand are still well and truly in the running!)
In any case, here are my predictions, comment below on yours!
India
Australia
Scoreline
1
3
Most Runs
Virat Kohli
Steve Smith
Most Wickets
Akash Deep
Josh Hazlewood
X-Factor
Shubman Gill
Usman Khawaja
Surprise Package
Nitish Reddy
Alex Carey
Broken Dreams?
This may be the final BGT Trophy in Australia for Nathan Lyon, Ravichandran Ashwin, Virat Kohli, and Rohit Sharma.
If this is the final time, I hope they all get a chance to shine and make us smile.
All the best!
***
Thanks for reading!
Before you Go, Please Buy my Book on Amazon on the Life Lessons from the Border Gavaskar Trophy!
How do they compare to the standards of the English county teams? Which domestic teams made the largest strides in the last 1-2 years? And more.
I went through 504 pages of annual reports of these six clubs, so you don’t have to.
Without further ado, let’s jump right in.
Key Takeaways
Western Australia ($43 million profit), South Australia ($3.6 million), New South Wales ($1.4 million), and Queensland ($970,000) made profits in the last year, while Victoria ($180,000 loss) and Tasmania ($1.6 million) suffered narrow losses.
Western Australia ($111 million), South Australia ($101 million), NSW ($99 million), and Victoria ($83 million) have the largest total assets.
The largest total liabilities also lies with Western Australia ($50 million) with NSW ($13 million) coming in next.
Which Australian Domestic Team Earned the Most Money in 2023-2024?
The data provided is from the annual reports of each domestic team with financials accounted for the annual period ending on 30 June, 2024. Note that the ‘total comprehensive income’ (revenue – expenses for the year) is denoted as the ‘annual income’ in the tables below.
Note: All amounts are presented in Australian Dollar (AUD). The conversion between USD and AUD on 11/17/2024 is as follows: $1 AUD = $0.65 USD or $1 USD = $1.55 AUD.
1. Western Australia ($43 Million Profit)
Home Ground: Perth Stadium, WACA
Financial Health Status:Green
Assessment: The WACA Ground Improvement Project (WGIP) grant has inflated the revenues and assets for WA’s 2023-24 financial statement. Altogether Western Australia
“The final net result for the year was a surplus of $43,331,783 ($3,545,655 in 2022-23), achieved after including capital grants relating to the WACA Ground Improvement Project (WGIP) which have been recognised as revenue during the year….The net result from our normal business operations excluding WGIP related items was a deficit of $1,625,663 (surplus of $1,283,001 in 2022-23).“
Highlights from Executive Report
“Our success on and off the field would not have been possible without the support of our growing Membership, with a record number of 4,800 new Members across WACA and Perth Scorchers products this season.”
Other Key Points
Total cost for WGIP is $168,908,797 which will be funded by a combination of the state government ($109.7 million), federal government ($30 million), WA Cricket ($11 million), Cricket Australia ($4 million), and other funding sources. The project is set to be completed by July 2025.
Employee benefit expenses ($24.4 million in 2024 and $20.8 million in 2023) take up the largest portion of WA’s expenses. Contractors and consultant expenses also increased from $3.3 million in 2023 to $4.7 million in 2024.
+2% growth in children 5-12 playing cricket, +3% growth in junior boys, +5% growth in junior girls, +7% girls in Woolworths Cricket Blast, +13% increase in registered participation among women & girls.
“This summer, more than 18,000 Members attended international cricket, including the Men’s Test Match and T20 against the West Indies as well as the Women’s ODI against South Africa. More than 12,000 Members also attended WBBL Strikers games at Adelaide Oval and the Karen Rolton Oval. These numbers show that cricket is alive and well in this passionate sporting state.”
Other Key Points
Employee benefit expenses ($23.4 million – 2024 and $20.7 million – 2023) contributed to their largest expense,, while sales income ($52.6 million) generated the largest share of their income.
18% increase in girls cricket, 32% increase in SACA’s Primary School Cricket Competition, 5,660 registered in Junior cricket for ages 5-12 (4% increase)
Assessment: Although revenue remained steady in 2024, NSW’s expenses have increased this year. Since Cricket Australia’s distribution to NSW’s revenue will not increase, NSW had to make structural reorganization to balance their budgets for the upcoming year.
“Financially, we performed effectively again, recording a small deficit against a break-even operating budget and achieving a better than budget result in our total comprehensive income…Unfortunately, confirmation from Cricket Australia that there would be no increase in their distribution for 2024/25 required us to look at our cost structure and resulted in a reshaping of our organization.”
Highlights from Chairman’s Report
“The game of cricket itself continues to grow around the world. Cricket is now the second most loved sport in the world and the revenues in our game globally have grown substantially. Cricket NSW is determined to ensure Australia doesn’t get left behind…Last year Cricket NSW entered into an arrangement with Major League Cricket in the United States and helped develop the T20 league in that country. And we continue to push the cricketing world to ensure the traditional (and to many the best) format of our great game, Test cricket, doesn’t just survive but thrives.”
Other Key Points
“Cricket balls are one of the biggest expenses clubs incur during the season” and the $10,000 donation from Homestar Finance helped purchase cricket balls for 17 clubs in the region.
Cricket Australia Distributions provided the largest factor in revenue in 2024 ($43.3 million our of $64.1 million).
Players payment pool ($14.6 million), cricket performance ($10.47 million), and match/venue ($10.47 million) were the largest expenses for NSW.
30% increase in 5-12 year old cricket, including 50% increase for 5-12 year old girls.
Assessment: Financially, the revenue and expenses both increased, keeping them relatively stable. However, it was quite evident from the annual report that Queensland is disappointed in not hosting a Gabba Test in the 2026-27 season due to government’s Olympic planning.
“The State Government’s decision to not progress with its commitment to rebuild the Gabba and downgrade its proposed Olympic role has resulted in direct and indirect changes to how we proceed with our business…The most obvious impact will be that for the first time since 1976-77, a Test match will not be held at the Gabba in 2026-27…It is deeply disappointing that the 2026-27 Gabba Test has become a casualty of the uncertainty around the infrastructure planning and development ahead of the 2023 Olympic preparations.”
Highlights from CEO’s Report
“…Queensland Cricket was again able to achieve its budgeted financial surplus target for the year…The surplus amounted to $968,451 (2023: $863,602) which incorporates an amount of $442,142 representing gains from the QCA Future Fund. Excluding this amount, which is not available for general use, the net operating surplus for the year was $526,309.”
Other Key Points
ACIF (Australian Cricket Infrastructure Fund) contributed about $13 million across two rounds in improved cricket facilities and infrastructure.
“Participation in junior club cricket remains flat Statewide and has decreased in some regions.”
On the other hand, girls cricket is growing with 152% and 290% increase in Brisbane North and Bayside East/Redlands regions respectively. North Queensland has also seen a 1,000+ participation increase (27%).
TV viewership for Brisbane Heat in the BBL season average 759K per game. In particular, “Channel Seven’s free to air coverage was a particular highlight…[viewership] increasing by 40%” for Heat matches.
Employee benefits expense ($24.3 million – 2024, $21.2 million – 2023) was the largest expense for Queensland, with ‘state cricket match expenses’ coming next with around $3.8 million for 2024 ($4.3 million for 2023).
“…Cricket Victoria concluded the year reporting a $184,000 deficit for 2023-24…Pleasingly, key BBL revenue streams including ticketing and sponsorship continued to grow and return towards pre COVID levels. We also saw growth continuing across our new revenue streams – Cricket Victoria Foundation, School Holiday Programs and Melbourne Cricket Education Academy. Additional costs were incurred through the BBL season, as well as set up costs associated with the roll-out of new revenue initiatives that are planned for FY25 including the Victoria Health Club and Melbourne Cricket Academy.”
Highlight from Director’s Report
“Costs increased versus prior year, notably in employee related expenses reflecting the increase in payments to both male and female players. Employee expenses also rose with new roles added to support revenue growth initiatives and high performance, as well as general cost of living and legislated increases.”
Other Key Points
Men/boy’s participation grew 7.3%, women’s/girl’s participation grew 14.3% with over 41,000 boys/girls registered in the 5-12 year age group.
Over 60 projects received $1.3 million from ACIF for infrastructure improvement.
Employee, player, volunteer, and contractor benefit expenses was the largest expense incurred by Cricket Australia ($29.7 million – 2024, $25.7 million – 2023).
Home Ground: Bellerive Oval, Macquare Point Stadium, UTAS Stadium
Financial Health Status:Yellow
Assessment: While revenue streams remained steady for Tasmania between 2023 & 2024, expenses increased by about $4.5 million. The annual report offered positive outlook nevertheless with growing popularity, investment, and awareness of the sport in Tasmania.
“Investment in infrastructure is imperative from a professional and game development point of view, and the Macquarie Point Stadium project presents an exciting opportunity for sport in our State and for young Tasmanians to fulfill their dreams at home. I am firmly of the view that this is the sort of positive change that can set both Tasmania and cricket up to thrive in the future.”
After going through all these annual reports, one thing is clear—Australian cricket is thriving!
Membership is growing, investment and infrastructure development projects are on the rise, and the growth in junior girls cricket is on the rise as well. No wonder Australia continues to dominate world cricket and win trophies in both women’s and men’s cricket. They have a prospering and financially stable domestic system.
A common theme between all the teams was that expenses increased from 2023 to 2024 due to employee benefit and payment increase, which is probably a good thing. As long as the revenue continues to increase as well, the future looks good for Australian cricket.
****
Thanks for reading!
Before you Go, Please Check out my Book on Amazon on the Life Lessons from the Border Gavaskar Trophy!
Four years ago I was really excited when the idea of the World Test Championship came out. I mean, it was partially a reason for me to start this blog.
However, with the recent overseas wins of NZ in India, SA in Bangladesh, and Bangladesh in Pakistan—that hope has rekindled.
Therefore, this is a good time for us to revisit the WTC alternative points table algorithm my friend and I had created four years ago to create a more balanced system. For this WTC cycle, I analyzed each of the 51 Test matches and 578 completed sessions one-by-one so you don’t have to.
Before we start, he is a quick refresher on how our alternative points table worked.
Our WTC points table algorithm (1) distributes points on a session-by-session basis rather than an all-or-nothing system for a Test match, (2) includes Home/Away points for both wins & draws, and (3) includes a bonus to reward massive victories (Test match net run rate equivalent).
Points are calculated as follows:
2 points per session won, 1 point per session Tied
There are 15 maximum sessions in a Test (3 sessions per day), so 30 points maximum per Test for the session-by-session category
The details of the algorithm used to decide who won each session is outlined in the original article and is left as an exercise to the reader.
Bonus: 2 * (Number of Sessions Remaining)
Example: If the Test finishes at the end of Day 4, the winning team would get 6 bonus points – (2 * (3 sessions remaining))
Home/Away
Away wins and away draws would be awarded more points.
16 – Home Win, 8 – Home Draw
24 – Away Win, 12 – Away Draw
The maximum points a team could earn per Test is outlined below (Example: 24 – away win points + 30 session points = 54 total if the team won all the sessions).
Points
Win
Draw
Loss
Maximum Points Possible (Per Match)
Home
16
8
0
46
Away
24
12
0
54
Average*
20
10
0
50
Home & Away Points
Finally, since each team plays a different number of matches, we will take a percentage determined by (total points earned)/(maximum points possible*).
The maximum points possible will be determined by (number of matches played * 50), where we choose 50 because it is the average between 46 & 54 and would hence, weight away wins & draws more.
I coded this algorithm in R & Python and double checked the calculations by hand for the session-by-session analysis.
🇦🇺 BEAT 🏴 by 2 wickets, Birmingham 🇦🇺 BEAT 🏴 by 43 runs, Lord’s 🇮🇳 BEAT 🌴 by inn & 141 runs, Roseau 🇵🇰 BEAT 🇱🇰 by 4 wickets, Galle 🇵🇰 BEAT 🇱🇰 by inn & 222 runs, SSC 🇳🇿 BEAT 🇧🇩 by 4 wickets, Mirpur 🇮🇳 BEAT 🇿🇦 by 7 wickets, Cape Town 🌴 BEAT 🇦🇺 by 8 runs, Brisbane 🏴 BEAT 🇮🇳… pic.twitter.com/b55YlIHHzZ
— Broken Cricket Dreams Cricket Blog (@cricket_broken) November 10, 2024
Key Takeaways
45% (23/51) WTC matches in this cycle so far have been won by away teams.
England (79) & India (76) won the most sessions so far, while Australia (47) have tied the most sessions. West Indies (24) & Bangladesh (29) have had the least session wins in this cycle of the WTC so far
We have had a spectacular run of dramatic overseas victories. Each team has had at least one overseas win:
South Africa 1-0 in West Indies & 2-0 in Bangladesh
Australia won 2 Tests each in England & New Zealand
Bangladesh won in Pakistan 2-0
Pakistan won 2-0 in Sri Lanka
Sri Lanka won 2-0 in Bangladesh and a Test in England
England won one Test each in India & Pakistan
The India vs South Africa Test at Cape Town was the shortest Test ever, lasting only 5 sessions.
South Africa won all 9 out of 9 sessions in the recent 2nd Test vs Bangladesh and received the maximum possible 54 points for the Test in our points system.
WTC 2023-2025 Alternative Points Table – Results
Here is our alternative WTC 2023-25 points table at a glance.
Team
Total Points
AverageMax Points Possible*
BCD Percentage
Actual WTC Percentage
Australia
379
600
63.17%
62.50%
India
410
700
58.60%
58.33%
South Africa
233
400
58.25%
54.17%
Sri Lanka
239
450
53.11%
55.56%
New Zealand
277
550
50.36%
54.55%
England
411
950
43.26%
40.79%
Pakistan
206
500
41.2%
33.33%
Bangladesh
162
500
32.4%
27.50%
West Indies
122
450
27.11%
18.52%
*Note: We have added the same over-rate deductions as the current WTC table does (19 for England, 10 – Australia, 8 – Pakistan, 3 – Bangladesh 2 – India)
Observations
Our points table heavily rewards South Africa, who have dominated 3 overseas Tests (1 vs WI, 2 vs Bangladesh).
Sri Lanka are close by with 3 overseas Tests wins as well (2 vs Bangladesh, 1 vs England) but they lost points to Pakistan at home. Similarly, NZ had a good show vs Bangladesh & India away, but lost convincingly 0-2 against Australia (home) & Sri Lanka (away)
The interesting point our points table highlights is showcasing how close a Test match or Test series was. For example, the 2-2 Ashes translates into 132-118 in favor of Australia (due to overseas wins and draw).
In addition, no two Test series are alike.
The Pakistan-Bangladesh 2-Test series (where Pakistan batted well initially and even declared) resulted in 84-24 points in favor of Bangladesh. This series was closer than the SA-Ban series (101-7 in favor of SA), where SA completely decimated Bangladesh.
Appendix: WTC 2023-25 Match By Match Break Down
If you want to look at the particular series or team, here is a table of content organized by home team for easier access:
In The Alchemist, a young shepherd named Santiago from the Andalusian region of Spain leaves his simple life to chase a dream, which he calls his ‘Personal Legend.’
He embarks on a journey of self-discovery filled with unexpected twists and turns.
Along the way, he learns several life lessons. One of my favorites is,
“When you want something, all the universe conspires in helping you achieve it.”
– Paul Coelho, The Alchemist
****
New Zealand Lift the 2024 T20 Women’s World Cup
Just like Santiago, today we celebrate Sophie Devine’s incredible journey. After 14 long years, the universe has conspired to help Sophie Devine finally lift the T20 World Cup Trophy, this time as captain.
Remember, the White Ferns narrowly missed out on World cup glory in the inaugural 2009 and 2010 T20 World Cup editions.
What Happened in the 2010 T20 World Cup Final, You Ask?
14 years ago, the Boot Happened.
The Boot? Yes, the boot.
Specifically, Ellyse Perry’s boot.
5 runs needed in the final ball, 4 runs for a Super happen. Watch what happens yourself.
Sophie hit a crisp straight drive, only to be denied by Ellyse Perry.
She was stranded on 38*, just one hit away from a World Cup.
Sophie Devine must have been devastated. Unfortunately, it was not meant to be. In her own words,
“I have had nightmares about that Ellyse Perry right boot. Think we were so close in that match.”
Her love for sports came through her dad, who was also her first coach. She grew up playing all sorts of different sports but cricket & field hockey took center stage as she entered university.
She became the White Ferns captain in 2020 during the form of her life and the 2024 T20 World Cup was to be her last T20 tournament as captain.
“It’s Only Those Who are Persistent, and Willing to Study Things Deeply, who Achieve the Master Work.”
Devine wasn’t always the power-hitting batter we now come to think of.
She actually burst onto the scene as a young 17-year old bowler who batted at #11.
In T20Is, she wouldn’t play a major match-winning innings until she was promoted to #4 in 2010, scoring 35 & 48 against Australia. She would score her first fifty in 2012. Devine didn’t even play a single ODI between 2010 and 2013. She would make an ODI comeback in 2013 and score her first ODI hundred, a magnificent 145, that too in a World Cup.
With the ball, she brought her best to the T20 World Cups – 3/18 and 4/22 (semi-final) in 2016, and 3/18 in the 2020 T20 World Cup.
Her evolution in turning herself into a dependable top order batter and one of the greatest all-rounders the world has ever seen is a testament to the hard work and dedication she put in to hone her craft.
Santiago found help in his journey—a merchant under whose tutelage he learned trade skills, a Gypsy who interpreted his dreams, an Englishman who knew alchemy, the love of his life in Fatima that gave him direction, a tribal chief, and many others who guided him along the way.
****
Devine similarly had a cast of members she could depend upon in the 2024 World Cup.
She embraced herself as one of the self-proclaimed ‘grandmas’ of the team. Alongside Devine were Suzie Bates, who became the most capped women’s player across formats (and fun fact, she also represented NZ in the 2008 Olympics as a basketball player) and Lea Tahuhu, once the fastest women bowler in the world.
They also had a cast of up and coming players such as Eden Carson, Georgia Plimmer, Brooke Halliday, Rosemary Mair, and a 24-year old Amelia Kerr who already has eight years of international cricket, an ODI double century, and (now) 188 international wickets to her name.
“The secret of life, though, is to fall seven times and to get up eight times.”
The senior trio must have known deep in their hearts that 2024 was their final chance.
Sophie Devine & Suzie Bates had fallen 8 consecutive times, and this was to be Tahuhu’s 5th T20 World Cup as well. Their recent T20 World Cup record didn’t ooze much confidence.
And there must have been some doubts creeping in as well.
After all, the White Ferns were coming off a 10-match losing streak.
Tahuhu’s economy in the previous 5 matches before the WC hovered between 8-12.5. Bates hadn’t made a half-century for 12 straight games even as an opener. Apart from two fifties, Devine had nothing to show with the bat with scores of 17, 0, 9, 5, 12, 4, and 5 in the entirety of 2024.
In any case, even after falling for eight times and the losing streak, they got up for a 9th time.
And as it would turn out, 9th time was the charm for Devine & Bates.
“Sometimes There is No Way to Hold Back The River”
So, how did the White Ferns manage to win the T20 World Cup against all odds?
Devine’s 57* and Mair’s 4/19 against India set the tone, but the World Cup victory was definitely a team effort.
Amelia Kerr’s historic all-round effort while limping in the final, en route to becoming the player of the tournament, was superhuman. Halliday’s impetus in the final, Tahuhu’s 1-run over that caused South Africa’s collapse, Eden Carson’s semi-final performance (and her interviews), the find of Georgia Plimmer, the spinners’ contribution, Gaze’s gaze behind the stumps, and Maddy Green’s catching, it all added up in the end.
No New Zealand batter made the Top 4 run scorer list (Bates & Plimmer were NZ’s best with 150 runs each at joint #5). With the ball, Kerr was #1 (15 wickets), with plenty of support from Mair (10) and Carson (9).
Fielding was a hallmark of New Zealand’s campaign in an otherwise low catching standard for a World Cup. Bates (7 catches), Maddy Green (6), and Devine (5) dominated the catching charts.
Devine doesn’t necessarily like the cringy ‘Devine intervention’, but this time, maybe it was divine intervention.
Sometimes, what is bound to happen will happen. Sometimes there is no way to hold back the river.
37-year-old Suzie Bates. 35-year-old Sophie Devine.
Two legendary players of New Zealand cricket have won the World Cup, What a day in Cricket ♥️ pic.twitter.com/WYpE8KzXkU
What Can We Learn from Sophie Devine and the White Ferns?
After narrowly missing on the 2010 T20 World Cup win and consecutive World Cup defeats, Devine and Bates never gave up. Sometimes the universe does conspire to reward those who refuse to quit.
I’ll leave you with a final Alchemist quote,
“People are capable, at any time in their lives, of doing what they dream of.”
– Paul Coelho, The Alchemist
It doesn’t matter whether you are beginning your career or are towards the close. It is never too late to dream. Keep on dreaming even if it looks like the hope is fading away.
This is a remarkable victory, one of the greatest in New Zealand’s sporting history for sure. Remember though, more than winning, the journey is important, as it was in both Santiago & Devine’s cases. In Devine’s own words,
“I have played for 17-18 years now. It [World Cup win] will be something that will come with so much loss and hard times but also incredible memories and people along the way.”
– Sophie Devine
And why not end it with my favorite clip of the 2024 T20 World Cup?
The 2024 T20 World Cup is around the corner and only question is in everyone’s mind—Can the mighty Australians be defeated?
In 8 T20 World Cups so far, they have won six, were runners-up and semi-finalists in the other two. West Indies & England are the only other two winners, although India & South Africa have upped their credentials recently in the shortest international format.
The World Cup has been moved from Bangladesh to the UAE, and Scotland are the newest entrants in the Women’s T20 World Cup.
The format? 10 Teams, 2 Groups of 5 followed by semi-finals and a final:
Group A: Australia, India, New Zealand, Pakistan, Sri Lanka
Group B: Bangladesh, England, Scotland, South Africa, West Indies
I went through all 150 players’ ESPNCricinfo profile pages and accumulated this data so you don’t have to. Without further ado, here is a quick snapshot of what you can expect in the Women’s 2024 T20 World Cup.
Key Takeaways
Bangladesh & Scotland are fielding the youngest units (averaging the age of 25), while Sri Lanka (30) and West Indies (29) have the oldest average age.
Australia has the most experienced squad averaging about 66 matches per player, while Scotland has the least experience, averaging 33 matches per player.
India has the highest total number of runs scored (13,820) followed closely by Australia (12,163), England (11,769), and New Zealand (11,376).
West Indies and Sri Lanka have the highest total number of wickets taken (592 each), while Scotland (261), Bangladesh (302), Pakistan (389), and India (421) have the lowest.
Australia have won each of their last 10 T20Is, England has won 9/10, and New Zealand has lost all 10 out of 10.
Here is a quick statistical glance at each team separated by groups.
Table of Contents
Jump to the preview of the team you want to look into or predictions at the very bottom.
2024 T20 Women’s Cricket World Cup: The Ultimate Preview
*Note: The average T20I experience and average age are rounded up.
1. Australia T20 World Cup Preview
World Cup History: SF, Won, Won, Won, Runners-Up, Won, Won, Won
Last 10 Matches (Most Recent First): WWWWWWWWWW
Group Stage Opponents (In Order): SL, NZ, Pak, Ind
Australia Team Characteristics
Average T20I Experience
66 Matches (980 among 15 players)
Average Age
28
Total T20I Runs
12,163
Total T20I Wickets
568
# of Left Handed Batters in Top 8
2
# of Bowling Options
12 (7 Right Arm Pace, 2 Off Spin, 2 Leg Spin, 1 Left Arm Spin)
# of Keeping Options
2
Strengths
The Australian all-rounders are the envy of the world: Ellyse Perry, Tahlia McGrath, and Ash Gardner to name a few. Key to Australia’s bowling strategies, they are also the engine room. Time and time again, rescuing Australia or providing the big finishes. And in case any of them have to be left of the XI, Annabel Sutherland is waiting in the wings. Amazing depth!
Weaknesses
Will the lack of Meg Lanning leave a whole in the middle order? Also, how will Healy take the pressure of T20 World Cup captaincy? Also the heat in the UAE has been a talking point leading up to the makeshift World Cup in the UAE.
Look Out for
With the Ball: Sophie Molineux. Her spin will be crucial to keeping the run rate down in UAE conditions.
With the Bat:Phoebe Litchfield. This 21-year old future star is averaging 42.5 and striking at 158.38 in her 10 inning T20I career so far.
World Cup History: Round 1*, Round 1, Round 1, Round 1, Round 1
Last 10 Matches: LWWLLLLLLL
Group Stage Opponents: Sco, Eng, WI, SA
*qualified for the first time in 2014
Bangladesh Team Characteristics
Average T20I Experience
42 (619 among 15 players*)
Average Age
25
Total T20I Runs
4,944
Total T20I Wickets
302
# of Left Handed Batters in Top 8
1
# of Bowling Options
9 (4 Right Arm Pace, 3 Leg Spin, 1 Left Arm Spin, 1 Off Spin)
# of Keeping Options
1
Fun Fact: 2 Debutants in the Squad
Strengths
Sultana is carrying some form from the Asia Cup—48*(59), 62*(37), and 32 (51).
Weaknesses
After the Asia Cup, Bangladesh made five changes to the World Cup squad with Rumana Ahmed, Rubya Haider, Ishma Tanjim, Sabikun Nahar, and Shorifa Khatun dropped. Unsettled squad is not a good sign going to a world cup. Also the noise outside of cricket may affect the players. With the revolution in Bangladesh and the WC moved out from Bangladesh to the UAE, things are all over the place for the Tigers currently.
Look Out for
With the Ball:Jahanara Alam, one of the faster bowlers in women’s cricket, can she make use of the UAE pitches to the fullest?
With the Bat:Nigar Sultana. Captain will have to lead from the front if Bangladesh has any chance.
Expected Starting XI: 1. D Akter, 2. M Khatun, 3. Mostary, 4. Sultana (WK), 5. Nehar, 6. S Akter, 7. R Moni, 8. R Khan, 9. N Akter, 10. Alam, 11. S Khatun
World Cup History: Won, Round 1, Runners-Up, Runners-Up, SF, Runners-Up, SF, SF
Last 10 Matches: LWWWWWWWWW
Group Stage Opponents: Ban, SA, Sco, WI
England Team Characteristics
Average T20I Experience
60 (890 Matches Among 15 Players)
Average Age
26
Total T20I Runs
11,769
Total T20I Wickets
474
# of Left Handed Batters in Top 8
1
# of Bowling Options
12 (3 Right Arm Pace, 1 Left Arm Pace, 2 Left Arm Spin, 4 Off Spin, 2 Leg Spin)
# of Keeping Options
2
Strengths
Momentum. England have won 9 out of their 10 recent T20Is, although they lost the most recent one against Ireland—A team that did not qualify for the T20 World Cup. Another strength is the core experience in Danni Wyatt, Heather Knight, Amy Jones, and Nat Sciver-Brunt.
Weaknesses
The lower middle order has not had much of an opportunity.
Look Out for
With the Ball:Sophie Ecclestone and Lauren Bell. Ecclestone has been at her economical best this year: 4.75, 7.5, 4.25, 3.88, 4.75, 9.0, 8.5, 6.25, 4.0, 7.5. Bell has taken 2 wickets or more in six of her last T20Is.
With the Bat: Sophia Dunkley is the next big player in England cricket. She has already proved her credentials in ODIs. Can he make her name in the shortest format?
Injury News
Squad: Heather Knight (C), Maia Bouchier, Sophia Dunkley, Bess Heath (WK), Amy Jones (WK), Danni Wyatt, Alice Capsey, Charlie Dean, Danielle Gibson, Sarah Glenn, Freya Kemp, Nat Sciver-Brunt, Lauren Bell, Sophie Ecclestone, Linsey Smith
World Cup History: SF, SF, Round 1, Round 1, Round 1, SF, Runners-Up, SF
Last 10 Matches: LWWWWW(NR)LWW
Group Stage Opponents: NZ, Pak, SL, Aus
India Team Characteristics
Average T20I Experience
64 (959 Matches Among 15 Players)
Average Age
27
Total T20I Runs
13,820
Total T20I Wickets
421
# of Left Handed Batters in Top 8
3
# of Bowling Options
12 (3 Right Arm Fast, 1 Left Arm Spin, 1 Leg Spin, 7 Off Spin)
# of Keeping Options
2
Strengths
The opening pair. Mandhana is striking at 122.82 at an average of 45 this year with fifties, while Shafali is averaging 36.16, striking at 132.72, and has 3 fifties, including an 81.
Weaknesses
Potentially unsettled batting order. In the last few matches, India have had a flexible middle order, which can both be a good or bad thing. Finalizing Rodrigues & Deepti Sharma’s batting position will do India a world of good. Deepti’s finish in the Hundred final was one for the ages.
With the Ball:Radha Yadav. This tournament might be one for left arm spinners in the UAE, and Radha Yadav is no exception.
With the Bat:Jemimah Rodrigues. She has already played a T20Is at the age of 24. Strike rate is at the lower end of 114.26, but is averaging 30.5 with 11 fifties, the glue that keeps the batting order together.
World Cup History: Runners-Up, Runners-Up, SF, Round 1, SF, Round 1, Round 1, Round 1
Last 10 Matches: LLLLLLLLLL
Group Stage Opponents: Ind, Aus, SL, Pak
New Zealand Team Characteristics
Average T20I Experience
60 (891 Matches Among 15 Players)
Average Age
27
Total T20I Runs
11,376
Total T20I Wickets
549
# of Left Handed Batters in Top 8
1
# of Bowling Options
13 (8 Right Arm Fast, 3 Off Spin, 1 Left Arm Spin, 1 Leg Spin)
# of Keeping Options
1
Strengths
Suzie Bates. One of the greatest of all-time, Bates has given NZ decent this year: 43, 38, 16, 16, 33, 34, 19. Can she convert and play the match winning innings?
Weaknesses
New Zealand has been in complete disarray recently. Have not qualified for the semi-finals in the last 3 T20 World Cups and have lost all of their last 10 T20Is. The experienced Sophie Devine isn’t standing up consistently with the bat. Apart from the two fifties this year, she has scores of 17,0,9,5,12,4, and 5.
Look Out for
With the Ball:Amelia Kerr. Just watch her googlies. Talent for the ages.
With the Bat:Amelia Kerr. Also has a 232 in her name in ODI cricket. Can do everything.
Squad: Sophie Devine (C), Isabella Gaze (WK), Maddy Green, Georgia Plimmer, Suzie Bates, Brooke Halliday, Amelia Kerr, Eden Carson, Fran Jones, Leigh Kasperek, Jess Kerr, Rosemary Mair, Molly Penfold, Hannah Rowe, Lea Tahuhu
11 (4 Right Arm Fast, 1 Left Arm Fast, 2 Leg Spin, 2 Left Arm Spin, 2 Off Spin)
# of Keeping Options
2
Strengths
The Top 4. In the 3 matches Pakistan has won in their 10 matches, they have chased 87, chased 107 against UAE without loss (Feroza 62*, Ali 37*), and put up 181 against South Africa (Ali 45, Amin 28, Dar 29, Sana 37*).
Weaknesses
Apart from Sadia Iqbal (who has 24 wickets this year), there are no other standout performers: Nida Dar (13), Sana (7), Sandhu (7), Hassan (7), Baig (6).
Look Out for
With the Ball:Nida Dar. The stalwart is no longer the captain, but still the heart of the team. Has scored a few 20s recently, but can she convert it to 40s or 50s?
With the Bat:Sadia Iqbal. Another left arm spinner to look out for. Has taken 42 wickets in the last two years. Her bowling strike rate this year is 14.5, down from 22 and 24 in the previous two years.
World Cup History: Qualified for the first time in 2024
Last 10 Matches: WWLWWWLW(NR)(NR)
Group Stage Opponents: Ban, WI, SA, Eng
Scotland Team Characteristics
Average T20I Experience
33 (494 Matches Among 15 Players)
Average Age
25
Total T20I Runs
5,024
Total T20I Wickets
261
# of Left Handed Batters in Top 8
0
# of Bowling Options
12 (6 Right Arm Fast, 1 Left Arm Fast, 1 Leg Spin, 4 Off Spin)
# of Keeping Options
1
Strengths
Rising confidence led by the in-form captain, Kathryn Bryce. Scotland is coming off a win against Pakistan in the warm-up matches, a win against England, and most importantly, qualifying for the first time. Also, their schedule is in increasing difficulty: Bangladesh, WI, SA, and England. They may be favorites against Bangladesh and if they can surprise West Indies, you just never know.
Weaknesses
Lack of left handers in the batting order and no left-arm spin options..
Look Out for
With the Ball:Abtaha Maqsood, the leg spinner. Has been consistently among the wickets in the last 3 years, taking 9,10, and 9 wickets respectively. Her economy in 2023 was a miserly 4.86.
With the Bat:Saskia Horley. Across formats, Horley has been in tremendous form, scoring 100, 71, and 43 in ODIs, and following it up with a 48 in the T20 warm-up against Pakistan.
World Cup History: Round 1, Round 1, Round 1, SF, Round 1, Round, SF, Runners-Up
Last 10 Matches: WLWL(NR)WLLLL
Group Stage Opponents: WI, Eng, Sco, Ban
South Africa Team Characteristics
Average T20I Experience
52 (772 Matches Among 15 Players)
Average Age
27
Total T20I Runs
8,733
Total T20I Wickets
352
# of Left Handed Batters in Top 8
0
# of Bowling Options
11 (6 Right Arm Fast, 2 Left Arm Spin, 2 Leg Spin, 1 Off Spin)
# of Keeping Options
2
Strengths
South Africa’s batting order is one of the bests in the world. Starting from the captain, Wolvaardt-Brits all the way down to Kapp-Luus-Tryon. Annerie Dickerson who scored 44*(23) in her last outing, might not even start since Kapp is back.
Weaknesses
Lack of left handers in the batting order.Also, how will South Africa cope without Shabnim Ismail?
Look Out for
With the Ball:Marizanne Kapp. As the tournament approaches the latter part, Kapp’s importance increases. Her ability to set the tone with economical spells up front can set the tone for South Africa.
With the Bat:Chloe Tryon. One of the best finishers in the game and a complete all-rounder, watch out for Tryon if matches get close.
The lower middle order. While Gunaratne-Samarawickrama-Athapaththu, and Dilhari make up a strong Top 4, if they were to collapse, Sri Lanka would have a tough time coming back into the game.
Look Out for
With the Ball:Udeshika Prabodhani. With 80 wickets at 22.41 average, it is a pretty impressive accomplishment for a left arm medium.
With the Bat: Cannot look past Chamari Athapaththu. In Asia Cup, she had scores of 119*(69), 49*(35), 63 (48), and 61 (43).
Ash Gardner & Georgia Wareham are both cleared after they suffered concussions due to a clash in warm up drills.
Darcie Brown has recovered from foot stress fracture.
Broken Dreams
Final T20 World Cup for the likes of Ellyse Perry, Alyssa Healy, Nida Dar, Heather Knight, Stefanie Taylor, and Harmanpreet Kaur?
Stalwart Jess Jonassen was left out of the squad even though Healy mentioned there was a small window of hope of her comeback if things change a few days before the World Cup.
Kate Cross and Tammy Beaumont, England legends and mainstays in the ODI squad, have been left out of the T20 World Cup squad. Shabnim Ismail had already retired, marking a few years of transition to come in women’s cricket.
BCD’s 2024 T20 World Cup Predictions
Finally, let’s get to the predictions!
Category
Team/Player
Winner
England
Runners Up
South Africa
Broken Dreams
India, Australia, Another Heartbreak for South Africa?
Most Runs
Laura Wolvaardt
Most Wickets
Sophie (Molineux & Ecclestone)
Player of the Tournament
Sophie Ecclestone
Surprising Factor
Scotland Wins At Least One Match, Sri Lanka Get to #3 in the Group
****
Thank you for reading! Comment below, what are your predictions for this T20 World Cup?
If you like reading about Women’s Cricket, you may also like:
That got me thinking—How expensive is it to watch cricket around the world?
To conduct this analysis, I went through the checkout process and attempted to buy tickets for different types of matches in the first 10 Test playing nations.
If you would like to listen to an engaging conversational AI generated podcast about this article, check this out.
Key Takeaways
England & Australia are the most expensive places to watch cricket (they also have the most opportunities to watch along with India). Ticket prices can range from $185-1400 in a season for England to watch a couple of days of Tests, a few County matches, a few Hundred & Vitality Blast games, and 2-3 limited over internationals.
On the other hand, in Bangladesh, Sri Lanka, and Zimbabwe, a fan can watch matches for as low as $1 USD and can watch several games in a season for about $100 on the higher end.
Watching domestic cricket is completely FREE in India, New Zealand, and South Africa (both List A & 4-day). All you need to do is show up at the stadium (So GO, what are you waiting for?)
Cost of Watching Cricket: Most Expensive Places to Watch Cricket Around the World
We will provide ranges and consider a few different categories (if data is available):
Limited Over Internationals (LOI) – both men’s & women’s
Test Matches
Domestic Competitions
Franchise Leagues
For the sake of the cost comparison, we will be looking at General Admission ticket for Adult guests (in some countries like England, ‘members’ of the club receive discounted prices given that they have paid the annual membership fee). This analysis does not include member prices, bundles, or other discounts (or service/handling fees & taxes).
Note: These are ballpark ranges. Ticket prices may vary based on the match (for example, knockout and Finals matches may be more expensive) and the stadium.
If a spectator in England watched 2 days of a men’s Test, 5 County games, 1 men’s international, 2 Vitality Blast matches, 2 Hundred matches, 1 ODI cup, one women’s international, and 1 Women’s Hundred match in a season, they would spend (on tickets alone) between $260-$504 depending on the stadium and up to $1393.3 if they only chose premium seating.
Monthly Cost of Living: $1929
Average Monthly Net Salary: $3288.55
Annual Inflation Rate: 2.5%
Estimated Monthly Savings: $1359.55
Percent of Savings Spent on Cricket (Live): 4.54%-34.16%
*These economic numbers are for the United Kingdom as a whole, not just England.
Type of Match
General Admission Ticket Price (Adult)
Premium Tickets
A Day of a Test
£38-85 ($50.6-113.1)
£95-145 ($126.6-192.9)
Men’s LOI
£20-40 ($26.6)
£135 ($179.9)
Women’s LOI
£5-10 ($6.7-13.3)
£65 ($86.6)
County
£6-15 ($8.0-20.0)
£23 ($30.6)
Vitality Blast
£15-25 ($20-33.3)
£150 ($199.5)
The Hundred
£11 ($14.7)
£35 ($46.6)
One Day Cup
£5-20 ($6.7-26.6)
£37 ($49.2)
*These are ticket prices for non-members
How Did We Estimate the Ticket Price Range?
The international costs above are estimated from the upcoming England-Zimbabwe Test, India-England Women T20I series, and the men’s South Africa-England series, while the domestic costs are a ballpark number based on perusing several County’s websites.
Note: The prices for domestic price tickets in England vary vastly based on the County/stadium. For example, Kia Oval is at the more expensive side: £15-20 for County Championship matches, £32-40 for Vitality Blast, £40-85 for a men’s T20I, £18-30 for a women’s T20I, and £85-145 for a Test match.
Other Costs: Car Parking (£5+), Guided Tours: (£0-30), Full Season Membership (£240-270), Food, Drinks, Concessions (varies)
Where To Buy Tickets: Tickets can be purchased on the County, stadium, or ECB website. For international matches, you have to enter a ballot and hence, may not be guaranteed a ticket if there is high demand.
If a cricket fan in Australia went to watch 2 days of a men’s Test, 1 ODI, 1 Sheffield Shield match, 2 BBL matches, one women’s international, and 1 WBBL match in a season, they would spend (on tickets alone) at least $180 AUD ($122.6 USD)and as much as $900 $(613 USD) if they chose the premium seating.
Monthly Cost of Living: $1,944
Average Monthly Net Salary: $3,819.73
Annual Inflation Rate: 3.5%
Estimated Monthly Savings: $1875.73
Percent of Savings Spent on Cricket (Live):2.2%-10.89%
Day 4 Tickets: For the Boxing Day Test MCG, the General Admission has a starting price for $30 with reserve stands as high as $85.
Type of Match
General Admission Ticket Price (Adult)
Premium Tickets/Lounge/SkyDeck
A Day of a Test
$30 AUD ($20.4 USD)
$170 AUD ($115.8 USD)
Men’s LOI
$30 ($20.4)
$170 ($115.8)
Women’s LOI
$20 ($13.6)
Domestic Cricket
$10 ($6.8)
Franchise Cricket(BBL)
$27.5 ($18.7)
$165 ($112.4)
WBBL
$10 ($6.8)
*Note: For some Tests (for example, Adelaide BGT, there are ‘Twilight Adult’ prices if the entry is after 5 PM at a discounted price of $22.5).
Watching 2 days of a Test, 2 SuperSmash matches, a men’s limited overs game, and a women’s limited over game can cost anywhere between $109 to $160 in a season.
Monthly Cost of Living: $1782
Average Monthly Net Salary: $3156.96
Annual Inflation Rate: 3.1%
Estimated Monthly Savings: $1,374.96
Percent of Savings Spent on Cricket (Live):1.96%-2.81%
Type of Match
General Admission Ticket Price (Adult)
Premium Tickets
A Day of a Test
$45 NZD ($28 US)
$70 NZD ($43.6)
Men’s LOI
$35 ($21.8)
$65 ($40.5)
Women’s LOI
$20 ($12.5)
Domestic Cricket
FREE
SuperSmash
$15 ($9.4)
*Note: A Test Match Pass (all 5 days) can be purchased, which ranges from $145-220 NZD.
Entry to Plunkett Shield (first class) and Ford Trophy (List A) are free.
Two days of a men’s Test, 1 Men’s ODI, 1 Women’s ODI, and 2 SA20 matches in Bangladesh would cost a spectator somewhere in the range of $44-89 in one season.
Monthly Cost of Living: $974
Average Monthly Net Salary: $1446.04
Annual Inflation Rate: 4.9%
Estimated Monthly Savings: $472.04
Percent of Savings Spent on Cricket (Live):3.1%-6.3%
In India, watching 2 days of a men’s Test, 1 ODI, 2 IPL matches, 1 women’s international, and 1 WPL match in a season, would cost (on tickets alone) between $30-140 on the lower end and about $294 on the higher end over a season. Keep in my end, that or certain IPL teams like RCB, tickets can go as high as $634 alone!
Monthly Cost of Living: $423
Average Monthly Net Salary: $633.49
Annual Inflation Rate: 4.6%
Estimated Monthly Savings: $210.49
Percent of Savings Spent on Cricket (Live): 14.25%+
*This is a bit skewed since population of India has widespread economic disparity. Those who can probably afford to purchase tickets are the only ones that would purchase those premium/VIP tickets.
Type of Match
General Admission Ticket Price (Adult)
Premium/VIP
A Day of a Test
INR 125-200 ($1.5-2.4)
INR 1000-2000 ($12-24)
LOI
INR 750 ($9)
INR 10000 ($119.8)
Women’s International
FREE*
INR 150 ($1.8)
Domestic Cricket
FREE
IPL
INR 700-5000 ($8.4-60)
INR 5000-52938 ($59.9-$634.4)
WPL
INR 100-500 ($1.2-6)
As per Hindustan Times, “Pricing is decided as per demand and supply, affordability, culture, and the eagerness of the people to pay” when it comes to IPL prices. Hence, there is a wide range in IPL tickets depends on which player/teams are playing and when the ticket has been purchased.
Here are some other notes:
Non-international matches are free to attend.
*The entry to women’s Test between India & South Africa was free, while the T20Is were priced for INR 150.
Long story short, watching sports can be a fun and expensive experience.
Final Thoughts
The main thought of writing this article was to answer the question, “Is cricket affordable for the common man?”
With rising cost of living standards around the world and mobile/TV accessibility of cricket, are boards doing enough to incentivize followers to go to the ground?
In general, cricket is not as expensive as other sports. However, if Test cricket is to survive, £95 Day 4 tickets is probably not going to help.
If the trend continues, cricket will become only an elitist game. It began as an elitist game, but do we want to keep it that way?
If you are interested in cricket & finance, consider checking out the following:
Umpires bringing out their light meters out is a common sight in England’s overcast conditions.
We cannot control the weather. So, how can we fix this?
Several proposals have come up over the years: Better Drainage systems (see Sri Lanka), pink ball all the time (especially England), and earlier starts in the day for late-summer months.
All are good ideas, but let’s consider another idea that has been vaguely mentioned—A covered or ‘retractable’ stadium.
Remember that one stadium where the Shahid Afridi hit 12 runs in one ball? Yep, that’s the one.
Key Takeaways
In one of our previous analysis, “How Much Money Does It Take to Host a Test Match?,” we estimated that it takes about $350,000-$1.4 million per 5-day Test depending on the technology used i.e. about $70,000-$280,000 per day of cricket.
It takes about $100-$150 million to add a retractable roof in a stadium (although in some cases the expenses ballooned up to $300 million). For maintenance & repairs, a future budget between $20-30 million needs to be kept aside.
It would take about 357-4,286 days of rain affected matches for the cost of the retractable roof to recover*
In England’s 2024 home season (men’s), six days were rain-affected, one of which was washed out and 5 others were affected by bad light. In 2023, 9 Tests & 5 ODIs were impacted by rain, five of which were no results or complete wash outs. At least 2-5 Hundred matches were marred by rain as well.
The 2024 T20 World Cup had 8 rain-affected games with four abandonments, while the 2019 ODI WC in England had 3 washouts, 4 reduced matches, and one two-day semi-final contest.
*If the roof is only used for international cricket and no other sport
The NFL cannot afford to lose millions of advertising dollars due to weather or unnecessary delays, so they are more inclined to pick stadiums with a covered roof.
Rick Schlesigner, the CEO of Brewers said that he is “very pleased with the roof.” As of 2018, the roof had been used 4,014 times and had “delivered its promise to fans.”
What About Maintenance?
Building the stadium is only a part of the equation, recurring repair & maintenance costs is the other. Brewers’ have estimated that future repairs, maintenance, ironworkers, engineers, roofers will cost about $37.1 million.
Building NFL stadiums is already a costly endeavor. According to Constructive Dive, the overall construction cost for the SoFi Stadium in Los Angeles cost a record $5.5 billion (most expensive stadium ever built), Mercedes-Benz Stadium in Atlanta was about $1.5 billion, and the U.S. Bank Stadium in Minneapolis was about $1.2 billion.
Similar, the owner of the MLB team, New York Mets, estimated that it would take them $800 million to add a retractable roof, while it would have only costed $125 million if it were to be installed during construction.
Here are a few examples of stadiums from different sports and how much their construction cost for a covered stadium. This is not an exhaustive list by any means.
Although cricket was a pioneer in adopting technologies like Hawkeye, it is way behind in architectural investment and innovation.
Archibald Stadium – Carrier Dome ($26.85 Million)
Sport: College Football
Location: Syracuse, New York
Capacity: 40,000
In 1980, Carrier Dome at Syracuse University was one of the first covered domes and the largest collegiate dome. It cost about $27 million back then. The dome was later renovated in 2021 for $118 million.
Huntington Bank Field, Cleveland Browns ($2.4 Billion – Proposed)
Sport: NFL
Location: Cleveland, Ohio
Capacity: 70,000
The proposed $2.4 billion investment for the dome would be split between public and private financing, making the $1.2 billion allocated for private investment as the largest private per capita stadium investment in the country.
This stadium will utilize ethylene tetrafluoroethylene (ETFE), essentially a plastic-see through roof. This is based of other stadiums that have used ETFE like the Allianz Arena in Munich, Dunedin’s Forsyth Barr Rugby stadium (cost around $200 million overall), Las Vegas bowl, and Bejing.
The ‘Big O’ Montreal Stadium ($875 Million – Proposed)
Sport: Olympics Stadium
Location: Montreal, Canada
Capacity: 73,000
*Note: The 1976 Olympic stadium is getting a makeover with the roof itself costing $875 million. The replacement roof will not be retractable, but will be translucent to allow for sunlight.
In most cases, the city that hosts the stadium is responsible for paying for any stadium, construction, and repair costs.
Influx of private partnership is helping alleviate some of the costs that the local government gets burdened with.
Due to the complex funding structure, the planning and construction process can go through political interference, red tape, delays, and budget overruns.
How Will A Retractable Stadium in Cricket Impact Playing Conditions?
Playing conditions play a major role in cricket.
Will the amount of swing decrease in England? Do we want natural elements to go out of the game?
To find out how much money cricket lost to rain, we first figured out how many days were affected by rain.
We will consider the last three home seasons for the England’s men’s team as well the last few ICC tournaments.
England Home Season (Men’s)
*Note: W/O denotes complete wash out. N/R denotes No Result
2024 Season
Rain Affected/Wet Outfield
Bad Light
3rd T20I v Pak (W/O) 3rd Test v WI, Day 2 1st Test vs SL, Day 2 1st Test vs SL, Day 3 3rd Test vs SL, Day 3
1st Test vs WI, Day 1 1st Test vs SL, Day 1 2nd Test vs SL, Day 3 3rd Test vs SL, Day 1 Day 2 Day 3
2023 Season
Rain Affected/Wet Outfield
Ashes 1st Test, Day 3 1st Test, Day 5 2nd Test, Day 1 2nd Test, Day 3 3rd Test, Day 3 4th Test, Day 4 4th Test, Day 5 (W/O) 5th Test, Day 4 5th Test, Day 5 Ire v Ban, 1st ODI (N/R) Ire v Ban, 2nd ODI(45-over ODI) Ire v Eng, 1st ODI (W/O) Ire v Eng, 3rd ODI (N/R) NZ v Eng, 2nd ODI (34-over ODI)
*Note: Not many matches were affected by Bad Light in 2023, most of the interruptions were all rain/wet outfield related.
2022 Season
Rain Affected/Wet Outfield
Bad Light
1st Test* v Ind, Day 2 Day 3 Day 5 (W/O) 2nd Test* v Ind, Day 1 5th Test v Ind, Day 1 Day 2 Day 3 1st Test v NZ, Day 3 2nd Test v NZ, Day 2 3rd Test v NZ, Day 1 Day 3 Day 5 2nd ODI v SA (29-over ODI) 3rd ODI v SA (N/R) 1st Test v SA, Day 1 3rd Test v SA, Day 1 (W/O) Day 2 (W/O)
1st Test v Ind, Day 2 2nd Test v Ind, Day 4 3rd Test v Ind, Day 3 4th Test v Ind, Day 3 3rd Test v SA, Day 3 SA, Day 4
*Note: We exclude these matches from our calculations since the 1st 4 Tests of the Pataudi Trophy were held in 2021
ICC & Other Tournaments
2024 T20 World Cup
2024 (M): Match 6 (N/R), Match 23 (W/O), Match 30 (W/O), Match 33 (W/O), Match 34 (10-over), Match 44 (11.2-over DLS), Match 50 (17-over DLS), Match 52 (19-over DLS)
2023 (W): Match 18 (8.2-over DLS)
ODI World Cup
2023 (M): Match 35 (25.3-Overs DLS)
2022 (W): Match 5 (27-over), Match 20 (20-over), Match 23 (N/R), Aus-WI SF (45-over)
2019 (M): Match 7 (41-over), Match 11 (W/O), Match 16 (W/O), Match 18 (W/O), Match 21 (48-over), Match 22 (40-over DLS), Match 25 (49-over), Ind-NZ SF (2 days)
2017 (W): Match 6 (W/O), Match 21 (24-over DLS), Ind-Aus SF (42-over)
The Hundred
2024 (W): Match 21 (W/O), Match 32 (N/R)
2024 (M): Match 21 (N/R), Match 29 (44-balls), Match 30 (N/R), Match 32 (30-balls)
2023 (W): Match 2 (W/O), Match 3 (W/O), Match 6 (W/O), Match 7 (W/O), Eliminator (N/R)
2023 (M): Match 2 (40-balls), Match 6 (N/R), Match 7 (W/O), Match 11 (NR), Match 18 (90-balls)
2022 (M/W): None
Note: We only consider England’s home season and The Hundred. County Championship, Royal One Day Cup, and the T20 Vitality Blast lose a number of matches.
For a sport that seems to be struggling financially on a larger scale, adding a retractable roof in cricket is, in most cases, a bad idea.
Of course, we cannot build a retractable in every stadium. However, countries that can afford and/or have a dire need may be able to afford this on a case-by-case basis.
For example, the Wankhede, Eden Gardens, or the Narendra Modi Stadium in India, SSC in Sri Lanka, Lord’s in England (in case they host the WTC Final for the next 100 years), and the MCG in Australia for some of the larger occasions.
Richer leagues like the NFL & MLB may help subsidize the cost of ultra-expensive stadiums in the USA. With IPL’s growing wealth, the BCCI may be able to help subsidize these types of stadium enhancements around the world as well. Who knows.
What do you think?
Anyway, retractable roofs in cricket are just one part of the alternative. We will do deep dive into how drainage systems work in cricket and other sports at a different time.
“First problem in solving any problem is recognizing there is one.”
– Will McAvoy, The Newsroom
England cricket is having a mid-life crisis for about a decade now.
Although The Hundred is at the heart of that conversation, we should recognize that the larger issues that plague English cricket are finances and scheduling.
Today, we look at how scheduling has changed for first-class counties over the past 50 years and excavate some patterns.
Let’s dive right in.
Key Takeaways
The Vitality T20 blast is currently at a 133-match season. When it began in 2003 (as the Twenty20 Cup), it was only a 48-match tournament and reached its peak with a 151-match season during 2010-11.
Back in 1962, each County team played between 28-32 matches for a total of 254 three-day matches. 50 years later, The County Championship has become a 126 four-day match affair, where each team plays 14 matches.
48.92% of the 1987 first class season was County Championship matches (204/417), whereas only 34.05% of the 2024 season is County matches (126/370).
In 1975, there were 25 days of international cricket (5 Tests). By the time we got to 2010, the English home season had 51 days of international cricket.
In other news, Tymal Mills has criticized the scheduling of the T20 Blast since international players will most likely miss the final. The finals is slated for September 14th, the same week England-Australia T20Is will take place.
These are all valid issues. However, why is it that the English domestic cricket schedule is scrutinized all the time, but the Indian domestic system is not?
Mainly weather.
English Weather and Summer Break
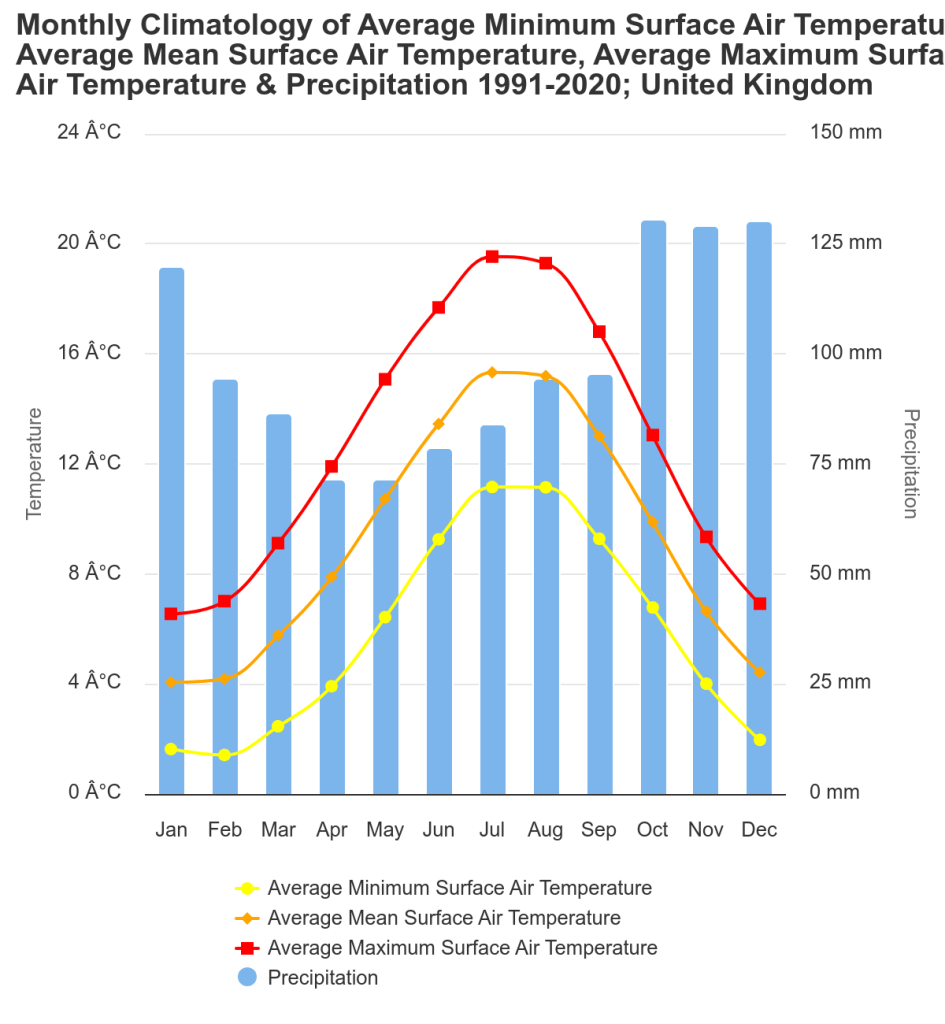
According to the climate portal of the World Bank Group, average precipitation in the UK increases dramatically between September and October from about 90 mm to 130 mm.
May is the driest month, while July is the hottest month.
Attention Spans are Getting Shorter
With AI taking over the world and everybody glued to their phones, it is no surprise that attention spans are getting shorter.
Students in the UK usually have a summer break from mid-July to late August, and schools go back in session around September. That’s not all—The Wimbledon takes place between the end of June & mid-July with the English Premier League following in mid-August.
The challenge for English domestic cricket is to simultaneously capture the attention of the public and escape from rain. Trying to fit international cricket, County Championship, and 3 separate limited over tournaments within 3-4 months and with the same group of players is nigh impossible and borderline, insane.
Indian cricket has the luxury to host the IPL between March-May and still have the Ranji Trophy & their Test between October-February. The rest of the year, India can host bilaterals and other tournaments like the Duleep Trophy, Syed Mushtaq Ali, etc.
English Domestic Season in a Nutshell
The modern English domestic season mainly consists of the following four types of tournament:
County Championship (first class), ODI Cup (List A), T20 Blast (domestic T20), experimental (currently, The Hundred)
For this analysis, we have looked at the schedules of County Championship, T20 Blast, The Hundred,Benson & Hedges Cup, Gillette Cup, Royal London One Day Cup, Sunday League, Bob Willis Trophy, and England’s international schedules.
*Note: Competitions involving National/minor counties, universities, MCC exhibition matches, and and tournaments such as Gentleman vs Players (ran from 1806-1963) are not considered in this analysis.
How Does the Current 2024 Domestic Season Look Like?
In theory, a three-format English cricketer who plays all possible matches in domestic cricket and The Hundred can play a maximum of 125 days of cricket at home given there is no overlap. That is 68.30% of the 183 total days between April 1st and September 30th.
2024 Season (Current Format with the Hundred)
Total Domestic Matches: 370
Max Days of Internationals: 37
Max Day of Domestic Cricket Per County: 88 (56 first class, 32 limited overs)
County Championship: 14 Matches (4 day per match)
Royal One Day Cup: 8
Vitality T20 Blast: 14
The Hundred: 10
International Home Season Breakdown
May 22-May 30: 4 T20Is vs Pakistan (4 maximum days of cricket)
July 10-July 28: 3 Tests vs West Indies (15 maximum days of cricket)
August 21-September 10: 3 Tests vs Sri Lanka (15)
September 11-September 29: 3 T20Is, 5 ODIs (8)
Competition
Type
Matches
Date Range
County Championship
First-Class
126
5 Apr-29 Sept
One Day Cup
50 Overs
77
30 May-14 Sept
T20 Blast
20 Overs
133
24 Jul-22 Sept
The Hundred
100 Balls
34
23 Jul-18 Aug
County Championship (1948-2024)
Before 1988, all County Championship Matches were played as 3-day games. After 1993, all matches became 4-day affairs and between 1988-1992, it was a mix of 3 and 4 day games.
Here are some additional notes:
In 1992, Durham was added as the 18th team in the County Championship. Before 1988, we have 17 teams and 18 teams after.
Between 1960-1962, a team could play a maximum of 32 first class games or a maximum of 96 days of cricket (since County was only 3 days back then).
Between 1988-1991, each team played sixteen 3-day matches (120 matches total) and six 4-day matches.
In comparison, a player in the 2024 County Championship could play a maximum of 14 first class games or a maximum of 56 days of first class cricket (4-day).
The ‘cricketing days’ column is the (number of matches) * (3 or 4) depending if it is a 3-day or 4-day match. This does not represent the actual days played since multiple County matches may overlap on a single day.
Years
Total Matches
Cricketing Days
Matches Per Team
1948-1949
221
663
26
1950-1959
238
714
28
1960-1962
254
762
Mix of 28/32
1963-1968
238
714
28
1969-1971
204
612
24
1972-1976
172
516
20
1977-1982
187
561
22
1983-1987
204
612
24
1988-1991
187
628
22
1992
198
628
22
1993-1999
152
608
17
2000-2016
144
576
16
2017-2019
126
504
14
2020*
46 (Bob Willis Trophy)
184
–
2021
126 (+1 BW Trophy)
508
14
2022-2024
126
504
14
Note*: In 2020, the County Championship was cancelled, and only the Bob Willis Trophy took place.
“There’s never really been a perfect schedule…I thought it worked well when T20s were on Friday nights and there seemed to be a regularity in the season, but I also liked a little bit of B&H & Gillette Cup!”
Between 2003-2019, the format of the T20 Blast, formerly known as the Twenty20 Cup, changed a staggering 7 times ranging from 48-matches to 151-matches.
The Early Years (2003-2009)
The early years had a pretty decent number of matches gradually increasing from 48 to 97.
(Side note: There is no direct correlation between an earlier end date for the T20 Blast and number of rained out matches as we can see from 2007-2008).
Year
Matches
Finals Date
Rained Out Matches
2003
48
19th July
0
2004
52
7th August
4
2005
79
30th July
11
2006
79
12th August
2
2007
79
4th August
19
2008
97
26th July
20
2009
97
15th August
3
Twenty20 Cup (2003-2009)
The Expansion and T20 Blast Scheduling Overkill (2014-2020)
The 2010s were when the scheduling problem amplified not only in the English domestic scene, but also internationally.
The domestic schedule could theoretically afford the increase from 97 games in 2009 to 151 in 2010 since the Gillette Cup & Sunday League ended and morphed into a single ECB 40 competition, but it realistically made the domestic schedule even more complex.
Year
Matches
Finals Date
Rained Out Matches
2010
151
14th August
5
2011
151
27th August
23
2012
97
25th August
20
2013
97
17th August
1
2014
133
23rd August
12
2015
133
29th August
9
2016
133
20th August
15
2017
133
2nd September
16
2018
133
15th September
12
2019
133
21st September
24
2020*
97
4th October
12
T20 Blast (2010-2020)
Post The Hundred (2021-2024)
Year
Matches
Finals Date
Rained Out Matches
2021
133
18th September
13
2022
133
16th July
6
2023
133
15th July
2
2024
133
14th September
10
T20 Blast (2021-2024)
The Hundred
The reason The Hundred has become a point of contention is not necessarily due to the new format created of out of the whim.
Rather, it goes back to attention span. Late July to mid-August is a coveted window in the English domestic calendar.
The Hundred being scheduled during this valuable time slot means that T20 Blast matches becomes a secondary tournament. Furthermore, Test series are delayed to September, where there is a higher likelihood of being affected by rain or bad light. In addition, some rounds of the T20 Blast and the Royal One Day occur during this time, which means County teams have to find a second XI to field their teams (since most marquee players would be at The Hundred).
Year
Starting Date
Ending Date
2021
23rd July
18th August
2022
1st August
27th August
2023
3rd August
3rd September
2024
21st July
21st August
The Hundred (2021-2024)
T20 Vitality Blast Attendance
In 2003, the Vitality Blast begun with an attendance of about 257,759. Over the years, the attendance has ebbed and flowed and has slightly dipped since the inception of the 100-ball competition:
The Hundred is not the first time England cricket is pioneering a new format. They started with 65 overs back in the early 1960s, created a 40-over tournament that built the backbone of England’s 2009 WC winning squad, and are now experimenting with 100-ball cricket.
Here is a brief timeline:
2014-2024: Royal London One Day Cup
2021-2024: The Hundred
2010-2013: ECB 40
1972-2002: Benson & Hedges Cup (55-overs first few years, then 50 overs)
1969-2009: Sunday League/National League/NatWest Pro40 (50, 45, then 40 overs)
By 1975, the modern English domestic season was established, and ODI cricket had taken its root in England. This was an interesting season because it also had an Ashes series and the inaugural ODI World Cup.
Max Days of Internationals: 25
Max Days of Domestic Cricket Per County: 88 (60 first class, 28 limited overs)
County Championship: 60 (20 matches)
Sunday League: 16
Benson & Hedges Cup: 7
Gillete Cup: 5 (Knockout format)
County Championship
Gillete Cup, Sunday League, Friends Provident Trophy
International Home Season
10 July 1975-3 September 1975: 4-Test Ashes (20 days max)
ODI World Cup: 5 Matches Max (3 Group, semi-final, and final)
2010 Season (Inaugural ECB40, Expansion of T20 Blast)
Total Domestic Matches: 424
Max Days of Home International Cricket: 51
Max Days of Domestic Cricket Per County: 96 (64 first class, 32 limited overs)
County Championship: 64 (16 matches)
T20 Blast: 18
ECB 40: 14
International Home Season
May 27-June 6: 2 Tests vs Bangladesh (10)
June 22-July 3: 5 ODIs vs Australia (5)
July 8-July 12: 3 ODIs vs Bangladesh (3)
July 29-August 26: 4 Tests vs Pakistan (24)
September 5-September 7: 2 T20Is vs Pakistan (2)
September 10-September 22: 5 ODIs vs Pakistan (5)
Note: Prior to the home season, 2010 T20 World Cup occurred between April 30-16 May in the West Indies, and England were the winners. They played 7 matches during this campaign.
Max Days of Domestic Cricket Per County: 95 (57 first class, 38 limited overs)
County Championship: 56 (14 matches)
1 tour Match
Vitality T20 Blast: 17
One Day Cup: 11
The Hundred: 10
International Home Season
June 1-4: 1 Test vs Ireland (4-Day Test)
One tour Match took place
June 16-July 31: 5-Test Ashes vs Australia (25)
August 30-September 15: 4 T20Is, 4 ODIs vs New Zealand (8)
2 Tour matches
September 20-26: 3 ODIs vs Ireland (3)
*Note: The ICC World Test Championship took place between 7-11th June at the Oval.
Competition
Type
Matches
Date Range
County Championship
First-Class
126
6 Apr-29 Sept
One Day Cup
50 Overs
77
1 Aug-16 Sept
T20 Blast
20 Overs
133
20 May-15 July
The Hundred
100 Balls
34
1 Aug-27 Aug
Final Thoughts
From the ECB point of view, I get it. More limited over matches means more attendance, and in the long term, better financial stability (hopefully), but is the overkill of cricket really worth it?
“We all recognise that the Twenty20 Cup has been a startling success…Yet I would make a plea to the ECB and the administrators around the counties who smell a golden goose…Cricket is not good at this. At international level, look at the congested schedules that are exhausting players and spectators alike. Short-term greed will backfire.“
– Vic Marks
That was 2003, when the Twenty20 Cup was only 48 matches, and The Hundred did not exist. 21 years later with the proliferation of franchise leagues and ICC tournaments every year, the situation has become even worse.
The ECB continued with the same 133-match format for the T20 Blast even after The Hundred. Maybe there is a case to go back to 2005-07 format, where 79-matches were played throughout or abolish The Hundred altogether.
Is there a Solution to England’s Schedule Woes?
Is there a solution?
Probably, but that is beyond the scope of this article (I have a ‘truly marvelous’ solution to this issue, but the margins are too narrow to contain it).
However, little changes can go a long way.
For starters, as Adam Collins argues on his podcast, scheduling September Test matches earlier in the day or adding lost overs to the beginning of the next day can be a start.
Does Test cricket in the UK start too late in September?
🗣️ "Surely it's 10:30 starts? Why are we starting a Test match in September at 11?" – @collinsadam
Remember, today’s goal was not to solve England’s domestic scheduling problem. Rather, it was to realize that this is the main problem for England’s administration to solve.
****
Thank you all for reading!
What do you all think about how to resolve the domestic English schedule? Comment below, would love to know your thoughts!
If You Like Reading about Problems & Solutions in Cricket, you may enjoy
All IPL owners are expected to bid in sale of The Hundred teams for a minority stake and change the name of franchises. This would add to the list of growing influence of IPL teams in world franchise cricket—CPL, SA20, MLC, ILT20.
Jay Shah becomes the youngest chair of the ICC, unanimously elected. Three of the last 4 ICC chairs have been Indian. In the last 15 years, Sharad Pawar (as president), N Srinivasan, Shashank Manohar, and Jay Shah have served at the highest ranked ICC position.
****
What Should India’s Role Be in the World?
India has clearly solidified its status as both a soft and hard power in world cricket now. One can even say that the BCCI has become a quasi-monopoly.
Now that it has established its dominance, what’s next? One question that currently keeps me up at night is,
“What should India’s role be in the cricketing world?”
Should the BCCI be doing more for the cricket world or should they act solely for Indian cricket’s self-interest?
Based on the current trajectory, there are three distinct possibilities how India’s reign will turn out:
(1) Absolute power corrupts the BCCI absolutely and results in the complete downfall of the ICC and international cricket as a whole.
(2) The BCCI focuses on enriching Indian cricket only, and the IPL becomes an all year round phenomenon.
(3) Indian cricket administration takes a vocal role in expansion of cricket in the world, leads the revival of cricket in smaller nations, and takes them along as the BCCI grows financially.
Since the first point is an extreme case, we will rule this out for the rest of our discussion and direct our focus on the final two points.
We will explore what can happen if the BCCI only focuses on its self-interest by utilizing Adam Smith’s ‘invisible hand,’ dig deeper into the possibility of India helping other nations by employing Smith’s ‘impartial spectator’ & Jean-Jacques Rousseau’s ‘mirror,’ and keep up the hope of India becoming world cricket’s ‘Brother’s Keeper’ by studying this Bible verse as well as a Sanskrit shlok.
The Invisible Hand
Imagine you are having a lavish dinner at a restaurant. The chefs, waiters, and all the other staff are at your service with a smile. The food is delicious.
All in all, a great time.
But let’s hold back a moment and reflect—Did you come to the restaurant to help the chefs and waiters?
No.
You went there only to enjoy a nice meal and have a good evening. Did the chef and waiters do their best only to please you?
Probably not. They were doing their duty, and you happened to be a beneficiary.
And that folks is what Adam Smith calls the ‘invisible hand.’ Smith states that it is “not from the benevolence of the butcher, the brewer, or the baker that we expect our dinner, but from their regard to their own interest” (Theory of Moral Sentiments). Basically the implicit idea behind free market capitalism.
We can apply this same idea to how Indian cricket can proceed in the future. Contrary to the popular belief, the BCCI can choose to only focus on the betterment of Indian cricket, and it might actually not turn out to be a bad thing for the rest of the nations.
If Indian cricket and the brand value of the IPL grows, the pay checks will get bigger, the standard of facilities will rise, and more people in the world (even non-cricketers) will gain employment. Overseas cricketers and coaches will become better, young kids from around the world will pick up cricket as a sport organically, and the sport will grow competitive with abundant prospering talent.
Choice 1: Follow your own interests, and the others will grow as a by product.
I Am My Brother’s Keeper
While self-preservation can be a driver for progress, on the opposite end of the spectrum is using power as a tool to help others.
A passage from Ezekiel 25:17 in The Bible embodies this idea perfectly,
“Blessed is he who, in the name of charity and goodwill, shepherds the weak through the valley of darkness, for he is truly his brother’s keeper, and the finder for lost children.”
Much of cricket’s problems stem from the imbalance between the different nations. Poorer financial health, unstable governments, lack of domestic awareness.
Bangladesh promises yet never delivers, West Indies excites with an underlying sense of nostalgic disappointment, Pakistan is well…Pakistan, Kenya disappeared, and Zimbabwe is as close to the rope of disappearing as Suryakumar’s catch was on the 29th of June.
Maybe a better redistribution of wealth, an odd tri-series with India as a participant, more TV rights, etc. can help tip the scales back in balance.
A prominent Sanskrit Shlok captures this sentiment:
“Sarve Bhavantu Sukinha” May all be happy
“Sarve Santu Nirayamaya” May all be free from illness
“Sarve Badryani Pashyantu” May all see what is auspicious
“Maa Kaschid-Dukha-Bhaag-Bhavet” May no one suffer
“Ohm Shanti Shanti Shanti” Om Peace, Peace, Peace
The world is a better place when everybody prospers and nobody suffers.
If we focus on doing good for the larger masses of people, then the society will benefit and in turn, the individual will be prosper as well. In our scenario, if the BCCI makes their aim to help cricket grow as a sport worldwide and use their monetary power to support other struggling nations, then it will help them in the longterm as well.
Choice 2: The ones in power have a moral obligation to help others for the sake of doing the right thing.
Individuality Versus The Collective Good
Let’s not be naive.
There is no way that the BCCI takes ownership of becoming the cricket world’s caretaker. Or is there?
Human beings are complicated.
We are not merely satisfied by our own successes. What do we sometimes value more?
External validation.
Rousseau describes this aptly—“Social man lives always outside himself, he knows how to live only in the opinion of others…from their judgment alone that he derives the sense of his own existence” (Discourse on Inequality). We do not judge ourselves honestly. Rather, we take society as a mirror and judge ourselves as a reflection to others.
This is where things get interesting. By all objective measures, India is doing well. They are winning World Cups, have the approval of billions of fans, and have the power.
But you can sense that the BCCI wants something more. They are trying everything to be a little bit bigger, better, grander (see: Building a 100,000 spectator stadium to host the World Cup final….).
So with self-interest and external validation as the chief motivators, is India heading in the wrong direction?
Not quite.
And this is where Adam Smith comes back to the picture.
Impartial Spectator
Smith partially agrees with Rousseau that individuals do not necessarily uplift others for the sake of uplifting others.
He asserts that it is “not the soft power of humanity” or the “feeble spark of benevolence which Nature has lightened up in the human heart.”
Rather, it is a “stronger power, a more forcible motive. It is reason, principle, conscience, the inhabitant of the beast, the man within, the great judge and arbiter of our conduct.”
He calls this strong internal force—The impartial spectator from which “we learn the real littleness of ourselves…and the natural misrepresentations of self-love.”
Smith argues that this impartial spectator, that we each have within us, is what “prompts [us] to sacrifice [our] own interests to the greater interests of others.” The impartial spectator is a realization that we are flawed beings, and that is okay. We can have selfish desires, and it is natural that we judge ourselves based on what others will think. We don’t have to try to be perfect and do the right thing all the time.
But deep down, an impartial spectator will guide us to go to greater heights and inspire us to becoming altruistic beings.
The BCCI will make mistakes. They will try to promote Indian cricket interests like never before. It may seem that they are only helping other cricket boards or donating to charities for a photo-op (or tax breaks), but every now and then, they will end up doing the right thing and sacrifice for the greater good due to the impartial spectator (the inner checks & balances in this case).
Choice 3: Even if it feels that going all in and fighting for individual gain is the right way to go, sometimes an inner voice will force us to do the right thing for everybody.
Nash from CricBlog podcast had an interesting perspective. Although the BCCI is set to receive an absurd 38% from ICC’s pie in the next cycle, that is still a sacrifice given the BCCI provides about 90% of revenue in the first place.
.@NashvSant with his take on the 38% India receives from the ICC's revenue distribution model. Thoughts?
🚨 Listen to full episodes of The CricBlog Podcast 🚨
I will leave you with this final thought from Robert Frost’s acclaimed poem,
“Two roads diverged in a yellow wood,
And sorry I couldn’t travel both…and,
I took the one that’s less traveled by,
And that has made all the difference.”
Which road will Jay Shah, and the BCCI take?
****
My Two Cents
Money is power, and power corrupts, but all that is powerful may not be corrupt.
As outsiders, we always assume the worst in others, especially those in power. But maybe, we ought to give them a chance.
Although Choice 1 seems the most realistic, and Choice 2 the most idealistic, I think Choice 3 is where we will end up being.
Personally, I like Choice 2 the best. I like to see the best in people believe that deep down, we all want to help others without expecting anything in return.
Picture a future where cricketers from other countries do not retire prematurely to take up another job. A future where the Netherlands and Scotland are just as worthy prospects as England are for the annual Euro Cup. A future where the BCCI sets cricket camps funds domestic 4-day tournaments around the world. A future where they use abundant resources to help other sports in a country grow.
Some of this is already happening. Although it happened 3-5 years too late, investing in the Women’s Premier League was the step in the right direction. Other examples including increase support for groundsmen and staff, raising Ranji trophy salaries, and distributing wealth to the Indian Olympians at Paris.
I am proud to announce that the @BCCI will be supporting our incredible athletes representing #India at the 2024 Paris Olympics. We are providing INR 8.5 Crores to the IOA for the campaign.
To our entire contingent, we wish you the very best. Make India proud! Jai Hind! 🇮🇳…
I am pleased to announce prize money of INR 125 Crores for Team India for winning the ICC Men’s T20 World Cup 2024. The team has showcased exceptional talent, determination, and sportsmanship throughout the tournament. Congratulations to all the players, coaches, and support… pic.twitter.com/KINRLSexsD
When the two biggest sporting leagues in the world unite!
BCCI Honorary Secretary, Mr. @JayShah, visited the @NFL headquarters in New York to meet with Commissioner Mr. Roger Goodell and his distinguished team. This introductory meeting focused on sharing… pic.twitter.com/beWeqFEOJi
The unsung heroes of our successful T20 season are the incredible ground staff who worked tirelessly to provide brilliant pitches, even in difficult weather conditions. As a token of our appreciation, the groundsmen and curators at the 10 regular IPL venues will receive INR 25…
Do you know how many undergraduate collegiate varsity cricket teams exist in the United States?
ONE.
You read that right. Haverford College in Pennsylvania is the only American institution that has an official varsity cricket team (more on them later).
As we learned from Avinash’s journey earlier, America has numerous cricket clubs across the country. In addition, there is the National College Cricket Association and the American College Cricket League. However, neither are officially affiliated with USA’s official body to regulate university sport, the National Collegiate Athletic Association (NCAA).
If cricket has any chance of survival and wants to be considered a professional sport in the USA, it has to make an effort to become a part of the NCAA sporting fraternity.
What is the NCAA?
The NCAA is a member-led non-profit organization that regulates university sports in the United States.
In the 1904 American college football season, 18 college athletes died and another 159 were injured.
Something had to be done.
So, President Theodore Roosevelt called upon the major universities to regulate football. Several athletic leaders met, 62 colleges signed the inaugural charter, and the Intercollegiate Athletic Association of the United States (IAAUS) was born, which would later be renamed as the NCAA in 1910.
In 1973, NCAA’s current structure of Division I-III sports was established.
In 2022, Division I NCAA institutions reported a revenue of $17.5 billion, $11.2 billion of which was generated by the athletic departments themselves and $6.3 billion came from government and student fees.
In the same year, Division I institutions also reported spending$17.1 billion. $3 billion of which were spent on student financial aid and $3.3 billion was spent on coach compensation.
Apart from student financial aid and coach compensation, NCAA helps fund sports camps, facilities, medical, recruiting, game travel, etc.
Note: This is only Division I data. More money is spend overall in NCAA sports if we also consider Division II & III.
How NCAA Include a New Sport?
I wanted to learn how a new sport can become a part of the NCAA program.
The Emerging Sports Program for Women is one such program that aims to provide more athletic opportunities for women and can help a new sport achieve NCAA championship status.
The Emerging Sports Program for Women
To learn how cricket can be part of the NCAA, I reached out to the NCAA themselves and asked the following questions:
What is the process for a sport to become NCAA recognized?
What is the timeline like, and is there data available for how long it took each sport to complete the NCAA eligibility (both men’s and women’s)?
Has any organization applied for cricket to become a NCAA sport?
According to the Associate Director of Communications of the NCAA,
“Any sport can be considered” to be a part of the NCAA. However, she had not yet “heard of [cricket’s] application for the emerging sports program.”
After a sporting organization submits the initial application,
“The Committee on Women’s Athletics will review the proposal to determine if it is granted entrance to the Emerging Sports for Women program.”
How Can An Emerging Sport Reach NCAA Championship Status?
At least 20 NCAA active members must sponsor the sport at varsity or club level
These members need to demonstrate at least 5 intercollegiate contests during an academic year
At least 10 letters of commitment are needed from members to sponsor the sport at the varsity level in the year under review
The institution’s chancellor/president, the director of athletics, and senior women administrator must sign the commitment
Supporting materials for the application include:
Budget, Roster size, full-time/part-time coaches, description of facilities, competition opportunities, ‘relationship with sport governing body/organization’
Suggested NCAA regulations (Playing Rules, Financial Aid limits, etc.)
Data (Injury Rates, Health/Safety, Ethnicity/Race, High school participation rates, etc.)
The organization can also submit additional documents from the U.S. Olympic/Paralympic committees, professional sport organizations, etc.
A sport has 10 years from the time it becomes an emerging women’s sport to get to 40 active members, after which it can apply for the NCAA championship status.
What is the Application Process?
A representative of the national governing body must submit an interest form and an official application. Applications open between May 1-August 1 each year, and a sport can apply every two years if is not accepted.
Her final question to me was,
“Have you worked with the governing body for Cricket in the U.S.?
I have not yet worked with the governing body for Cricket in the U.S., but if we are serious about making a collective push for cricket to be included in the NCAA, one of us has to reach out to USA cricket and officially apply for the Emerging Sports program.
Beach volleyball (2015), bowling (2003), water polo (2000), ice hockey (1996), and rowing (1996) have all achieved NCAA championship status recently. Women’s wrestling is on track to become the next one.
Currently, acrobatics & tumbling, equestrian, rugby, stunt, and triathlon are other sports to have become part of the emerging program.
According to an ESPN article, Haverford’s “cricket team also has a unique quirk: It’s the only collegiate varsity team in the country.”
Cricket has a rich history at Haverford College dating back to the 1850s. Kamran Khan, a former Pakistan and USA player, has helped coach the team and increase its popularity in recent decades.
Final Thoughts: Are Things Moving in the Right Direction for USA Cricket?
Apart from USA cricket’s administrative issues, cricket seems to be moving in the right direction in America.
Major League Cricket (MLC) has had a couple of successful season, US co-hosted the 2024 T20 World Cup World Cup, and cricket is now a part of the 2028 Los Angeles Olympics. Support from the Indian diaspora, IPL teams, and Australian partnerships have all proved to be fruitful, and the MLC has largely avoided going the way of previous failed attempts to bring cricket to the US.
The initial impetus has been provided, but it has still not become a part of the general American sporting experience.
Lots of promising players are coming up in the American circuit. However, if financial aid, proper facilities, and incentive to continue playing cricket are not provided, talent may switch to other sports.
Therefore, if cricket has to succeed or even stay remotely relevant in the American market, it has to break through the American college market first.
****
That was my tidbits, what do you think should be done to grow cricket in America? Comment below and share ahead. Thanks for reading!
If you like reading about Cricket in America, you may also like: