So, I went digging through a decade’s worth of Cricket West Indies financial reports.
What I found was surprising: West Indies may have pulled off one of the biggest financial turnarounds in recent cricket history, and no one is talking about it.
Key Takeaways
Cricket West Indies flipped a $20.7 million deficit in 2021 into a $46.2 million surplusby 2024, making a $67 million turnaround in just three years.
Annual revenue in the last 3 years was: $78.6 million (2022), $62.2 million (2023), and $88.3 million (2024). Operating costs ranged from $47-$65 million, while the total comprehensive income came in at: +$20.7, $25.7, and $22.63 million respectively.
India’s tours in 2019, 2022 (along with England), and 2023 played a pivotal role in the recovery, driving media rights revenue of $33 million (2019), $34 million (2022), and $22 million (2023).
The 2024 T20 World Cup generated a regional economic impact of over a $1 billion, while ticketing revenue jumped from $3.5 million in 2023 to $18.5 million in 2024.
Then came 2018, and the books unraveled, when CWI suffered a loss of -$18,563,370, triggered largely by a fall in media rights.
Media rights income fell from $22.5 million in 2017 to just $986,052 in 2018, slashing their total revenue from $42.3 million to $20.9 million, while expenses remained high.
As CWI’s 2018 financial statement explained,
“During 2018, two unpopular tours took place which resulted in the Company incurring a significant lost of $22,198,011...”
That year, West Indies hosted Sri Lanka and Bangladesh, and toured Zimbabwe and New Zealand, series that likely failed to generate commercial traction. To manage cash flow, CWI secured a $5 million bond issue and $5 million mortgage loan from the Sagicor Bank Jamaica Limited to improve cash flow shortfalls.
In 2019, India toured the West Indies for 3 T20Is, 3 ODIs, and 2 Tests, which helped them get back up the feet. Media rights bounced back to $33 million, pushing the total revenue that year to $69 million and bringing the deficit back down to around $3 million.
From Crisis to Recovery: The Years After the Fall
Even though 2019 helped CWI get back to their feet, momentum stalled again during the the COVID-19 pandemic.
By 2021, the board was facing a $21 million deficit. However, three consecutive years of $20 million-plus total comprehensive income has completely flipped the equation, taking CWI from crisis to a mammoth surplus of $46 million.
*Note: During this period, CWI also began publishing consolidated financial statements, which incorporates other subsidiaries. Below is a summary of their surplus of consolidated financials (separate financial statements in parentheses)
2019:-$2,827,090 (-$3,017,035)
2020:-$10,747,720* (-$13,317,466)
2021:-$20,724,375** (-$23,438,047)
2022:-$9,711 (-$2,601,515)
2023:+$25,680,789, (+$12,047,709)
2024:+$46,218,992*** (+$34,904,963)
*Includes +$2.6 million non-controlling interest, **Adjusted in 2022 with a +$408,205 correction, ***Includes -$2.1 million change in non-controlling interest
Revenues, Operating Cost, and Total Comprehensive Income (2020-2024)
Year
Revenues
Operating Cost
Other Gains/Charges*
Total Comprehensive Income
2020
+$23,716,763
-$34,095,315
-$142,078
-$10,520,630
2021
+$27,879,487
-$38,081,453
-$182,893
-$10,384,860
2022
+$78,646,235
-$57,123,254
-$808,317
+$20,714,664
2023
+$62,252,743
-$47,016,811
+10,454,568
+$25,690,500
2024
+$88,354,688
-$65,424,187
-$292,198
+$22,638,203
*Others gains/charges include revalution of land and property, finance costs, net income attributable to non-controlling assets, etc..
Other Notes:
$7 million in bad debt due to T20 World Cup remains to be paid back but is expected to be recovered in the coming years.
In 2024, operating expenses included $28,576,049 in administrative costs and $36,848,238 in tour/tournament costs.
Of the $36.7 million, $4 million was for World Cup event cost, $6.3 million was fees paid to territorial boards, $13 million for player payments, $7 million for airfares and accommodation, and about $6 million in miscellaneous expenses (prize money, umpire cost, meal allowances, selectors’ cost, fitness and conditioning, balls and gears, etc.)
What Drove The Largest Financial Gain between 2022-2024?
Revenue jumped from $27 million to $78 million in 2022, which erased a large portion of their deficit. This was largely due to the India & England tours and numerous sponsorship deals.
“Subsequent to the financial year, the Group has entered two (2) new sponsorship agreements with CG United and IMG Arena, for USD $6 Mil and USD $1.4 Mil, over the next four (4) years 2023-2026…In addition to the annual distribution from ICC of USD $17 Mil, the Group will receive a surplus of USD $9 Mil in April 2024, further strengthening the Group’s cashflow position. Although 2021 was a loss-making year, because of the England and India tours in 2022, the Group has fully recovered these losses, ending the year with Net Income of USD $21 Mil.”
In 2022, media rights brought them about $34 million, ICC distribution and other host fees around $24 million, sponsorship about $8.1 million, and ticket sales around $7.7 million.
India visited WI next year again, which continued to boost their finances. In addition,
“Trade and other receivables increased by $19.8 million compared to 2022. This increase was mainly driven by accrued revenue from various sources such as FanCode, ICC Surplus Distribution for the cycle ending 2023, and ESPN USA.”
How Much did the Revenue Increase in 2024 due to the T20 World Cup?
2023
2024
ICC Distribution, Participation & Host Fees
+$28,964,754
+$46,683,506
Ticketing Revenue
+$3,542,864
+$18,598,560
Media Rights
+$22,192,941
+$14,994,612
Other Revenue*
+$7,552,184
+$8,078,010
Total
+$62,252,743
+$88,354,688
Note: Other Revenue consists of Sponsorship, Rights & Licenses/Merchandise, Release Fees, Development Income, ‘Other Revenue’, and Coolidge Cricket Ground (CCG), where CWI acquired an additional 32% stake (total 92% stake)
2024 World Cup Stats
$120 million invested in stadium upgrades to prepare for the 2024 T20 World Cup
$18.6 million generated in ticketing revenue, compared to $3 million from years before
2000 people involved in planning of the event
$600,000 recorded in merchandise sale
53 million concurrent viewers, 1.3 billion digital view views
16,400 children and 687 schools/academies involved in official Schools Programme
Here are some quotes from Dr. Kishore Shallow, President of Cricket West Indies and CEO of CWI, Chris Dehring on the success of the 2024 T20 World Cup.
“Beyond the boundary, we have taken significant steps to strengthen the foundation of West Indies cricket. The successful execution of the ICC Men’s T20 World Cup in the Caribbean was not just a sporting triumph but an economic milestone, generating over USD 1 billion in economic impact across the six host nations.“
“In addition, we secured a historic commercial partnership with Caribbean CAGE, a game-changing agreement worth over USD 100 million that will provide the financial stability needed to invest in our teams, infrastructure, and grassroots development.”
“After many years of our critical stakeholders calling for a measure of reform, we have also made critical strides in governance, implementing term limits and extending the presidential term to years—key steps in ensuring stability, accountability, and a long-term vision for West Indies cricket…we introduced a more data-driven selection and scouting system…“
“Among these was the unprecedented six-year media rights arrangement with ESPN Carribean,..From a financial perspective, 2024 also marked a landmark year for CWI. Our net income of $ 23 million, driven by the success of the ICC Men’s T20 World Cup, bolstered our financial position. This will help us navigate the next two years, which are expected to be leaner, and which will require continued prudent financial management.Importantly, we also paid off all institutional debt.“
Sources: Here is the CWI webpage with the last 10 years of annual reports. The year ending is September 30 for each year. So the 2024 Annual Report is between the periods of 09/30/2023 and 09/30/2024. The ‘Consolidated Financial Statements’ were used for this analysis.
Results remain below part on the field. They failed to qualify for the 2023 ODI World Cup and 2025 Champions Trophy, ranked 8/9 in both the WTC cycles, and are sitting at #9 in both women’s and men’s ODI rankings.
But off the field, the picture has changed dramatically. With a change in governance and a $67 million financial turnaround, this recovery is one of the quietest yet most significant in recent cricket history.
After weathering the 2018 collapse and the COVID years, CWI now has the financial stability to invest in its future, bolstered by a successful hosting of the 2024 T20 World Cup. With renewed focus on grassroots crickets, the foundations are finally in place.
The question now is whether the performances can catch up.
Thank you for reading. Give us a follow or subscribe to our email list to never miss an article.
If you Enjoy Reading these Financial Cricket Articles, you may also like:
ESPNCricinfo’s Firdose Moonda recently wrote a fascinating article on how Zimbabwe are set to play 11 Tests this year—as many as Australia— despite not being a part of the World Test Championship. Even more surprisingly, they’re hosting eight of them!
The first thought that crossed my mind? “How in the world is Zimbabwe Cricket (ZC) going to afford hosting 8 Tests?”
So, I went looking for answers.
I dug through 268 pages across four annual reports detailing ZC’s finances from 2018/19 to the 2022/23 season, tracing every ounce of revenue, surplus, and ICC payout…so you don’t have to.
Key Takeaways
At the end of 2017, Zimbabwe Cricket was $18.9 million in debt. By 2022, they had cleaned up their finances and reported a surplus of almost $12 million.
ZC remains heavily reliant on direct ICC distributions, which made up 63.5% of their revenue in 2018, rising to 96.6% (2019), 95.9% (2020), before dropping slightly to 90.7% (2021), and 74.5% (2022). Encouragingly, in 2022, they also earned $2.65 million or 16.74% of their revenue from TV rights, diversifying their income streams.
In 2018, ZC spent $445,763 to host Sri Lanka (2 Tests). The Bangladesh series (1 Test, 3 ODIs, 3 T20Is) in 2021 cost them $993,540, and Pakistan’s visit (2 ODIs, 3 T20Is) added an additional $889,340. Hosting regular World Cup qualifiers also costs ZC around $2-3 million every 2 years, although this is typically offset by an equivalent revenue.
England agreeing to pay Zimbabwe a ‘touring fee’ is a step in the right direction. Between 2018-2022, Zimbabwe paid $100,000-$400,000 to participate in overseas tours regardless of the format.
Having played just 12 Tests from 2020-2024, Zimbabwe are scheduled to play 11 in 2025 – the joint-most of any team 😮 pic.twitter.com/uOJdG5x6KC
One paragraph in Moonda’s article particularly caught my eye,
“….and an ICC suspension for government interference in 2019….Since then, they have cleaned up their finances, in particular and made their annual ICC disbursement of US $13.5 million stretch to fund a five-team domestic system, which includes a first-class competition, the national sides, and to host Tests at $500,000 a pop. This bumper year, hosting Tests will cost them about $4 million.”
This lines up with what I found in my earlier piece, “How Much Does It Take to Host A Test?” where we estimated that hosting a single Test can cost anywhere from $350,000-$1.4 million to host a Test depending on factors like the version of DRS used, size of support staff, logistics, etc.
Understanding Test hosting expenses is only one part of the puzzle. To get the full picture, we need to look at Zimbabwe Cricket’s overall financial health — how much revenue they generate, what they spend on operations, and how they have managed to shift from a deep deficit to a growing surplus.
ZC’s Statement of Comprehensive Income Summarized
Let’s dive into Zimbabwe Cricket’s annual revenue, operating costs, and overall financial health.
We can see the step-by-step progress made by the board over the last five years.
At the end of 31 December 2017, ZC had a deficit or total surplus of $-18,900,427. Their surplus at the end of each subsequent year was as follows:
2017:-$18,900,427 (4 Tests)
2018:-$14,182,531 (2 Tests)
2019:+$3,307,548 (0 Tests)
2020:+$1,568,441, after prior period adjustment of -$533,342 (3 Tests)
2021:+1,293,742 (5 Tests)
2022:+$11,979,997 (0 Tests)
Year
Revenues
Operating Cost
Other Gains/Charges*
Total Comprehensive Incomes
2018
+$14,167,700
-$13,502,975
+$4,053,171
+$4,717,896
2019
+$11,905,334
-$7,174,817
+$12,759,562
+$17,490,079
2020
+$5,520,442
-$6,940,391
+$214,183
-$1,205,766
2021
+$9,318,149
-$9,651,008
+$58,160
-$274,699
2022
+$15,829,422
-$12,118,204
+$6,975,037
+$10,686,255
Operating Surplus per year (Revenues – Operating Cost):
2018: +$664,725
2019: +$4,730,517
2020: -$1,419,949
2021: -$332,859
2022:+$3,711,218
*Note: This section is a net sum of (i) ‘Gain realised on conversion of local liabilities’ and (ii) ‘Finance charges’, (iii) share of profit of investments in subsidiaries accounted for using the equity method, and (iv) revaluation surplus on land and buildings.
We have used the 2022 Annual Report for both 2021 and 2022 years since there was $297,939 period correction from 2021, where inventory was erroneously marked as an operating expense.
Now, let’s take a look at how much revenue Zimbabwe receives from the ICC?
Under the previous ICC distribution model (2016-2023), Zimbabwe was allocated $94 million over seven years, which breaks down to roughly $13.42 million per year on average.
Under the new 2024-27 model, Zimbabwe are set to receive about $17.64 million a year.
Here are the contributions from the last four annual reports. The pandemic years definitely seemed to have an impact on the contribution in 2029.
Year
ICC Contribution
Trades & Receivables from ICC
Total from ICC
2018
$9,000,000
$2,969,358 (ICC Loan)
$11,969,358
2019
$11,500,000
$2,062,079
$13,562,079
2020
$5,292,791
$769,292
$6,062,083
2021
$8,459,915
$3,296
$8,463,211
2022
$11,788, 243
$3,239,324
$15,027,567
Note: In addition to ICC loan in 2018, ZCB also took upon Metbank loan and ZAMCO bank loan which totaled their borrowings to $14.4 million.
Operating Costs on Cricket Expenses
Alongside revenue, we also examined how much of Zimbabwe Cricket’s operating costs go toward organizing and administering cricket.
ZC’s investment in the sport has increased post the pandemic-induced break and signals a renewed commitment in growing the sport.
International Cricket Expenses
Year
International Cricket
Domestic Cricket
Central Administration
2018
-$4,840,396
-$1,457,251
-$1,846,502
2019
-$1,074,007
-$1,110,107
-$630,643
2020
–$1,218,449
-$1,332,304
-$434,704
2021
-$3,624,531
-$1,621,988
-$703,003
2022
-$4,604,893
-$3,115,367
-$947,410
Apart from these three areas, human resources and depreciation & impairment make the rest of their total operating costs.
The year-by-year and series-by-series breakdowns are provided below.
— Broken Cricket Dreams Cricket Blog (@cricket_broken) May 20, 2025
Other Interesting Findings
In 2018, ZCB received $571,949 for hosting the WC Qualifiers, $2.5 million for hosting other events, and $694,013 in sponsorship.
The cost of repairs and maintenance of ground equipment over the 5-year period was as follows: $120,739 (2018), $22,397 (2019), $110,413 (2021), $476,287 (2022).
$100,000 was the cost for the kit for their national team in 2018.
Total Sports Marketing in 2021 was $28,045.
In 2021, ZCB’s cricket income was made up of ICC distributions, World Cup Qualifier ($367,190), TV Rights ($435,381), and sponsorship/other income ($55,663).
In 2022, the new National Premier League (NPL) and Zim Afro T10 cost about $254,181.Women and age group tournaments investments also increased from $34,434 in 2021 to $217,073 in 2022.
Since the ICC suspension, Zimbabwe Cricket has been proactive in getting its financial act together. Even though COVID-19 was disastrous for the rest of their operations, during this period, they paid off their old debt, invested in women’s cricket and grassroot cricket, and inaugurated domestic tournaments like the National Premier League (NPL) and Zimbabwe Afro T10.
Here are some quotes from Tavenga Mukuhlani, ZC’s chairman and Givemore Makoni, the managing director in the annual reports over the 4-year period.
2019/20 Annual Report
With the ICC having frozen funding to ZC, our facilities were in disarray, with grass overgrown and the wickets needing a lot of work (Makoni).
“Having ended as badly as it started, the period under review has without any doubt been Zimbabwe Cricket (ZC)’s annus horribilis...At the close of the just-ended financial year, we had whittled the US$27-million legacy debt down to US$1 million, in the process breaking the chains that had enslaved our organisation to an unending cycle of financial troubles (Mukuhlani).
“With our revenues constrained, we seriously considered laying off staff and cutting salaries as so to future-proof the organisation….So, our only alternative was to live within our budget, which is almost entirely funded through distributions from the ICC” (Makoni).
“There was a time we genuinely feared the 2021/22 season was going to be a total disaster….The global pandemic had a huge impact on every element of the men’s and women’s game, putting huge pressure on our finances, as tours and matches were either cancelled or postponed and revenue streams destroyed….From a business perspective, we came up with the Zimbabwe Cricket Strategic Plan 2021-2026, which outlines the strategic visions and goals that we have identified to help the organisation realise its full potential and better [fulfill] its mission (Mukuhlani).
“From a business perspective, this was the first season in which we could begin to put the financial impact of the COVID-19 pandemic behind us, and we did with another clean audit outcome” (Mukuhlani).
“This Annual Report spans what has been one of my most challenging times as Zimbabwe Cricket (ZC) Chairman….Over the past five years, we have made significant strides in women’s cricket, including, for the first time in the history of the game in Zimbabwe, giving national contracts to women players and offering allowances to non-contracted women players” (Makoni).
One day you open up the news, and what do you see?
Zimbabwe will be playing 11 Tests in a single year. They are touring England for the first time in 22 years. A Curran brother has chosen to represent them, Sean Williams & Sikandar Raza are still going, Blessing Muzarabani leads the world in Test wickets this year, and even Brendon Taylor is in talks of making a comeback after serving his ICC ban.
So…did this happen overnight?
Well, it did not. Remember, Rome was not built in a day.
Since the 2019 ICC suspension, COVID-19 crisis, and failing to qualify for World Cups, Zimbabwe Cricket quietly got to work. They focused on cleaning up their finances, restructuring debt, and restoring stability in domestic cricket.
Now, with a bit of surplus in hand and increased ICC funding coming soon, they can finally dream a little bigger.
One Test at a time.
****
Thank you all for reading. Please subscribe here and check out other financial and research articles below.
If you Enjoy Reading these Financial Cricket Articles, you may also like:
Unlike David Miller and Rassie van der Dussen, who remain in the international mix with flexible deals, Klaasen has been completely sidelined, a surprising call with the 2026 T20 World Cup and 2027 ODI World Cup in South Africa on the horizon.
Then again, nothing is ever truly surprising with South African cricket.
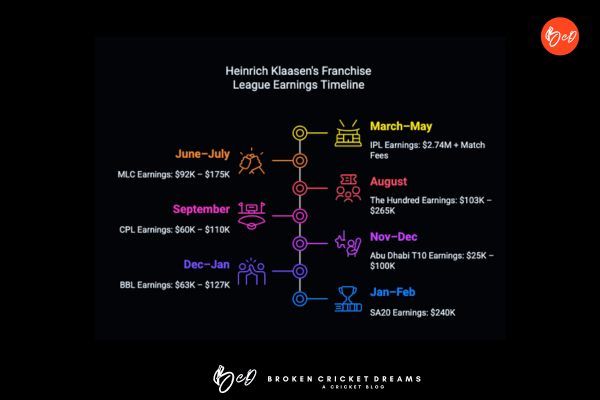
Their loss may be franchise circuit’s gain. So we ask—With his calendar now wide home, just how much more money can Klaasen earn in a year?
In 2024, Klaasen played 4 ODIs and 15 T20Is. At a rate of $1900 per ODI and $911 per T20I, he earned approximately $21,265 in match fees. Having retired from Test cricket in late 2023, Klaasen likely held a mid-level white-ball only contract worth between $145,000-221,000. In total, his annual earnings from Cricket South Africa (CSA) likely ranged from $166,000-$242,000.
Klaasen is currently active in the SA20, IPL, and MLC. Without international duties, his calendar opens up to other leagues like an entire season of The Hundred (already signed), partial stints in the CPL and the BBL, and possibly a shorter league like the Abu Dhabi T10. Altogether, this could earn him an additional $251,600-$602,000 annually— 4% to 263% increase over his former CSA income, effectively replacing or even exceeding his lost national contract.
In total, Heinrich Klaasen’s earnings from franchise salaries alone will be about $3.5 million-$4.17 million.
Here are some new additions and salary changes in various franchise leagues this year.
The BCCI introduced match fees of about $9000 if a player is included in the Playing XII of an IPL match.
If Klaasen features in at least 10 matches, that is extra $90,000. If he plays all 14 league matches, that rises up to $126,000. If they go through the eliminator, qualifier, and the final, he can earn up to $153,000 extra with IPL match fees alone.
Klaasen was a third draft pick in 2023 at £75,000/$96,186. Third draft pick has increased to £78,500 this year.
Note: Not all franchise tournaments reveal the exact signing amount for an overseas signing/retained player, so we provide a range. Klaasen is a highly sought-after T20 player, so his actual salary may be closer to the higher end.
Heinrich Klaasen’s Current Franchise Contracts ($3.27-$3.57 Million)
Note: Klaasen is unlikely to play in the PSL due to scheduling conflict with the IPL (April–May) since he’s been retained by SRH for the next couple of seasons.
Also, Global T20 Canada is in doubt for 2025 and hence has not been considered in this list.
Projected Calendar (2025-2027)
So now, we are ready to build Klaasen’s projected calendar.
Since the ILT20, BPL, and Super Smash collides with his home tournament SA20, he will not be able to accommodate these leagues and will only have space to play the first half of the Big Bash. In addition, since June-September is action packed T20 season, there will probably not be enough time to take part in the T20 Blast.
Since Klaasen won’t be available for the whole BBL season, I reckon his draft price will closer to the Bronze ($100,000 AUD)-Silver ($200,000 AUD) range, which is $63,600-$127,200 USD. Similarly, for the CPL, where he may only be available for the first half, his salary range may be closer to $60,000-$110,000 rather than $130,000-$190,000.
As a fan, I hope the door has not closed on Klaasen’s return to internationals.
Franchise cricket now owns the calendar. The only real gap? October—which fittingly happens to be when the next ODI World Cup is scheduled.
With the 2026 T20 World Cup on the horizon and a home 2027 ODI World Cup, losing a player of Klaasen’s calibre would be a real shame.
At nearly 34, he is prioritizing his future. So are several others. Kane Williamson and Trent Boult have already taken this route. And I’m sure, many more will follow.
One thing is for certain: As franchises compete for top talent, player salaries will keep rising.
International cricket, though? It may already be on its deathbed.
For a Complete List of Franchise Salaries, you can check out the following:
Growing up in the 2000s, it felt like Australia won EVERYTHING in cricket—World Cups, Champions Trophies, the Ashes, Commonwealth, women’s, men’s, U-19—you name it.
Likewise, the USA, China, Russia, Great Britain, Australia, and France dominate the Summer Olympics. Every. Single. Time.
Why do these countries keep winning? And why doesn’t Djibouti rack up more medals? (For the record, Djibouti won a solitary bronze in 1988 Men’s Marathon).
The easy answers? These developed nations have better facilities, grassroots programs, and a robust ‘sporting culture’. But can we quantify this?
By applying Maslow’s Hierarchy of Needs to the economies of the 12 Test-playing cricket nations, 9 FIFA World Cup powerhouses, and six summer Olympic titans, I will create an economic hierarchy for international sports and uncover what it takes for a nation to consistently dominate the global stage. Here are the main questions I’m tackling today:
What is the minimum GDP per capita threshold required for a nation to achieve its first global sporting glory?
How rich must a country win to dominate one team sport?
At what economical threshold does a country go from a one-sport nation to a “sporting culture” like Australia, Russia, China, or the United States?
Let’s begin.
Key Takeaways
To secure its first major team sporting achievement or an Olympic medal, a nation must meet a minimum GDP per capita of $75-$250. Pakistan won an Olympic gold in field hockey in 1960, when their GDP per capita was just $82. Brazil’s GDP per capita was $235.6 in 1960 when they rose in football, India was at $296 in 1983, Sri Lanka – $776.2 (1996), and Afghanistan was at $560.6 when they qualified for the 2010 T20 World Cup.
To become a dominant ‘one-sport’ nation, the GDP per capita must rise to a minimum of $1000-$2500.
West Germany’s GDP increased from $1162.7 in 1960 to $5659.7 in 1974, by which team they had won two World Cups. When Argentina won again in 1986, they had amassed $3436.1 GDP per capita. Brazil reached $3298 by 1994.
Jamaica’s GDP per capita rose from $1632 in 1988 (two Olympic medals) to $5029.8 in 2008 (11 medals).
India’s GDP per capita rose from $544.1 in 2003 to $1021.9 in 2007 before they were able to launch the IPL.
When a nation reaches a minimum of $15,000 GDP per capita, a Global Hunger Index (GHI) < 5, and a poverty rate of less than 2%, they are able to rise to an Olympic and multi-team sport supergiant. China’s current GDP per capita is $13,870. They reduced their GHI from 13.4 in 2000 to <5 by 2016. Australia’s GDP per capita almost double from about $20,000 to $40,000 between 1999-2007, and currently have a GDP per capita of $67,980.
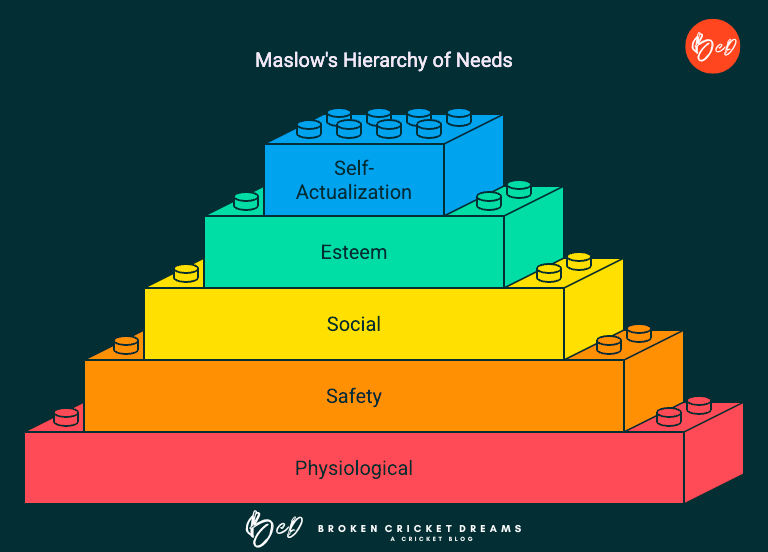
American psychologist, Abraham Maslow, proposed a model that distributed human behavior into five distinct levels:
Physiological Needs: Essentials like food, water, and shelter.
Safety: Security, financial stability, and health.
Love & Belonging: Relationships, intimacy, and connections.
Esteem: Self-respect, status, and recognition.
Self-Actualization: The pursuit of reaching one’s full potential.
The first two represent an individual’s ‘basic needs’, the next two are the ‘psychological needs,’ and the final level focuses on ‘self-fulfillment needs.’
My Theory on the Economics of Sports Dominance
The First Stage: Individual Triumphs
In a nation-state’s early stages, sporting success begins with individual pioneers who overcome socioeconomic hardships and limited infrastructure to achieve greatness. The only prerequisite is that the individual’s physiological needs are met during their physical growth. Think Milkha Singh’s story, rising against odds in post-Partition independent India to reach 4th in the 1960 Rome Olympics in the 400 meters.
The Second Stage: One-Sport Nations
As the nation progresses economically, it has the potential to become ‘one-sport’ nation based on cultural influences and accessible sports (for example, cricket in the British colonies, soccer globally). These teams often include athletes from both affluent and underprivileged backgrounds. Families meet Maslow’s safety needs, which enables the next generation to pursue sports. Think Pele’s Brazil in the 1960s or Sunil Gavaskar/Kapil Dev’s 1983 Indian cricket team).
The Third Stage: Middle Class Expands
Sustained economic growth strengthens the middle class, allowing nations to dominate in one sport and venture into others. By this stage, nations fulfill belonging and esteem needs, earning global respect among the sporting fraternity. Think China at the turn of the 21st century or India in the late 2000s.
The IPL in 2008 would not have been possible without India’s economic liberalization in 1991. Not only did the depth of Indian cricket increase drastically, the pool of business class citizens also increased—individuals who could afford to bet on the idea of the IPL.
This middle class and business growth also allowed India to form leagues like field hockey & Kabaddi and start winning individual Olympic medals in wrestling, badminton, gymnastics, shooting, etc.
The Fourth Stage: Cross-Sport Dominance
This can be a tricky transition phase for several nations due to population or limited resources. Dominating across multiple sports requires major investments across different sports, political will, and hosting global events. Before self-actualization, this can lead to a ‘Sleeping Giant’ phase. This is also the stage where nations typically begin excelling in women’s sports, as increased infrastructure and societal progress open doors for female athletes to thrive.
The All-Blacks from New Zealand may dominate rugby, the Kiwis and White Ferns are always competitive in cricket, and they win 10-20 Olympic medals every cycle, but with a population of 5 million, how much farther can they go?
The Fifth Stage: Self-Actualization
Decades of stability produce generations of affluent citizens, near-zero poverty, and world-class infrastructure. Athletes have the resources and environment to reach their full potential. Think the USA, USSR at the height of the cold war, China currently, Great Britain, Japan, and Australia.
Exceptions to the Rule
These conditions are the bare minimum necessary to be competitive. The reverse is not necessarily true. Economic stability does not guarantee sporting success.
For example, the men’s USA team still struggles to reach the Round of 16 after 40 years of investment, hosting the 1994 FIFA World Cup, and the MLS.
Adequate GDP per capita and strong sports culture does not guarantee success either. Mexico has a GDP per capita of ~ $13,360 and a bustling soccer scene. South Africa has a GDP per capita of $6,500 and a thriving cricket culture. Neither have won World Cups in these sports.
How much wealth it takes to win international sports.
Economic Trends of Various Sporting Teams (1960-Present)
We look at economies of the top countries who have played cricket, soccer, and achieved Olympic greatness.
Note: These countries also overlap with countries who tend to dominate field hockey, basketball, and ice hockey (except Finland). Baseball dominated countries (Cuba, Puerta Rico, Venezuela) golf & Winter Olympics (less accessible, high-end sports) are out of scope for this study.
Which Socioeconomic metrics do we look at and how were they collected?
We consider the following current socioeconomic stats:
GDP (Gross Domestic Product), population,GDP per capita, and if applicable, percentage of population under poverty, and Global Hunger Index (GHI).
GDP per capita can be skewed if there is high income inequality in the country. Hence, we also look at poverty rates and GHI to gauge a better picture of the population set.
Higher GDP and GDP per capita indicate stronger relative economy. Lower poverty rates and GHI levels reflect improved societal well-being.
Poverty rates are presented according to (1) World Bank’s 2017 data, where the extreme poverty line was defined as $2.15/day. Another poverty line, population under poverty (national) is presented if a nation’s self-defined poverty line is above the World Bank rate.
We source the current statistics from the IMF (International Monetary Fund) and the historical GDP per capita levels from the World Bank. The data is available from after 1960, when the World Bank started collecting this data. This coincides with the post-World War II era, when several nations became independent. World Cups were also beginning to take shape during this time.
Other Notes:
If GHI is not mentioned, that means the country is not analyzed by GHI (These are mostly first world countries that do not have hunger issues)
We combine results for Great Britain (Olympics), United Kingdom (GDP data), and England (1966 FIFA World Cup win, multiple cricket World Cup wins) under the same section.
I’ll use soccer instead of football for the rest of the article.
The sporting achievements listed are not an exhaustive list – just significant achievements spaced out to see trends in GDP.
All the sources we looked at are linked at the bottom of the article for your kind perusal.
Top 12 Richest Test Playing Cricketing Countries by GDP Per Capita
We begin by the 12 Test playing nations, ordered by 2025 GDP per capita.
For some countries, we also look at the GDP per capita at different points in their sporting history.
1. Ireland ($107,240)
Multi-sport nation
What was Ireland’s GDP per capita range at their first major sporting event?$2,516.9 (1974 Five Nations Rugby Union Championship, their first in the modern era, 10th since 1910). Their GDP per capita increased to $61,396.4 by the time they upset Pakistan in the 2007 ODI World Cup.
Ireland’s Current Socioeconomic Stats
GDP: $587.23 Billion
Population: 5.48 Million
GDP Per Capita: $107,240
Population Under Poverty (World Bank): 0.06% (2021)
Population Under Poverty (National): 14% (2021)
2024 Paris Olympic (Total Medals): 7
Most Popular Sports in Ireland: Gaelic Football, Rugby, golf, soccer, cricket
2. Australia ($67,980)
Global Sports Superpower
What was Australia’s GDP per capita at their first major sporting event?$8,252.7 (1978 Women’s ODI Cricket World Cup win)
Australia’s Current Socioeconomic Stats
GDP: $1.88 Trillion
Population: 27.67 Million
GDP Per Capita: $67,980
Population Under Poverty: 0.5% (2018)
2024 Paris Olympic (Total Medals): 53
Most Popular Sports in Australia: Australia Rules Football (AFL), Cricket, Rugby, Soccer, Tennis, Swimming
GDP Per Capita At a Glance
Year
GDP Per Capita
Significance
1963
$1967.2
Netball World Cup Win
1973
$4770.8
Women’s Cricket World Cup (CWC) Final
1975
$7003.8
Men’s CWC Final
1978
$8258.7
Women’s CWC Win
1987
$11651.3
Men’s CWC Win
1999
$20712.7
Men’s CWC Win
2007
$41051.6
3rd Consecutive Men’s ODI WC Win
2014
$62544.1
Women’s T20 WC Win
2023
$64820.9
Men’s CWC Win
3. United Kingdom ($54,280)
Global Sports Superpower
What was England’s GDP per capita at their first major sporting event?$1,987.6 (1966 FIFA World Cup)
UK’s Current Socioeconomic Stats
GDP: $3.73 Trillion
Population: 68.72 Million
GDP Per Capita: $54,280
Population Under Poverty: 0.2% (2021)
Great Britain 2024 Paris Olympic (Total Medals): 65
Most Popular Sports in the UK: Soccer, Cricket, Rugby, Tennis, Golf
GDP Per Capita At a Glance
Year
GDP Per Capita
Significance
1966
$1987.6
FIFA World Cup Win
1973
$3426.3
Women’s CWC Win
1979
$7804.8
Men’s CWC Final
1987
$13118.6
Men’s CWC Final
1992
$20487.2
Men’s CWC Final
2010
$39599
Men’s T20 WC Win
2019
$42662.5
Men’s ODI WC Win
4. New Zealand ($48,230)
Multi-sport nation
What was New Zealand’s GDP per capita at their first major sporting event? $12,330.9 (1987 Rugby World Cup)
NZ’s Current Socioeconomic Stats
GDP: $262.92 Billion
Population: 5.45 Million
GDP Per Capita: $48,230
Population Under Poverty:
2024 Paris Olympic (Total Medals): 20
Most Popular Sports in NZ: Rugby, Cricket, Netball, Soccer, Basketball
People tend to ask how New Zealand always ‘punches’ above their weights and make it to cricket World Cup semi-finals despite a population of 5.45 million?
Because they have the fourth highest GDP per capita and have most of the population above the poverty/GHI line, so individuals can focus on other worldly needs like sports.
GDP Per Capita At a Glance
Year
GDP Per Capita
Significance
1967
$2208.4
Netball WC Win
1987
$12330.9
RugbyWC Win
2000
$13641.1
Women’s CWC Win
2021
$49624.2
World Test Championship Win
5. West Indies ($19,823)
Multi-sport nation
West Indies teams from the 1975-1983 ODI World Cups, 2004 Champions Trophy, and 2012 & 2016 T20 World Cups included players from Guyana, Barbados, Jamaica, Trinidad & Tobago, and Saint Lucia
What was West Indies nations’ GDP per capita at their first major sporting event? (1975 World Cup)
What was Sri Lanka’s GDP per capita at their first major sporting event? $776.2 (Won the 1996 ODI World Cup)
SL’s Current Socioeconomic Stats
GDP: $74.59 Billion
Population: 22.4 Million
GDP Per Capita: $3,330
Population Under Poverty (World Bank): 0.96% (2019)
Population Under Poverty (National): 14.30% (2019)
Global Hunger Index: 11.3 (2024), 21.7 (2000)
2024 Paris Olympic (Total Medals): 0
Most Popular Sports in South Africa: Cricket, Volleyball, Athletics
GDP Per Capita At a Glance
Year
GDP Per Capita
Significance
1975
$279.8
Invited to CWC
1979
$230.8
Qualified for CWC
1996
$776.2
Won CWC
2007
$1578.6
ODI WC Runners-up
2014
$3971.9
T20 WC Win
8. India ($2,940)
One-Sport Dominant Nation, In-Transit to Become Multi-Sport Nation
What was Afghanistan’s GDP per capita at their first major sporting event?$296 (1983 ODI Cricket World Cup win)
India’s Current Socioeconomic Stats
GDP: $4.27 Trillion
Population: 1.45 Billion
GDP Per Capita: $2,940
Population Under Poverty (World Bank): 12.92 % (2021)
Global Hunger Index: 27.3 (2024), 38.4 (2000)
2024 Paris Olympic (Total Medals): 6
Most Popular Sports in India: Cricket, Field Hockey, Badminton, Kabaddi, Wrestling
GDP Per Capita At a Glance
Year
GDP Per Capita
Significance
1975
$161.1
Field Hockey WC Win
1983
$296
CWC Win
2003
$544.1
CWC Runners-Up
2007
$1021.9
T20 WC Win
2011
$1445.5
ODI WC Win
2024
$2700
T20 WC Win
(current USD $)
1983: $296
2003: $544.1
2007: $1021.9
2011: $1445.5
2013: $1432.8
2023: $2480.8
9. Bangladesh ($2,770)
One-Sport Dominant Nation
What was Bangladesh’s GDP per capita at their first major sporting event? $397.3 (Won the 1997 ICC Trophy and qualified for the 1999 ODI Cricket World Cup)
Bangladesh’s Current Socioeconomic Stats
GDP: $481.86 Billion
Population: 173.74 Million
GDP Per Capita: $2,770
Population Under Poverty (World Bank): 5.01% (2022)
Population Under Poverty (National): 18.7% (2022)
Global Hunger Index: 19.4 (2024), 33.8 (2000)
2024 Paris Olympic (Total Medals): 0
Most Popular Sports in Bangladesh: Cricket, Soccer, Kabaddi, Badminton
GDP Per Capita At a Glance
Year
GDP Per Capita
Significance
1997
$379.3
ICC Trophy Win
1999
$388
Qualified for CWC
2015
$1224.4
ODI WC Quarterfinals
10. Zimbabwe ($2,130)
One-Sport Dominant Nation
What was Zimbabwe’s GDP per capita at their first major sporting event? $716.8 (1975 Cricket World Cup – Had Kapil Dev not scored that 175*, we may be playing the ZPL)
Zimbabwe’s Current Socioeconomic Stats
GDP: $36.93 Billion
Population: 17.36 Million
GDP Per Capita: $2,130
Population Under Poverty (World Bank): 39.75% (2019)
Population Under Poverty (National): 38.30% (2019)
Global Hunger Index: 27.6 (2024), 35.3 (2000)
2024 Paris Olympic (Total Medals): 0
Most Popular Sports in Zimbabwe: Cricket, Soccer, Rugby, Athletics
GDP Per Capita At a Glance
Year
GDP Per Capita
Significance
1982
$1095.3
ICC Trophy Win, Qualified for 1983 WC
1995
$648
Hosted All-Africa Games
1999
$582
Best WC Show, 5 Wins
11. Pakistan ($1,590)
One-Sport Dominant Nation
What was Pakistan’s GDP per capita at their first major sporting event? $395.7 (1992 ODI Cricket World Cup Win)
Pakistan’s Current Socioeconomic Stats
GDP: $374.6 Billion
Population: 240.54 Million
GDP Per Capita: $1,590
Population Under Poverty (World Bank): 4.93% (2018)
Population Under Poverty (National): 21.9% (2018)
Global Hunger Index: 27.9 (2024), 36.6 (2000)
2024 Paris Olympic (Total Medals): 1
Most Popular Sports in Pakistan: Cricket, Field Hockey, Squash, Badminton
GDP Per Capita At a Glance
Year
GDP Per Capita
Significance
1960
$82
Field Hockey Olympic Gold
1979
$249.2
First CWC Semi-Finals
1992
$395.7
WC Win
1999
$418.2
WC Runners-Up
2009
$963.8
T20 WC Win
2017
$1519.2
Champions Trophy Win
2022
$1538.3
T20 WC Runners-up
12. Afghanistan ($410.93)
One-Sport Dominant Nation
What was Afghanistan’s GDP per capita at their first major sporting event?$560.6 (2010 – ICC Intercontinental Cup, ICC World T20 Qualifier Winners, qualify for 2010 T20 World Cup)
Afghanistan Current Socioeconomic Stats
GDP: $17.33 billion
Population: 42.17 Million
GDP Per Capita: $410.93
Population Under Poverty (World Bank): 34.9% (2023)
Population Under Poverty (National): 54.9% (2023)
Global Hunger Index: 30.8 (2024), 49.6 (2000)
2024 Paris Olympic (Total Medals): 0
Afghanistan’s Most Popular Sports: Cricket, Buzkashi
Since 1960, only the following countries have won the FIFA World Cup: Brazil, England, (West) Germany, Argentina, Italy, France, and Spain (Uruguay, Hungary, and Czechoslovakia are not considered here).
We will also explore Croatia, Portugal, and the Netherlands, who have been competitive.
1. Netherlands ($70,610)
Multi-Sport Nation
What was Netherland’s GDP per capita at their first major sporting event? $6,454.5 (1974 Finalists)
Current Socioeconomic Stats
GDP: $1.27 Billion
Population: 18.03 Million
GDP Per Capita: $70,610
Population Under Poverty (WB): 0.07% (2021)
Population Under Poverty (National): 14.5% (2021)
2024 Paris Olympic (Total Medals): 34
Most Popular Sports in Netherlands: Soccer, Cycling, Field Hockey
GDP Per Capita At a Glance
Year
GDP Per Capita
Significance
1974
$6450.5
FIFA World Cup (WC) Runners-up
1978
$11195.8
WC Runners-Up
2010
$51305.7
WC Runners-Up
2014
$53457.2
3rd Place
2. Germany ($57,910)
Global Sports Superpower
What was Germany’s GDP per capita at their first major sporting event? $1,162.1 (1960 – West Germany won the 1954 FIFA WC), $5,659.7 (1974)
Current Socioeconomic Stats
GDP: 4.92 Trillion
Population: 84.98 Million
GDP Per Capita: $57,910
Population Under Poverty (World Bank): 0.24% (2020)
Population Under Poverty (National): 16% (2020)
2024 Paris Olympic (Total Medals): 33
Most Popular Sports in Germany: Soccer, Tennis, Basketball, Handball
GDP Per Capita At a Glance
Year
GDP Per Capita
Significance
1966
$1870.8
FIFA WC Runners-Up
1974
$5659.7
WC Winners
1990
$22385.7
WC Winners
2003
$30711.1
Women’s FIFA WC Win
2008
$46386.3
Men’s Field Hockey Gold
2014
$48971.1
WC Winners
3. France ($49,530)
Global Sports Superpower
What was France’s GDP per capita at their first major sporting event? $9,311.9 (1984 Euro)
Current Socioeconomic Stats
GDP: $3.28 Trillion
Population: 66.3 Million
GDP Per Capita: $49,530
Population Under Poverty (World Bank): 0.06% (2021)
Population Under Poverty (National): 15.60% (2021)
2024 Paris Olympic (Total Medals): 64
Most Popular Sports in France: Soccer, Tennis, Rugby, Handball, Basketball
GDP Per Capita At a Glance
Year
GDP Per Capita
Significance
1986
$13430.5
FIFA WC 3rd Place
1995
$26791.8
Men’s Handball WC Win
1998
$24869.4
FIFA WC Win
2006
$36431.6
WC Runners-Up
2018
$41418.2
WC Winners
4. Italy ($41,710)
Multi-sports Nation
What was Italy’s GDP per capita at their first major sporting event? $1,718.5 (1968 UEFA Euro)
Current Socioeconomic Stats
GDP: $2.46 Trillion
Population: 58.96 Million
GDP Per Capita: $41,710
Population Under Poverty (World Bank): 0.81% (2021)
Population Under Poverty (National): 20.10% (2021)
2024 Paris Olympic (Total Medals): 40
Most Popular Sports in Italy: Soccer, Cycling, Tennis, Basketball, Volleyball, Formula 1
GDP Per Capita At a Glance
Year
GDP Per Capita
Significance
1970
$2111.7
FIFA WC Runners-up
1982
$7573.9
WC Win
1994
$19382.2
WC Runners-Up
2006
$33684.7
WC Win
2020
$32091.5
Euro Winners
5. Spain ($37,360)
Multi-sports Nation
What was Spain’s GDP per capita at their first major sporting event? $695 (1984 Euro)
Current Socioeconomic Stats
GDP: 1.83 Trillion
Population: 48.92 Million
GDP Per Capita: $37,360
Population Under Poverty (WB): 0.56%
Population Under Poverty (National): 20.4%
2024 Paris Olympic (Total Medals): 18
Most Popular Sports in Spain: Soccer, Basketball, Tennis, Cycling, Water Sports
GDP Per Capita At a Glance
Year
GDP Per Capita
Significance
1964
$695
Euro Win
1982
$5156
Hosted the FIFA WC
2005
$26451
Men’s Handball WC Win
2008
$35603.2
Euro Win
2010
$30658.7
WC Win
6. Portugal ($30,950)
One-Sport Dominant Nation
What was Portugal’s GDP per capita at their first major sporting event? $18,064.2 (2004 Euro Finalists)
Current Socioeconomic Stats
GDP: $319.93
Population: 10.34 Million
GDP Per Capita: $30,950
Population Under Poverty (WB): 0.23% (2021)
Population Under Poverty (National): 16.40% (2021)
2024 Paris Olympic (Total Medals): 4
Most Popular Sports in Portugal: Soccer, Futsal, Cycling
GDP Per Capita At a Glance
Year
GDP Per Capita
Significance
1966
$601.3
FIFA WC 3rd Place
2000
$11526.4
Futsal WC 3rd Place
2006
$19839.5
WC 4th Place
2016
$19980.3
Euro Win
7. Croatia ($25,080)
One-Sport Dominant Nation
What was Croatia’s GDP per capita at their first major sporting event? $5,712.6 (1998 FIFA WC Semi-Finals)
Current Socioeconomic Stats
GDP: $96.03 Billion
Population: 3.83 Million
GDP Per Capita: $25,080
Population Under Poverty (WB): 0.31% (2021)
Population Under Poverty (National): 18% (2021)
Global Hunger Index: < 5 (2024), 5.5 (2000)
2024 Paris Olympic (Total Medals): 7
Most Popular Sports in Croatia: Soccer, Basketball, Handball, Water Polo
Year
GDP Per Capita
Significance
1998
$5712.6
FIFA WC 3rd Place
2018
$15460.4
WC Runners-Up
2022
$18466.1
WC 3rd Place
8. Argentina ($12,050)
One-Sport Dominant Nation
What was Argentina’s GDP per capita at their first major sporting event? $3282.1
Current Socioeconomic Stats
GDP: $574.2 Billion
Population: 47.64 Million
GDP Per Capita: $12,050
Population Under Poverty (World Bank): 0.61% (2022)
Population Under Poverty (National): 39.20% (2022)
Global Hunger Index: 6.6 (2024), 6.6 (2000)
2024 Paris Olympic (Total Medals): 3
Most Popular Sports in Argentina: Soccer, Polo, Field Hockey
GDP Per Capita At a Glance
Year
GDP Per Capita
Significance
1978
$3282.1
FIFA WC Win
1986
$3436.1
WC Win
2014
$12233.1
WC Runners-Up
2022
$13935.7
WC Win
9. Brazil ($10,820)
One-Sport Dominant Nation. In-Transit to Become a Multi-Sports Nation
What was Brazil’s GDP per capita at their first major sporting event? $235.3 (1958 & 1962 FIFA World Cups)
Current Socioeconomic Stats
GDP: $2.31 Trillion
Population: 213.32 Million
GDP Per Capita: $10,820
Population Under Poverty: 3.5% (2022)
Global Hunger Index: 6.6 (2024), 11.7 (2020)
2024 Paris Olympic (Total Medals): 20
Most Popular Sports in Brazil: Soccer, Volleyball, Basketball, Martial Arts, Futsal
The combined Summer/Winter Olympics tally leaderboard are as follows: United States (3095 medals), Soviet Union (1204), Great Britain (1014), France (961), Germany (960), China (804), Italy (799), Sweden (690), Australia (619), Japan (618), Canada (578), Norway (576), Russia (542), Hungary (540), etc. These countries also happen to be the most developed countries.
On the other end of the spectrum, the following countries only have 1 Olympic medal: Guyana, Iraq, Senegal, Barbados, Paraguay, Sudan, Virgin Islands, Netherlands Antilles, Gabon, Togo, Burkina Faso, Mauritius, Samoa, Tonga, Djibouti, Cape Verde, Dominica, Turkmenistan, Eritrea, Montenegro. You get the point.
Burkina Faso would send its first Olympian in the 1972 Munich Olympics, when its GDP per capita was $99.6. In 1988, they sent 6 athletes ($301.1). When Djibouti won its bronze in 1988, it had a GDP per capita of $878.9.
1. USA ($89,680)
Global Sports Superpower
Current Socioeconomic Stats
GDP: $30.3 Trillion
Population: $338.29 Milllion
GDP Per Capita: $89,680
Population Under Poverty: 1.25% (2022)
2024 Paris Olympic (Total Medals): 126
Most Popular Sports in USA: American Football, Basketball, Baseball, Ice Hockey, Golf, Track and Fields, Tennis, Soccer
GDP Per Capita At a Glance
Year
GDP Per Capita
Significance
1960
$2999.9
71 Olympic Medals
1984
$17121.2
174 Medals
1991
$24342.3
Women’s WC Win
2002
$37997.7
Men’s WC Reaches its first Quarter Finals
2019
$65604.7
Women’s 4th WC Win
2. China ($13,870)
Global Sports Superpower
Current Socioeconomic Stats
GDP: $19.53 Trillion
Population: 1.41 Billion
GDP Per Capita: $13,870
Population Under Poverty: 0% (2021)
Global Hunger Index: < 5 (2024), 13.4 (2000)
China’s Global Hunger Index Trends
Year
GHI
Olympic Medals
2000
13.4
58
2008
7.2
100
2016
< 5
70
2024
< 5
91
2024 Paris Olympic (Total Medals): 91
Most Popular Sports in China: Table Tennis, Badminton, Swimming, Martial Arts, Basketball
GDP Per Capita At a Glance
Year
GDP Per Capita
Significance
1984
$250.7
32 Olympic Medals
2000
$959.4
58 Medals
2008
$3468.3
100 Medals, Hosted Olympics
2022
$10408.7
15 Medals at Winter Olympics (China’s Best Show)
3. Japan ($35,610)
Global Sports Superpower
Current Socioeconomic Stats
GDP: $4.39 Trillion
Population: 123.26 Million
GDP Per Capita: $35,610
Population Under Poverty: 0.73% (2013)
2024 Paris Olympic (Total Medals): 45
Most Popular Sports in Japan: Baseball, Sumo Wrestling, Soccer, Martial Arts
GDP Per Capita At a Glance
Year
GDP Per Capita
Significance
1960
$508.7
18 Medals
1982
$9780
Baseball World Cup Runners-up
2006
$35991.5
World Baseball Classic Win
2011
$48760.1
Women’s WC Win
2020
$40040.8
58 Medals, Hosted Olympics
4. Republic of Korea ($37,670)
Global Sports Superpower
*South Korea
Current Socioeconomic Stats
GDP: $1.95 Trillion
Population: 51.68 Million
GDP Per Capita: $37,670
Population Under Poverty: 0% (2021)
2024 Paris Olympic (Total Medals): 32
Most Popular Sports in South Korea: Soccer, Baseball, Archery, Golf, Taekwondo
GDP Per Capita At a Glance
Year
GDP Per Capita
Significance
1982
$1992.5
Baseball World Cup Win
1988
$4748.6
Hosted Olympics, 33 Medals
2002
$13165.1
FIFA WC 4th Place
2005
$19402.5
Baseball WC Runners-up
5. Canada ($55,890)
Global Sports Superpower
Current Socioeconomic Stats
GDP: $2.33 Trillion
Population: 41.7 Million
GDP Per Capita: $55,890
Population Under Poverty: 0.25% (2019)
2024 Paris Olympic (Total Medals): 27
Most Popular Sports in Canada: Ice Hockey, Lacrosse, Soccer, Basketball, Baseball, Athletics
GDP Per Capita At a Glance
Year
GDP Per Capita
Significance
1976
$8838.9
Hosted Summer Olympics, 11 Medals
1984
$13930.5
44 Medals, Canada’s Best Show
2002
$24256
Ice Hockey Olympic Gold
2010
$47560.7
Hosted Winter Olympic Medal, 26 Medals
2015
$43594.2
Hosted Women’s FIFA WC
6. Russia/USSR ($15,080)
Global Sports Superpower
Current Socioeconomic Stats
GDP: $2.2 Trillion
Population: 145.63 Million
GDP Per Capita: $15,080
Population Under Poverty (WB): 0.18% (2021)
Population Under Poverty (National): 12.10% (2010)
2020 Tokyo Olympic as ROC (Total Medals): 71
Most Popular Sports in Russia: Soccer, Ice Hockey, Gymnastics, Figure Skating
GDP Per Capita At a Glance
Year
GDP Per Capita
Significance
1990 (USSR)
~$9200
USSR Dissolves
1996 (Russia)
$2643.9
Russia Re-enters the Olympics, 89 Medals
2016
$8663.2
56 Medals
Final Thoughts and Future Work
In the future, it would be interesting to analyze countries that dominate less accessible sports like golf or sports in the Winter Olympics. Also nations like Sweden, Norway, Belgium, Uruguay, Czech Republic, Hungary, and Mexico were out of scope for this study, but would be interesting to look at in the future.
Another way to go is to look at the understood how America’s economy is able to support multiple flourishing sports league (NFL, College Football, College Basketball (Men’s/Women’s), NBA, MLS, etc.)
Also, why aren’t Ireland better at cricket? I was surprised to see that they are financially a lot more stable than other nations. The next step would be to look at social policies and government investments to study how countries can start winning consistently at an international stage after they have satisfied the bare minimum economic conditions.
In any case, thank you all for reading. Appreciate y’all! Comment below on what you think!
And please, share, subscribe to our social media channels (X, Facebook) and other platforms (Substack, Medium)
375 articles and four and a half years later, we are going back to our roots. Thanks to diplomat and cricket enthusiast—Michael Appleton to get me inspired and thinking on these lines again from this tweet:
To every 🏴 🇦🇺 🇮🇳 fan/journalist/former/current player complaining about the format of the WTC: I have a deal for you!
If you’re prepared to give up the five-match Test series that your three countries play, I can design a WTC in which everyone plays everyone the same amount!
That original article explored how to reduce the imbalance of the Big 3 (India, England, Australia) in WTC scheduling, but still keep the ‘marquee’ series like The Ashes or Border-Gavaskar Trophy. However, it was a bit too unrealistic.
Later, I would research how much money it takes to host a Test match and realized that finances are the root of almost all problems in the world of cricket. In all sense of the phrase—It’s the economy, stupid.
Today, I will try to put all of these ideas together and form a combined thesis towards a World Test Championship (WTC) system that (1) can realistically work in today’s world, (2) is financially viable, (3) includes equidistribution of Tests for every team, (4) implements two Test windows, and (5) come up with a realistic value for a Test match fund.
Part I: Solving the Equal Matches Per Team Problem
One of the major issues in the current iteration of the WTC is the imbalance of the number of Tests each team plays. This is due to the influence of the Big 3 as well as the high cost to host a Test.
Current World Test Championship Table
Here are the number of matches each team will play in the 2023-25 WTC cycle:
22 – England
19 – India, Australia
14 – New Zealand, Pakistan
13 – Sri Lanka, West Indies
12 – South Africa, Bangladesh
We can see that the Big 3 play 5-10 Tests more than each nation. This is mainly due to the ‘marquee’ series like Ashes (Aus-Eng), BGT (Aus-Ind), and Ind-Eng.
How can we keep the drama of the marquee series alive but ensure an equal footing for each team?
Solution: Sweet 17—One Match Sacrifice Required by The Big 3
To resolve this issue, we will introduce the two-tiered relegation promotion system.
Each tier will consist of six teams including Zimbabwe, Ireland, and Afghanistan (I mean, why give out Test status when you’re not going to have Afghanistan and Ireland play on a regular basis). We will show this by example with the current Top 6 rankings in the current WTC table.
Tier 1: India, Australia, England, South Africa, New Zealand, Sri Lanka
Tier 2: Pakistan, West Indies, Bangladesh, Ireland, Zimbabwe, Afghanistan
The Constraints
Once we had this framework, the next question was what is the ideal number of matches each team in Tier 1 can play so that (1) there are no two-Test series, (2) each of the six teams plays each other once, (3) there is an equal amount of home and away matches, (4) India-Australia-England get to keep their ‘marquee’ series, and (5) most importantly, each team plays the same number of games.
I treated this challenge as a Sudoku puzzle. And boy was this a tough challenge! (Photos of my scribbling with my earlier attempts are at the bottom of the article for your kind perusal).
20-matches? Too many. 16 matches? Not enough to satisfy all the constraints.
17? Ahh, there’s the goldilocks zone!
Here is the solution I came up with:
Each team plays two 4-Test series and three 3-Test series, for a total of 17 matches each.
The 17 Tests are going to be divided in 7-home, 7-away, and 3-neutral Tests, where each of the Big 3 get to host one neutral series.
The 7-home and 7-away matches will consist of exactly one 4-Test series and one 3-Test series.
Altogether, Tier 1 will consist of exactly 50 Tests.
Top 2 teams will compete in a 3-Test final series at a neutral venue (taking the total to 53 Tests).
The crux? India-Australia and the Ashes have to sacrifice the 5-Test series. I tried adding a 5-4-3 solution (one 5-match series, one 4-match, and one three match series, but it would require NZ-SL to play 5 Tests or the Ashes to be reduced to 3 Tests).
Two 4-match series worked out just right for everybody.
Tier 1 WTC Schedule Breakdown
IND
AUS
ENG
SA
NZ
SL
IND
X
4
4
3
3
3
AUS
4
X
4
3
3
3
ENG
4
4
X
3
3
3
SA
3
3
3
X
4
4
NZ
3
3
3
4
X
4
SL
3
3
3
4
4
X
Total
17
17
17
17
17
17
Legend
Home, Away
Neutral
Ind vs SL in Australia
Aus vs NZ in England
Eng vs SA in India
You can interpret the above table as follows: India hosts England (4 Tests) & New Zealand (3), play away tours to Australia (4 Tests) & South Africa (3), and finally play a 3-Test neutral series against Sri Lanka.
Tier 2 WTC Schedule Breakdown
Each team plays two 3-Test series and three 2-Test series, for a total of 12 matches each.
For this example, since Pakistan is in this tier, the UAE will be chosen as the neutral venue for all neutral matches.
Tier 2 will consist of exactly 36 Tests.
Top 2 teams will compete in a 3-Test final series at a neutral venue (taking the total to 39 Tests).
PAK
WI
BAN
ZIM
IRE
AFG
PAK
X
3
3
2
2
2
WI
3
X
3
2
2
2
BAN
3
3
X
2
2
2
ZIM
2
2
2
X
3
3
IRE
2
2
2
3
X
3
AFG
2
2
2
3
3
X
Total
12
12
12
12
12
12
Home, Away
Neutral
Pak vs Afg in UAE
WI vs Ire in UAE
Ban vs Zim in UAE
At the end of the WTC cycle, the bottom two teams from Tier 1 will be relegated to Tier 2, while both finalists from Tier 2 will be promoted to Tier 1.
Is it Too Much Test Cricket?
No.
Including the final series for both tiers, there will be a total of 92 Test matches in two years.
The first three iterations of the WTC had 61, 70, and 70 matches respectively. 92 here includes 12 Tests each for Zimbabwe, Afghanistan, Ireland and the two final series, which is pretty balanced overall.
The compromise for equal games for each team is that the Big 3 will play 3-5 Tests less than the usual, while the mid-tier teams will play 3-5 more Tests than usual.
In this model, we are asking South Africa, Sri Lanka, and New Zealand to host one 4-Test series in a two-year cycle, but do they have the money? Probably not (and that is why we are also having the neutral Tests hosted in India, England, Australia, or the UAE—countries that can afford it).
We had estimated last year that it takes a mammoth $350,000-$1.4 million to host a Test match and studied why teams like NZ & SA lose money while hosting a Test.
On the other of the spectrum, a series like Ashes can incur costs anywhere from $3-7 million. The cost depends on various factors such as technology, review system, support personnel, hotels, travel, security, etc. One quick example is Australian broadcasting using an 80-camera system for the BGT 2024-25 series.
Higher quality, but comes with higher costs.
Cost Estimation: So, How Much Money is Needed to Sustain a Fair WTC?
To estimate the cost of hosting the WTC, we will first presume that the Tests hosted by Big 3 as well as the two final series (3 Tests each) will be on the higher end of the hosting costs.
India, England, and Australia will each host 8 Teams (7 home + 1 neutral) for a total of 24 matches. The 6 Tests for the two final series will make it about 30 high-quality expensive Tests and 62 Tests on the lower end.
The 62 Tests will cost anywhere from $21.7 million-$86.8 million, while the 30 Tests will take about $70-210 million. Overall, a 92-Test WTC will cost somewhere between $91.7-296.8 million.
Where Will Get the Money From?
The ICC recently mentioned a possible $15 million Test match fund in the form of $10,000 minimum Test fee as well as a ‘touring fee’. That is a step in the right direction, but more targeted funding is needed.
In our WTC model, we are asking SA, SL, and NZ to host about 4 Tests more than they usually do and Afg, Zim, and Ireland to host 5 Tests each more than they usually do. That is about 27 extra Tests, which totals to $9.45 million-$37.8 million.
The ICC had a total surplus of $912 million as of December 2022 and have an estimated $200-$325 million profits in each of the last couple of years. Subsidizing the World Test Championship (WTC) with about 5-15% of their annual profits could solve the money problem.
If $17.5 million can be used to fund seven cricketers in a tournament that lasts less than 60 days, then surely $17.5 million could be found from somewhere (ICC + IPL + BCCI + sponsors) to fund six countries and Test cricket so it exists for the next 60 years.
The money in cricket exists. Just needs to be redistributed properly so that all interested parties are happy.
Note, from the current rankings, Tier 1 countries would include Australia, South Africa, and New Zealand. All of these 3 countries are located in the southern hemisphere and hence, will host all their home Tests in the November-January window, including the coveted Boxing Day Test.
West Indies, England, and Ireland will host both their home test series between the June-August window.
Meanwhile, subcontinental nations (India, Pakistan, Bangladesh, UAE) can be more flexible and host one home series in each window.
Solution: Two 2-Hemisphere Test Match Windows
Here is how a potential two year cycle could look with the two separate windows without overcrowding the international calendar. We try to schedule Test cricket during peak summer times in each hemisphere to gain the most attention.
Test Match Window 1 Matches (November – January)
Tier 1
India in Australia (4 Tests), South Africa in Australia (3 Tests), India vs Sri Lanka in Australia (3 Tests)
Sri Lanka in South Africa (4 Tests), India in South Africa (3 Tests)
South Africa in New Zealand (4 Tests), England in New Zealand (3 Tests)
England in India (4 Tests), England vs South Africa in India (3 Tests)
Australia in Sri Lanka (3 Tests)
Tier 2
Bangladesh in Pakistan (3 Tests)
Afghanistan in Zimbabwe (3 Tests), Pakistan in Zimbabwe (2 Tests)
West Indies in Bangladesh (3 Tests)
Ireland in Afghanistan* (3 Tests)
West Indies vs Ireland in UAE (2 Tests), Bangladesh vs Zimbabwe in UAE (2 Tests)
Test Match Window 2 Matches (June – August)
Tier 1
Australia in England (4 Tests), Sri Lanka in England (3 Tests), Australia vs New Zealand in England (3 Tests)
New Zealand in India (3 Tests)
New Zealand in Sri Lanka (4 Tests)
Tier 2
Zimbabwe in Ireland (3 Tests), Bangladesh in Ireland (2 Tests)
Pakistan in West Indies (3 Tests), Zimbabwe in West Indies (2 Tests)
Bonus: Will West Indies Never Play India or Australia Again in this Model?
I know what you might be thinking.
If India, Australia, or England never relegate and West Indies never get promoted…are the days of the mighty West Indies versus the Australians and Indians over? 60 years of legacy down the drain?
Not quite. We have an addendum for this scenario as well.
One Optional Friendly Series Between the Two Tiers
If both teams agree (and there is space in the international calendar), an optional 1 to 3-match friendly Test series can be played between a country of the first and second tier. In our example, we may have:
India vs Afghanistan
Australia vs Zimbabwe (This is never going to happen, is it?)
Australia vs Pakistan
England vs Ireland
South Africa vs Zimbabwe
New Zealand vs West Indies
Sri Lanka vs Bangladesh
This can serve as (1) a practice tour (India playing Zimbabwe on way to their South Africa series), (2) a promotional event (India-Pakistan one-off Test in UAE), or (3) an actual friendly series to encourage lower-ranked countries to stay serious about Test cricket.
Final Thoughts
Is it the perfect plan?
No. In fact, there is never such a thing as a ‘perfect plan.’
But we can continue to strive for a more perfect system, can’t we?
At least it is good to see that World Test Championship (WTC) is taking flight. 4 years ago, not many took this as a serious competition or offered solutions. Now there is plenty of debate, which is good to see.
In 2020, I was quixotic with my outlook on cricket. Thought anything was possible.
In 2021, I was hopeless, doubting the system at every stage.
By the time we reached 2024, I became practical. And as we approach 2025, I have become a little more realistic.
Hopefully, this solution is actually realistic for the ICC and others in charge of cricket to consider.
****
Thank you all for reading! Comment below (or on social media about your thoughts and suggestions).
PS: Here is some bonus work on trying to find the ideal number of matches each team should play.
How do they compare to the standards of the English county teams? Which domestic teams made the largest strides in the last 1-2 years? And more.
I went through 504 pages of annual reports of these six clubs, so you don’t have to.
Without further ado, let’s jump right in.
Key Takeaways
Western Australia ($43 million profit), South Australia ($3.6 million), New South Wales ($1.4 million), and Queensland ($970,000) made profits in the last year, while Victoria ($180,000 loss) and Tasmania ($1.6 million) suffered narrow losses.
Western Australia ($111 million), South Australia ($101 million), NSW ($99 million), and Victoria ($83 million) have the largest total assets.
The largest total liabilities also lies with Western Australia ($50 million) with NSW ($13 million) coming in next.
Which Australian Domestic Team Earned the Most Money in 2023-2024?
The data provided is from the annual reports of each domestic team with financials accounted for the annual period ending on 30 June, 2024. Note that the ‘total comprehensive income’ (revenue – expenses for the year) is denoted as the ‘annual income’ in the tables below.
Note: All amounts are presented in Australian Dollar (AUD). The conversion between USD and AUD on 11/17/2024 is as follows: $1 AUD = $0.65 USD or $1 USD = $1.55 AUD.
1. Western Australia ($43 Million Profit)
Home Ground: Perth Stadium, WACA
Financial Health Status:Green
Assessment: The WACA Ground Improvement Project (WGIP) grant has inflated the revenues and assets for WA’s 2023-24 financial statement. Altogether Western Australia
“The final net result for the year was a surplus of $43,331,783 ($3,545,655 in 2022-23), achieved after including capital grants relating to the WACA Ground Improvement Project (WGIP) which have been recognised as revenue during the year….The net result from our normal business operations excluding WGIP related items was a deficit of $1,625,663 (surplus of $1,283,001 in 2022-23).“
Highlights from Executive Report
“Our success on and off the field would not have been possible without the support of our growing Membership, with a record number of 4,800 new Members across WACA and Perth Scorchers products this season.”
Other Key Points
Total cost for WGIP is $168,908,797 which will be funded by a combination of the state government ($109.7 million), federal government ($30 million), WA Cricket ($11 million), Cricket Australia ($4 million), and other funding sources. The project is set to be completed by July 2025.
Employee benefit expenses ($24.4 million in 2024 and $20.8 million in 2023) take up the largest portion of WA’s expenses. Contractors and consultant expenses also increased from $3.3 million in 2023 to $4.7 million in 2024.
+2% growth in children 5-12 playing cricket, +3% growth in junior boys, +5% growth in junior girls, +7% girls in Woolworths Cricket Blast, +13% increase in registered participation among women & girls.
“This summer, more than 18,000 Members attended international cricket, including the Men’s Test Match and T20 against the West Indies as well as the Women’s ODI against South Africa. More than 12,000 Members also attended WBBL Strikers games at Adelaide Oval and the Karen Rolton Oval. These numbers show that cricket is alive and well in this passionate sporting state.”
Other Key Points
Employee benefit expenses ($23.4 million – 2024 and $20.7 million – 2023) contributed to their largest expense,, while sales income ($52.6 million) generated the largest share of their income.
18% increase in girls cricket, 32% increase in SACA’s Primary School Cricket Competition, 5,660 registered in Junior cricket for ages 5-12 (4% increase)
Assessment: Although revenue remained steady in 2024, NSW’s expenses have increased this year. Since Cricket Australia’s distribution to NSW’s revenue will not increase, NSW had to make structural reorganization to balance their budgets for the upcoming year.
“Financially, we performed effectively again, recording a small deficit against a break-even operating budget and achieving a better than budget result in our total comprehensive income…Unfortunately, confirmation from Cricket Australia that there would be no increase in their distribution for 2024/25 required us to look at our cost structure and resulted in a reshaping of our organization.”
Highlights from Chairman’s Report
“The game of cricket itself continues to grow around the world. Cricket is now the second most loved sport in the world and the revenues in our game globally have grown substantially. Cricket NSW is determined to ensure Australia doesn’t get left behind…Last year Cricket NSW entered into an arrangement with Major League Cricket in the United States and helped develop the T20 league in that country. And we continue to push the cricketing world to ensure the traditional (and to many the best) format of our great game, Test cricket, doesn’t just survive but thrives.”
Other Key Points
“Cricket balls are one of the biggest expenses clubs incur during the season” and the $10,000 donation from Homestar Finance helped purchase cricket balls for 17 clubs in the region.
Cricket Australia Distributions provided the largest factor in revenue in 2024 ($43.3 million our of $64.1 million).
Players payment pool ($14.6 million), cricket performance ($10.47 million), and match/venue ($10.47 million) were the largest expenses for NSW.
30% increase in 5-12 year old cricket, including 50% increase for 5-12 year old girls.
Assessment: Financially, the revenue and expenses both increased, keeping them relatively stable. However, it was quite evident from the annual report that Queensland is disappointed in not hosting a Gabba Test in the 2026-27 season due to government’s Olympic planning.
“The State Government’s decision to not progress with its commitment to rebuild the Gabba and downgrade its proposed Olympic role has resulted in direct and indirect changes to how we proceed with our business…The most obvious impact will be that for the first time since 1976-77, a Test match will not be held at the Gabba in 2026-27…It is deeply disappointing that the 2026-27 Gabba Test has become a casualty of the uncertainty around the infrastructure planning and development ahead of the 2023 Olympic preparations.”
Highlights from CEO’s Report
“…Queensland Cricket was again able to achieve its budgeted financial surplus target for the year…The surplus amounted to $968,451 (2023: $863,602) which incorporates an amount of $442,142 representing gains from the QCA Future Fund. Excluding this amount, which is not available for general use, the net operating surplus for the year was $526,309.”
Other Key Points
ACIF (Australian Cricket Infrastructure Fund) contributed about $13 million across two rounds in improved cricket facilities and infrastructure.
“Participation in junior club cricket remains flat Statewide and has decreased in some regions.”
On the other hand, girls cricket is growing with 152% and 290% increase in Brisbane North and Bayside East/Redlands regions respectively. North Queensland has also seen a 1,000+ participation increase (27%).
TV viewership for Brisbane Heat in the BBL season average 759K per game. In particular, “Channel Seven’s free to air coverage was a particular highlight…[viewership] increasing by 40%” for Heat matches.
Employee benefits expense ($24.3 million – 2024, $21.2 million – 2023) was the largest expense for Queensland, with ‘state cricket match expenses’ coming next with around $3.8 million for 2024 ($4.3 million for 2023).
“…Cricket Victoria concluded the year reporting a $184,000 deficit for 2023-24…Pleasingly, key BBL revenue streams including ticketing and sponsorship continued to grow and return towards pre COVID levels. We also saw growth continuing across our new revenue streams – Cricket Victoria Foundation, School Holiday Programs and Melbourne Cricket Education Academy. Additional costs were incurred through the BBL season, as well as set up costs associated with the roll-out of new revenue initiatives that are planned for FY25 including the Victoria Health Club and Melbourne Cricket Academy.”
Highlight from Director’s Report
“Costs increased versus prior year, notably in employee related expenses reflecting the increase in payments to both male and female players. Employee expenses also rose with new roles added to support revenue growth initiatives and high performance, as well as general cost of living and legislated increases.”
Other Key Points
Men/boy’s participation grew 7.3%, women’s/girl’s participation grew 14.3% with over 41,000 boys/girls registered in the 5-12 year age group.
Over 60 projects received $1.3 million from ACIF for infrastructure improvement.
Employee, player, volunteer, and contractor benefit expenses was the largest expense incurred by Cricket Australia ($29.7 million – 2024, $25.7 million – 2023).
Home Ground: Bellerive Oval, Macquare Point Stadium, UTAS Stadium
Financial Health Status:Yellow
Assessment: While revenue streams remained steady for Tasmania between 2023 & 2024, expenses increased by about $4.5 million. The annual report offered positive outlook nevertheless with growing popularity, investment, and awareness of the sport in Tasmania.
“Investment in infrastructure is imperative from a professional and game development point of view, and the Macquarie Point Stadium project presents an exciting opportunity for sport in our State and for young Tasmanians to fulfill their dreams at home. I am firmly of the view that this is the sort of positive change that can set both Tasmania and cricket up to thrive in the future.”
After going through all these annual reports, one thing is clear—Australian cricket is thriving!
Membership is growing, investment and infrastructure development projects are on the rise, and the growth in junior girls cricket is on the rise as well. No wonder Australia continues to dominate world cricket and win trophies in both women’s and men’s cricket. They have a prospering and financially stable domestic system.
A common theme between all the teams was that expenses increased from 2023 to 2024 due to employee benefit and payment increase, which is probably a good thing. As long as the revenue continues to increase as well, the future looks good for Australian cricket.
****
Thanks for reading!
Before you Go, Please Check out my Book on Amazon on the Life Lessons from the Border Gavaskar Trophy!
 (400 x 100 px) (4)")