That got me thinking—How expensive is it to watch cricket around the world?
To conduct this analysis, I went through the checkout process and attempted to buy tickets for different types of matches in the first 10 Test playing nations.
If you would like to listen to an engaging conversational AI generated podcast about this article, check this out.
Key Takeaways
England & Australia are the most expensive places to watch cricket (they also have the most opportunities to watch along with India). Ticket prices can range from $185-1400 in a season for England to watch a couple of days of Tests, a few County matches, a few Hundred & Vitality Blast games, and 2-3 limited over internationals.
On the other hand, in Bangladesh, Sri Lanka, and Zimbabwe, a fan can watch matches for as low as $1 USD and can watch several games in a season for about $100 on the higher end.
Watching domestic cricket is completely FREE in India, New Zealand, and South Africa (both List A & 4-day). All you need to do is show up at the stadium (So GO, what are you waiting for?)
Cost of Watching Cricket: Most Expensive Places to Watch Cricket Around the World
We will provide ranges and consider a few different categories (if data is available):
Limited Over Internationals (LOI) – both men’s & women’s
Test Matches
Domestic Competitions
Franchise Leagues
For the sake of the cost comparison, we will be looking at General Admission ticket for Adult guests (in some countries like England, ‘members’ of the club receive discounted prices given that they have paid the annual membership fee). This analysis does not include member prices, bundles, or other discounts (or service/handling fees & taxes).
Note: These are ballpark ranges. Ticket prices may vary based on the match (for example, knockout and Finals matches may be more expensive) and the stadium.
If a spectator in England watched 2 days of a men’s Test, 5 County games, 1 men’s international, 2 Vitality Blast matches, 2 Hundred matches, 1 ODI cup, one women’s international, and 1 Women’s Hundred match in a season, they would spend (on tickets alone) between $260-$504 depending on the stadium and up to $1393.3 if they only chose premium seating.
Monthly Cost of Living: $1929
Average Monthly Net Salary: $3288.55
Annual Inflation Rate: 2.5%
Estimated Monthly Savings: $1359.55
Percent of Savings Spent on Cricket (Live): 4.54%-34.16%
*These economic numbers are for the United Kingdom as a whole, not just England.
Type of Match
General Admission Ticket Price (Adult)
Premium Tickets
A Day of a Test
£38-85 ($50.6-113.1)
£95-145 ($126.6-192.9)
Men’s LOI
£20-40 ($26.6)
£135 ($179.9)
Women’s LOI
£5-10 ($6.7-13.3)
£65 ($86.6)
County
£6-15 ($8.0-20.0)
£23 ($30.6)
Vitality Blast
£15-25 ($20-33.3)
£150 ($199.5)
The Hundred
£11 ($14.7)
£35 ($46.6)
One Day Cup
£5-20 ($6.7-26.6)
£37 ($49.2)
*These are ticket prices for non-members
How Did We Estimate the Ticket Price Range?
The international costs above are estimated from the upcoming England-Zimbabwe Test, India-England Women T20I series, and the men’s South Africa-England series, while the domestic costs are a ballpark number based on perusing several County’s websites.
Note: The prices for domestic price tickets in England vary vastly based on the County/stadium. For example, Kia Oval is at the more expensive side: £15-20 for County Championship matches, £32-40 for Vitality Blast, £40-85 for a men’s T20I, £18-30 for a women’s T20I, and £85-145 for a Test match.
Other Costs: Car Parking (£5+), Guided Tours: (£0-30), Full Season Membership (£240-270), Food, Drinks, Concessions (varies)
Where To Buy Tickets: Tickets can be purchased on the County, stadium, or ECB website. For international matches, you have to enter a ballot and hence, may not be guaranteed a ticket if there is high demand.
If a cricket fan in Australia went to watch 2 days of a men’s Test, 1 ODI, 1 Sheffield Shield match, 2 BBL matches, one women’s international, and 1 WBBL match in a season, they would spend (on tickets alone) at least $180 AUD ($122.6 USD)and as much as $900 $(613 USD) if they chose the premium seating.
Monthly Cost of Living: $1,944
Average Monthly Net Salary: $3,819.73
Annual Inflation Rate: 3.5%
Estimated Monthly Savings: $1875.73
Percent of Savings Spent on Cricket (Live):2.2%-10.89%
Day 4 Tickets: For the Boxing Day Test MCG, the General Admission has a starting price for $30 with reserve stands as high as $85.
Type of Match
General Admission Ticket Price (Adult)
Premium Tickets/Lounge/SkyDeck
A Day of a Test
$30 AUD ($20.4 USD)
$170 AUD ($115.8 USD)
Men’s LOI
$30 ($20.4)
$170 ($115.8)
Women’s LOI
$20 ($13.6)
Domestic Cricket
$10 ($6.8)
Franchise Cricket(BBL)
$27.5 ($18.7)
$165 ($112.4)
WBBL
$10 ($6.8)
*Note: For some Tests (for example, Adelaide BGT, there are ‘Twilight Adult’ prices if the entry is after 5 PM at a discounted price of $22.5).
Watching 2 days of a Test, 2 SuperSmash matches, a men’s limited overs game, and a women’s limited over game can cost anywhere between $109 to $160 in a season.
Monthly Cost of Living: $1782
Average Monthly Net Salary: $3156.96
Annual Inflation Rate: 3.1%
Estimated Monthly Savings: $1,374.96
Percent of Savings Spent on Cricket (Live):1.96%-2.81%
Type of Match
General Admission Ticket Price (Adult)
Premium Tickets
A Day of a Test
$45 NZD ($28 US)
$70 NZD ($43.6)
Men’s LOI
$35 ($21.8)
$65 ($40.5)
Women’s LOI
$20 ($12.5)
Domestic Cricket
FREE
SuperSmash
$15 ($9.4)
*Note: A Test Match Pass (all 5 days) can be purchased, which ranges from $145-220 NZD.
Entry to Plunkett Shield (first class) and Ford Trophy (List A) are free.
Two days of a men’s Test, 1 Men’s ODI, 1 Women’s ODI, and 2 SA20 matches in Bangladesh would cost a spectator somewhere in the range of $44-89 in one season.
Monthly Cost of Living: $974
Average Monthly Net Salary: $1446.04
Annual Inflation Rate: 4.9%
Estimated Monthly Savings: $472.04
Percent of Savings Spent on Cricket (Live):3.1%-6.3%
In India, watching 2 days of a men’s Test, 1 ODI, 2 IPL matches, 1 women’s international, and 1 WPL match in a season, would cost (on tickets alone) between $30-140 on the lower end and about $294 on the higher end over a season. Keep in my end, that or certain IPL teams like RCB, tickets can go as high as $634 alone!
Monthly Cost of Living: $423
Average Monthly Net Salary: $633.49
Annual Inflation Rate: 4.6%
Estimated Monthly Savings: $210.49
Percent of Savings Spent on Cricket (Live): 14.25%+
*This is a bit skewed since population of India has widespread economic disparity. Those who can probably afford to purchase tickets are the only ones that would purchase those premium/VIP tickets.
Type of Match
General Admission Ticket Price (Adult)
Premium/VIP
A Day of a Test
INR 125-200 ($1.5-2.4)
INR 1000-2000 ($12-24)
LOI
INR 750 ($9)
INR 10000 ($119.8)
Women’s International
FREE*
INR 150 ($1.8)
Domestic Cricket
FREE
IPL
INR 700-5000 ($8.4-60)
INR 5000-52938 ($59.9-$634.4)
WPL
INR 100-500 ($1.2-6)
As per Hindustan Times, “Pricing is decided as per demand and supply, affordability, culture, and the eagerness of the people to pay” when it comes to IPL prices. Hence, there is a wide range in IPL tickets depends on which player/teams are playing and when the ticket has been purchased.
Here are some other notes:
Non-international matches are free to attend.
*The entry to women’s Test between India & South Africa was free, while the T20Is were priced for INR 150.
Long story short, watching sports can be a fun and expensive experience.
Final Thoughts
The main thought of writing this article was to answer the question, “Is cricket affordable for the common man?”
With rising cost of living standards around the world and mobile/TV accessibility of cricket, are boards doing enough to incentivize followers to go to the ground?
In general, cricket is not as expensive as other sports. However, if Test cricket is to survive, £95 Day 4 tickets is probably not going to help.
If the trend continues, cricket will become only an elitist game. It began as an elitist game, but do we want to keep it that way?
If you are interested in cricket & finance, consider checking out the following:
Umpires bringing out their light meters out is a common sight in England’s overcast conditions.
We cannot control the weather. So, how can we fix this?
Several proposals have come up over the years: Better Drainage systems (see Sri Lanka), pink ball all the time (especially England), and earlier starts in the day for late-summer months.
All are good ideas, but let’s consider another idea that has been vaguely mentioned—A covered or ‘retractable’ stadium.
Remember that one stadium where the Shahid Afridi hit 12 runs in one ball? Yep, that’s the one.
Key Takeaways
In one of our previous analysis, “How Much Money Does It Take to Host a Test Match?,” we estimated that it takes about $350,000-$1.4 million per 5-day Test depending on the technology used i.e. about $70,000-$280,000 per day of cricket.
It takes about $100-$150 million to add a retractable roof in a stadium (although in some cases the expenses ballooned up to $300 million). For maintenance & repairs, a future budget between $20-30 million needs to be kept aside.
It would take about 357-4,286 days of rain affected matches for the cost of the retractable roof to recover*
In England’s 2024 home season (men’s), six days were rain-affected, one of which was washed out and 5 others were affected by bad light. In 2023, 9 Tests & 5 ODIs were impacted by rain, five of which were no results or complete wash outs. At least 2-5 Hundred matches were marred by rain as well.
The 2024 T20 World Cup had 8 rain-affected games with four abandonments, while the 2019 ODI WC in England had 3 washouts, 4 reduced matches, and one two-day semi-final contest.
*If the roof is only used for international cricket and no other sport
The NFL cannot afford to lose millions of advertising dollars due to weather or unnecessary delays, so they are more inclined to pick stadiums with a covered roof.
Rick Schlesigner, the CEO of Brewers said that he is “very pleased with the roof.” As of 2018, the roof had been used 4,014 times and had “delivered its promise to fans.”
What About Maintenance?
Building the stadium is only a part of the equation, recurring repair & maintenance costs is the other. Brewers’ have estimated that future repairs, maintenance, ironworkers, engineers, roofers will cost about $37.1 million.
Building NFL stadiums is already a costly endeavor. According to Constructive Dive, the overall construction cost for the SoFi Stadium in Los Angeles cost a record $5.5 billion (most expensive stadium ever built), Mercedes-Benz Stadium in Atlanta was about $1.5 billion, and the U.S. Bank Stadium in Minneapolis was about $1.2 billion.
Similar, the owner of the MLB team, New York Mets, estimated that it would take them $800 million to add a retractable roof, while it would have only costed $125 million if it were to be installed during construction.
Here are a few examples of stadiums from different sports and how much their construction cost for a covered stadium. This is not an exhaustive list by any means.
Although cricket was a pioneer in adopting technologies like Hawkeye, it is way behind in architectural investment and innovation.
Archibald Stadium – Carrier Dome ($26.85 Million)
Sport: College Football
Location: Syracuse, New York
Capacity: 40,000
In 1980, Carrier Dome at Syracuse University was one of the first covered domes and the largest collegiate dome. It cost about $27 million back then. The dome was later renovated in 2021 for $118 million.
Huntington Bank Field, Cleveland Browns ($2.4 Billion – Proposed)
Sport: NFL
Location: Cleveland, Ohio
Capacity: 70,000
The proposed $2.4 billion investment for the dome would be split between public and private financing, making the $1.2 billion allocated for private investment as the largest private per capita stadium investment in the country.
This stadium will utilize ethylene tetrafluoroethylene (ETFE), essentially a plastic-see through roof. This is based of other stadiums that have used ETFE like the Allianz Arena in Munich, Dunedin’s Forsyth Barr Rugby stadium (cost around $200 million overall), Las Vegas bowl, and Bejing.
The ‘Big O’ Montreal Stadium ($875 Million – Proposed)
Sport: Olympics Stadium
Location: Montreal, Canada
Capacity: 73,000
*Note: The 1976 Olympic stadium is getting a makeover with the roof itself costing $875 million. The replacement roof will not be retractable, but will be translucent to allow for sunlight.
In most cases, the city that hosts the stadium is responsible for paying for any stadium, construction, and repair costs.
Influx of private partnership is helping alleviate some of the costs that the local government gets burdened with.
Due to the complex funding structure, the planning and construction process can go through political interference, red tape, delays, and budget overruns.
How Will A Retractable Stadium in Cricket Impact Playing Conditions?
Playing conditions play a major role in cricket.
Will the amount of swing decrease in England? Do we want natural elements to go out of the game?
To find out how much money cricket lost to rain, we first figured out how many days were affected by rain.
We will consider the last three home seasons for the England’s men’s team as well the last few ICC tournaments.
England Home Season (Men’s)
*Note: W/O denotes complete wash out. N/R denotes No Result
2024 Season
Rain Affected/Wet Outfield
Bad Light
3rd T20I v Pak (W/O) 3rd Test v WI, Day 2 1st Test vs SL, Day 2 1st Test vs SL, Day 3 3rd Test vs SL, Day 3
1st Test vs WI, Day 1 1st Test vs SL, Day 1 2nd Test vs SL, Day 3 3rd Test vs SL, Day 1 Day 2 Day 3
2023 Season
Rain Affected/Wet Outfield
Ashes 1st Test, Day 3 1st Test, Day 5 2nd Test, Day 1 2nd Test, Day 3 3rd Test, Day 3 4th Test, Day 4 4th Test, Day 5 (W/O) 5th Test, Day 4 5th Test, Day 5 Ire v Ban, 1st ODI (N/R) Ire v Ban, 2nd ODI(45-over ODI) Ire v Eng, 1st ODI (W/O) Ire v Eng, 3rd ODI (N/R) NZ v Eng, 2nd ODI (34-over ODI)
*Note: Not many matches were affected by Bad Light in 2023, most of the interruptions were all rain/wet outfield related.
2022 Season
Rain Affected/Wet Outfield
Bad Light
1st Test* v Ind, Day 2 Day 3 Day 5 (W/O) 2nd Test* v Ind, Day 1 5th Test v Ind, Day 1 Day 2 Day 3 1st Test v NZ, Day 3 2nd Test v NZ, Day 2 3rd Test v NZ, Day 1 Day 3 Day 5 2nd ODI v SA (29-over ODI) 3rd ODI v SA (N/R) 1st Test v SA, Day 1 3rd Test v SA, Day 1 (W/O) Day 2 (W/O)
1st Test v Ind, Day 2 2nd Test v Ind, Day 4 3rd Test v Ind, Day 3 4th Test v Ind, Day 3 3rd Test v SA, Day 3 SA, Day 4
*Note: We exclude these matches from our calculations since the 1st 4 Tests of the Pataudi Trophy were held in 2021
ICC & Other Tournaments
2024 T20 World Cup
2024 (M): Match 6 (N/R), Match 23 (W/O), Match 30 (W/O), Match 33 (W/O), Match 34 (10-over), Match 44 (11.2-over DLS), Match 50 (17-over DLS), Match 52 (19-over DLS)
2023 (W): Match 18 (8.2-over DLS)
ODI World Cup
2023 (M): Match 35 (25.3-Overs DLS)
2022 (W): Match 5 (27-over), Match 20 (20-over), Match 23 (N/R), Aus-WI SF (45-over)
2019 (M): Match 7 (41-over), Match 11 (W/O), Match 16 (W/O), Match 18 (W/O), Match 21 (48-over), Match 22 (40-over DLS), Match 25 (49-over), Ind-NZ SF (2 days)
2017 (W): Match 6 (W/O), Match 21 (24-over DLS), Ind-Aus SF (42-over)
The Hundred
2024 (W): Match 21 (W/O), Match 32 (N/R)
2024 (M): Match 21 (N/R), Match 29 (44-balls), Match 30 (N/R), Match 32 (30-balls)
2023 (W): Match 2 (W/O), Match 3 (W/O), Match 6 (W/O), Match 7 (W/O), Eliminator (N/R)
2023 (M): Match 2 (40-balls), Match 6 (N/R), Match 7 (W/O), Match 11 (NR), Match 18 (90-balls)
2022 (M/W): None
Note: We only consider England’s home season and The Hundred. County Championship, Royal One Day Cup, and the T20 Vitality Blast lose a number of matches.
For a sport that seems to be struggling financially on a larger scale, adding a retractable roof in cricket is, in most cases, a bad idea.
Of course, we cannot build a retractable in every stadium. However, countries that can afford and/or have a dire need may be able to afford this on a case-by-case basis.
For example, the Wankhede, Eden Gardens, or the Narendra Modi Stadium in India, SSC in Sri Lanka, Lord’s in England (in case they host the WTC Final for the next 100 years), and the MCG in Australia for some of the larger occasions.
Richer leagues like the NFL & MLB may help subsidize the cost of ultra-expensive stadiums in the USA. With IPL’s growing wealth, the BCCI may be able to help subsidize these types of stadium enhancements around the world as well. Who knows.
What do you think?
Anyway, retractable roofs in cricket are just one part of the alternative. We will do deep dive into how drainage systems work in cricket and other sports at a different time.
Recently, I posted a research article on the financials of County Cricket, which revealed the recent profit & loss trends of each County Cricket Club.
However, one piece of feedback I received was that it only painted part of the picture.
It was a valid critique. So I said to myself, why not go through the annual reports all over again but from a different perspective.
This time, we will look at how much debt each County is in, and how much asset they possess.
Key Takeaways
Yorkshire (£ 26.1 million), Hampshire (£ 14.3 million), and Surrey (£ 12.8 million) have the have the highest net current liabilities, while the MCC (£ 27.6 million), Warwickshire (£ 2.1 million), and Lancashire (£ 1.2 million) have the highest net currentassets.
Similar to last time, I separated the first class Counties (from worst to best) in terms of how much money they owe currently (net current liabilities/asset).
Note: It is not necessarily a bad thing to have liability. The MCC, for example, has £ 91 million in liabilities, but also have a mammoth £ 174 million in assets.
How Do You Read a Balance Sheet?
First a quick accounting lesson.
While the main instrument of our previous analysis was the ‘Profit and Loss Account’ statement, this time, we take a deep dive into the ‘Balance Sheet.’
Indian investor, Rakesh Jhunjhunwala, is accredited to have once said
“You know, a balance sheet is like a bikini. It shows more but it hides what is vital.”
– Rakesh Jhunjunwala
During this process, I had to teach myself how to read a balance sheet before I could start analyzing! So, I’ll try my best to condense the balance sheet information into digestible pieces of information for you.
In a balance sheet, everything basically needs to add up. The main equation to keep in mind here is:
Equity = Assets – Liabilities.
Assets are made up of fixed assets (like value of stadiums) and current assets. On the other, liabilities include amount falling due within one year (short-term debt) and amount falling due after more than one year (long-term debt like bank loans).
In long-term debt, we have included “creditors: amounts falling due after more than one year”, “less deferred income”, “provision for liabilities,” and “unamortised grants” among others.
So, which County Cricket Club has the Most Debt?
We rank the clubs based on the net current liabilities/debt or net current assets.
Since most clubs have healthy total fixed assets, we look at net current liabilities to see how much amount is owed by the club in the upcoming year or so.
(Note: I use Debt/Liability interchangeably but liabilities is the proper term because it can include debt, loan, deferred income, etc.).
1. Yorkshire (£ 26.1 Million Debt)
Assessment: Yorkshire is probably in the worst financial state of any of England’s first class county cricket clubs. The club has high liability (both short and long-term) and negative reserves.
They are currently going through refinancing and Colin Graves’ family trust loans are keeping the club afloat. Graves himself has stated that a private ownership model is needed for club’s financial health.
Debt Status:Red
“In the event that sufficient funding is not obtained, Colin Graves has undertaken to provide the necessary support.”
Net Current Liabilities: £ 26,129,858 (2023), £ 8,717,446 (2022)
Total Assets less current Liabilities:– £ 1,938,730 (2023), + £ 19,450,848 (2022)
We can see the CJ Graves and his family trust is owed a lot of money (about £ 15 million) by the Yorkshire County Cricket Club (see section 8: Creditors: amounts falling due within one year below).
Net Current Liabilities: – £ 12,815,000 (2023), – £ 7,075,000 (2022)
“As in previous years, net current liabilities includes deferred income – relating to membership subscriptions, advance ticket sales and hospitality deposits – which does not represent future cash outflows.”
Total Assets less current Liabilities:£ 62,992,000 (2023), £ 59,909,000 (2022)
Assessment: Gloucestershire’s short-term debt sky-rocketed in 2024. Clearing these liabilities as soon as possible would be in their best interest, even though their fixed assets are holding them up for the time being.
Assessment: Their long-term debt continued to go down and the value of their assets continued to rise. However, their short-term liabilities are also on the rise, which they need to keep in check.
*Note: Their 2022 liability section in their financial statement was empty, but we were able to calculate the total liabilities based on the rest of their balance sheet for 2022.
Net Current Liabilities: – £ 3,270,947 (2023), – £ 2,363,519 (2021)
Total Assets less current Liabilities:£ 4,756,819 (2023), £ (2022), £ 5,487,663 (2021)
Assessment: In 2022, Somerset reduced their long-term debt and declared a ‘positive financial result in a challenging environment’ in their financial report. We have marked them as yellow, because current liabilities still outweigh the value of their current assets.
Assessment: Middlesex took strides in decreasing their current liability from 2022 to 2023. However, their reserves are extremely low, so they need to be careful (due to low-valued fixed assets).
Debt Status:Yellow
2023
2022
Total Assets
+ £ 1,596,000
+ £ 1,421,000
Total Liabilities
– £ 1,527,000
– £ 1,483,000
Equity/Reserves
+ £ 69,000
– £ 62,000
Breakdown of Assets
Fixed Assets: £ 538,000 (2023), £ 580,000 (2022)
Current Assets: £ 1,058,000 (2023), £ 841,000 (2022)
Assessment: Their current liabilities decreased massively from 2021 to 2022. They are in the right direction, and should be able to come out of debt soon if the trend continues.
Assessment: Northamptonshire are slightly in debt, but not by much. However, they do not have high valued fixed assets like some of the other clubs, so they may need to tread the next couple of years carefully.
Assessment: Essex has seen a recent drop in every department—Lower equity, lower asset value, but also lower liabilities, but overall staying above water.
19. Marylebone Cricket Club, The MCC (£ 27.6 Million Asset)
Assessment:£ 118 million in fixed asset is all that you need to know about the MCC. Even though have about £ 63 million long-term liabilities, they are well above water. High reserves, positive current assets.
The ECB have managed to get approval from the 18 counties and the MCC for a ‘direction of travel’ (whatever that means) as a next step towards privatizing The Hundred. This will change the revenue model currently in place between the ECB & the Counties.
This made me wonder why the ECB had come up with The Hundred in the first place and why they are now moving towards privatizing the tournament.
Are all County clubs struggling financially? If yes, how bad are their situations?
I wanted to get to the bottom of this. So I researched all 18 Counties’ (and MCC’s) Annual Reports & Financial Accounts.
Here is what I found out after perusing through about 617 pages of annual reports.
Key Takeaways
Surrey (£ 8 Million – 2023), Lancashire (£ 2.4 Million – 2022), and Warwickshire (£ 1.3 Million – 2023) saw the most profit in a year, while Yorkshire (£ 7 Million Loss – 2023), Hampshire (£ 1.3 Million – 2022), and Gloucestershire (£ 1.2 Million – 2023) had the largest losses.
I separated the Counties in three categories based on their current financial health status.
Several teams highlighted inflation, rising interest rates, and rising energy costs as points of concerns looking at the future.
Although Test cricket is usually costly to host and results in losses for most cricket boards, County Clubs benefit when they host Ashes Tests (and ODIs). Membership soars, tickets are sold out, and the general interest in the County game increases. That is why many Counties experienced a boost in 2023 (except for Yorkshire).
The Counties below are arranged by the profit/loss in their latest released financial statements (not their overall reserves). We have summarized quotes from annual reports, factors contributing to growth, future outlook & concerns, etc. to provide a holistic view of the club. We made our financial health assessments as follows:
Green: Annual profits (mostly) for two years in a row and surplus reserves.
Yellow: (1) Recent annual losses but overall surplus reserves, (2) recent profits but negative reserves, or (3) concerns from the treasurer/CEO/chair in their written statements despite positive financials.
Red: Annual losses for two years in a row as well as negative reserves.
If debts and loan repayments were called out in the report, we mention it. However, other important metrics like detailed balance sheet and long-term debt analysis for each County is a deep dive for another day. (All the sources are linked at the end of each section if you are interested to learn more).
*Note: Results are presented from the club’s most recent Annual Report. Some clubs have already released their 2023 reports (that covers both 2023 & 2022 financial reports) while some others have only released 2022 reports (that cover 2022 & 2021 financial reports). The reports are sourced at the end of each section.
**The annual total represents the total comprehensive income for the club after taxation.
1. Surrey (£ 8 Million Profit)
Division: Division One
Home Ground: The Oval
Financial Health Status:Green
Assessment: Positive annual returns pushed their reserves even higher, but they are expecting a tough 2024.
Surrey’s 2-Year Profit/Loss
Year
2023
2022
Annual Total
+ £ 7,999,000
– £ 1,332,000
Total Reserves
+ £ 29,200,000
+ £ 21,167,000
Treasurer’s Report Summary
“We have delivered an excellent financial performance in 2023 and look forward to continuing growth over the medium term. In the short term however, we expect a difficult year in 2024. We have a Friday start in our Test match, and an IT20 not an ODI.”
Positive Highlights from Surrey’s Annual Report
Membership grew by 18,739
Men’s Ashes Test (Sold Out), India vs Australia WTC Final (Sold Out)
Women’s Ashes IT20 (20,000 tickets)
Strong T20 Vitality Blast Attendance
Financial Concerns for Surrey County Cricket Club
Inflation, Increases in Rent
Overheads expenses increased by £6,300,000 compared to 2022
Staffing Increase Costs (recovery from COVID staff reduction)
Assessment: The Ashes helped boost Warwickshire’s 2023 return. Financial growth moving in the right direction for the club.
Warwickshire’s 2-Year Profit/Loss
Year
2023 (10/01/2022-12/31/2023)
2022 (09/30/2021-09/30/2022)
Annual Total
+ £ 1,310,068
+ £ 123,791
Total Reserves
+ £ 8,783,073
+ £ 7,233,214
*Note: + £ 277,600 revaluation reserve was added to the + £ 1,310,068 for a total growth of + £ 1,588,069 in the 15-month period.
Chief Operating Officer’s Report Summary
“In summary, revenue for 2023 was substantially higher than in 2022, principally driven by hosting the men’s Ashes Test match. Costs were also substantially higher in 2023 primarily due to the increase in Major Match day (MMDs) staging fees paid to the English and Wales Cricket Board (ECB) and the additional 3 months salary costs…”
Positive Highlights from Warwickshire’s Annual Report
Men’s Ashes Test
Catering and hospitality revenues (driven by the Ashes Test)
T20 Blast and Hundred ticket revenue increases
Partnership revenue increases
Financial Concerns for Warwickshire County Cricket Club
Expenses increase (cost of sale, administrative cost, overhead costs)
Inflation
Operating EBITDA decreased 6%
*Year ending on 31st December, 2023 (Note: Warwickshire changed their annual report date from 30th September to December so had 15-months to account for in this latest report instead of just the 12).
Assessment: Although 2022 was not as profitable as 2021, the club retains its massive surplus.
Nottinghamshire’s 2-Year Profit/Loss
Year
2022
2021
Annual Total
+ £ 689,623
+ £ 1,331,476
Total Reserves
+ £ 6,726,973
+ £ 6,037,335
Treasurer’s Report Summary
“Although there were some positive and negative movements in comparison tour budget for the year, the end result was closely aligned to our forecasts. he continued generation of surpluses has ensured the club continues to meet all of its debt repayments, minimising any interest charges accrued…”
Positive Highlights from Nottinghamshire’s Annual Report
Hosted Test, T20I
“Larger-than-forecast number of membership subscriptions
Strong catering and retail return on Day 5 of Test match
“Successful staging of The Hundred…to a significantly better level than in 2021.”
Financial Concerns for Nottinghamshire County Cricket Club
Scheduling concerns (Friday start to Test match caused hospitality and Day 4 financial concerns)
3 home Vitality Blast games in five days
Rising electricity prices, rising national minimum wage
Assessment: From the financial statements, Somerset is growing and has ample surplus. However, the annual report suggests that the board of directors are wary of challenges that may impact them in this straining economy.
Somerset’s 2-Year Profit/Loss
Year
2022
2021
Annual Total
+ £ 399,328
+ £ 149,087
Total Reserves
+ £ 10,231,772
+ £ 9,833,700
Financial Review Summary
“…the year…represented a return to something resembling a more ‘normal’ year, although operations were negatively impacted by challenges emanating from the legacy of the pandemic…We are well positioned financially to absorb potential economic shocks over the coming months and to take advantage of opportunities that we are proactively seeking out, as we operate in an economic, political and cricketing landscape of rapidly-changing variables and volatility.“
Positive Highlights from Somerset’s Annual Report
Surplus in these two years meant that ‘debt levels remain manageable’
+ £ 540,562 resulting from membership subscriptions and match receipts
Strong year by the commercial team as it relates to business partners and sponsors
Financial Concerns for Somerset County Cricket Club
Inflation, conflict in Europe, rising interest rates
Assessment: Durham has benefitting from external events to add to their surplus and recent profits.
Durham’s 2-Year Profit/Loss
Year
2023
2022
2021
Annual Total
+ £ 1,531,190
+ £ 333,033
+ £ 1,560,754
Total Reserves
+ £7,888,727
+ £ 6,357,537
+ £ 6,024,504
*Note: In 2023, £ 285,756 was the profit for 2023, while £ 1,531,190 was the total comprehensive income for 2023 (including £ 1,245,434 was the revaluation of tangible fixed assets)
Chairman’s Review Summary
“With our events business performing strongly and the strong financial management of the last few years continuing, I am delighted to report a profit of £333,0333 in the current financial year as we look to continue strengthening our financial position for the challenges ahead…The key business risks affecting the group are considered to relate to staging of international cricket and the share of money we receive that is generated through the ECB…Failure to stage international cricket beyond this date would have a financial impact on the group through lost turnover.”
BusinessLive Article Summary
According to BusinessLive, who had access to Durham’s 2022 Annual Reports and financial statements, they quoted Chairman Lord Botham as follows:
“Current year turnover has risen to £ 8,048,739 as a result of the Durham Cricket Events business performing strongly over the year.”
*In 2021, the turnover was + £ 7,108,908
Positive Highlights
Plans of building a hotel on site
Concerts & events provide financial boost
Two fixtures two host (in 2026 & 2028)
Food and beverage income almost doubled
Potential Concerns
Average number of employees decreased by 16 (135 to 119)
*Year ending on 30th September, 2022
Note: I could not initially find Durham’s annual reports, so had to rely on the Business Live article. Special thanks to Reuben Herbert and Graham Smith for sending me Durham’s updated financials and pointing me in the right direction!
They should still publish accounts at Companies House.
“Middlesex Cricket can today announce that for the financial year ending November 2023, the Club has recorded a profit after tax of £ 131,000...After such an extended period of posting significant losses, to turn the business around a time when the game is under financial pressure is a credit to everyone involved.
“After two years of extremely heavy losses caused by the pandemic and the pension scheme deficit, in 2022 we began the slow journey back to financial stability…The net assets of the Club that were less than £ 200K at the start of the year have now been exhausted. What this means is that making a profit in the year ahead is non-negotiable and that our activities and ambitions must be focused on meeting this target.“
Positive Highlights from Middlesex’s Annual Report
ECB county partnership agreement fees increased
Member subscriptions, ground receipts, sponsorships, hospitality/events saw an uptick
Financial Concerns for Middlesex County Cricket Club
Wages and salaries cost increased
Insurance, social security, pension costs, etc. increased
Assessment: Not as much of a surplus as some of the bigger clubs, but they have been profitable and are slowly moving return to normal from the financial consequences of the pandemic.
Northamptonshire’s 2-Year Profit/Loss
Year
2023
2022
Annual Total
+ £ 110,164
– £ 1,474
Total Reserves
+ £ 1,361,920
+ £ 1,251,716
Directors’ Report Summary
“Post pandemic the club benefitted as the local community looked to enjoy life again. Season ticket sales, gate income, and conference & events revenue not only recovered, but far exceeded pre-pandemic levels.”
Positive Highlights from Northamptonshire’s Annual Report
Hosted T20I vs India (Sold Out)
Financial Concerns for Northamptonshire County Cricket Club
Increasing energy costs (now investing in solar panels to counter costs)
Assessment: An excellent two years means Derbyshire has accumulated a bit of surplus for themselves.
Derbyshire’s 2-Year Profit/Loss
Total
2023
2022
Annual Total
+ £ 70,000
+ £ 138,000
Total Reserves
+ £ 3,087,000
+ £ 3,017,000
Finance Director Summary
“From a financial results point of view, it has been another very good year for the Club, showing a strong income and expenditure performance and an improvement in the long-term balance sheet position…Looking ahead to 2024 and beyond there are a number of challenges we face which will inevitably make future years more difficult financially.”
Positive Highlights from Derbyshire’s Annual Report
Sponsorship, Advertising, Hospitality
Conference and Events
Financial Concerns for Derbyshire County Cricket Club
Inflation
“Commercial sponsorship is proving difficult across England….we will have to work hard to ensure we don’t see a drop in this income.”
Assessment: Although Worcestershire have a decent surplus for five years running, the losses in 2019 and 2022 were far greater than the minimal profits made in 2020, 2021, and 2023 respectively.
Worcestershire’s 5-Year Profit/Loss
Year
2023
2022
2021
2020
2019
Annual Total
+ £ 13,340
– £ 203,287
+ £ 8,477
+ £ 21,635
– £ 81,810
Total Reserves
+ £ 2,184,117
+ £ 2,170,801
+ £ 2,374,044
+ £ 2,365,567
+ £ 2,343,977
*Note: Worcestershire documents 5-year profit/loss on their annual reports rather than 2-year profit/loss as other clubs.
Accounts Commentary Summary
“There has been an uplift in revenue across nearly all sectors of our operations…Financial sustainability remains a paramount concern for the Club, as well as for other venues not hosting Test matches or The Hundred. It is imperative that we generate sufficient profits to ensure debt repayment. A strategic focus for 2024 will be the development of new revenue streams beyond cricket and the expansion of existing operations.”
Positive Highlights from Worcestershire’s Annual Report
15% increase in match ticket sales (both red & white ball games)
Catering Department delivers profit of £282,000
2 Music concerts
Financial Concerns for Worcestershire County Cricket Club
Assessment: Although Kent is in the profits over the last couple of years and have ample reserves, the chair of the board voiced his concern in the seismic shift that County Cricket is facing and what this uncertainty implies for the club.
Kent’s 2-Year Profit/Loss
Year
2023
2022
2021
Annual Total
– £ 469,448
+ £ 6,488
+ £ 282,235
Total Reserves
+ £ 6,986,301
+ £ 7,455,751
+ £ 7,449,232
Chair’s Report Summary
“Two of the High Performance Review’s conclusions – structure and schedule – presented an existential threat to both our Club and the essential fabric of the county game…There is no question that Sir Andrew did a high quality piece of of work in the context of his brief. He has come up with many good ideas and the game has gained useful insights from subject experts across sport. However, it was when suggesting a County game structure and schedule that had the sole purpose of improving the England teams, the matters became more vexed…Reducing County Cricket in Kent to five home Championship games, five T20s and potentially one or two 50 over games would have rendered the Club completely irrelevant. Four days of cricket a month throughout the season would have meant that we became invisible.“
Positive Highlights from Kent’s Annual Report
Development of media and marketing
New ‘state-of-the-art ticketing system’
Digital match day streaming service grew
Stable ticket sales
Financial Concerns for Kent County Cricket Club
“Inflation, labour shortages, rising interest rates, and higher energy prices”
The Hundred’s negative impact on T20 Vitality Blast crowds (due to change of schedule)
Assessment: From a five year outlook, we can see that Leicestershire has had 4 years of losses. Since surplus are still in a relatively healthy condition, I went with a ‘Yellow’ financial rating for them.
Leicestershire’s 2-Year Profit/Loss
Year
2023
2022
2021
Annual Total
– £ 440,112
– £ 320,341
+ £ 482,892
Total Reserves
+ £ 2,109,609
+ £ 2,549,723
+ £ 2,870,064
The past 5-year annual total summary for Leicestershire are as follows:
“Encouragingly the reliance on the central funding dropped from 78% to 65% during the year. However we must continue to reduce this number and become more self-sufficient. This will remain one of our key targets during during the short and medium terms.”
Positive Highlights from Leicestershire Annual Report
Facilities and commercial revenue grew
Increased hospitality
Record numbers for T20 attendance
Financial Concerns for Leicestershire County Cricket Club
Assessment: Losses for consecutive years, but still holding onto decent reserves.
Essex’s 2-Year Profit/Loss
Year
2022
2021
Annual Total
– £ 378,983
– £ 508,226
Total Reserves
+ £ 2,336,488
+ £ 2,715,471
Essex’s Notes to the Accounts Summary
“Based on current forecasts, total cash outflows exceed total cash inflows in the forecasted period to December 2024. The Club is actively looking to address this loss and cashflow situation to avoid having to sell part of its investment portfolio to cover this shortfall. These matters indicate that a material uncertainty exists that may cast significant doubt over the ability of the Club to continue as a going concern.”
Positive Highlights from Essex’s Annual Report
Matches, commercial activity, and membership resulted in the most profit for Essex
Financial Concerns for Essex County Cricket Club
Buildings (net – £ 690,254) and cricket operations (net – £ 435,987) resulted in the most net loss in 2022
Assessment: Massive positive reserves but the direction of annual losses are not going in the right direction.
Glamorgan’s 2-Year Profit/Loss
Year
2023
2022
Annual Total
– £ 528,294
– £ 39,248
Total Reserves
+ £ 9,767,471
+ £ 10,295,765
Chair’s Report Summary
“The club is reporting a reasonable financial outcome for the year…2024 will be a challenging year financially and the club has had to reduce its cost base in order to produce a budget with a similar EBITDA to 2023.”
“…It is worth remembering that the game of cricket is undergoing generational change as the rise of Indian cricket and the Indian Premier League has the potential to shift the old order and orthodoxies. While this process will undoubtedly be disruptive and challenging, it will also potentially provide opportunities for individual clubs to reset their financial, strategic, and operational activities onto a more positive and sustainable basis. Rest assured that the Board will work to ensure that Glamorgan is positioned to take advantage of these trends as they develop.”
Positive Highlights from Glamorgan’s Annual Report
International stadium
International match staging agreement with the ECB till 2031
“Stable financial position with minimal debt”
Hundred team/host based in Wales
Financial Concerns for Glamorgan County Cricket Club
“Adverse macro-economic environment in which we currently operate” (ex: higher interest rates)
Assessment: Similar to Glamorgan, two consecutive years of losses (and 2023 was way worse than 2022) is a bit of concern, but overall, they are still holding up well.
Sussex’s 2-Year Profit/Loss
Year
2023
2022
Annual Total*
– £ 735,616
– £ 39,418
Total Reserves
+ £ 8,461,170
+ £ 9,196,873
Note: In the annual report, both Sussex Cricket Limited and Sussex Cricket Foundation’s earnings have been reported. We only state SCL’s profit/loss (since it is based on membership, matches, etc.)
*Even though Sussex had + £443,929 operating profit in 2022, the total comprehensive income was – £ 39,418. Similarly in 2023, they had an operating loss (- £ 121,918) but an even larger total comprehensive loss (-£ 735,616)
Treasurer’s Report Summary
“Income decreased 5.6% in FYE 2023 while expenditure increased 2.8%.”
Assessment: Two consecutive years of losses (Losses for 2023/2024 almost doubled), but they do not have the luxury of reserves like Sussex & Glamorgan.
Gloucestershire’s 2-Year Profit/Loss
Total
2024
2023
Annual Total
– £ 1,190,000
– £ 570,000
Total Reserves
+ £ 1,790,000
+ £ 2,980,000
*Year ending on 31st January, 2024
Treasurer’s Report Summary
“This year has been a challenging year financially for a number of reasons and there is no doubt it is disappointing to be reporting a second consecutive financial deficit…Fundamentally, our finances have been impacted by the fixed nature of the majority of our central funding and the fact the growth of the business has not kept up with the rate of inflation…”
Positive Highlights from Gloucestershire Annual Report
Hosting England v Ireland (Men), Hosting Women’s Ashes ODI
Second fastest growth of any county in terms of ticket sales (although it still fell short of expectations)
Cheltenham Cricket Festival
Sponsorship and BS7 Gym
Financial Concerns for Gloucestershire County Cricket Club
Assessment: Things are not looking that great for Hampshire, who are on the verge of becoming one of the first County teams to sell shares to IPL team owners.
Year
2022
2021
Annual Total
– £ 1,346,883
– £ 1,535,292
Total Reserves
+ £ 2,440,783
+ £ 3,787,666
Group Strategic Report Summary
“The Group will look to consolidate its position as a leading leisure destination and international cricket stadium, although the Directors anticipate that a return to significant levels of profitability is unlikely in 2023 and 2024 given the poor allocation of international cricket in this period.”
Positive Highlights from Hampshire’s Annual Report
Hotel and events saw a rise in operating profit
Men’s Ashes in 2027, Women’s Ashes in 2031
Financial Concerns for Hampshire County Cricket Club
Net debt at 31st December, 2022 is approximately £ 61,423,363.
Assessment: Despite an Ashes season, Yorkshire reported devastating losses in 2023. Financial (and social) overhaul is required at Yorkshire.
Yorkshire’s 2-Year Profit/Loss
Year
2023
2022
Annual Total
– £ 7,050,776
– £ 2,169,332
Total Reserves
– £ 9,106,154
– £ 2,054,488
Chair’s Statement Summary
“The 2023 financial statements presented to you are very clear—it was an Ashes year for us, which should have been productive and profitable, but in the event there was a huge trading loss for the Club. The reasons behind this are explained throughout the financial statements but 2023 was definitely Yorkshire’s ANNUS HORRIBILIS!“
“The Hundred continues to generate significant income for the Club.”
Positive Highlights from Yorkshire’s Annual Report
Hosted Ashes at Headingley (provided £ 18.2 million revenue)
Membership numbers increased
New investment to come in
To host Men’s Test again India in 2025 along with some other T20Is
“The conversations around the Hundred are potentially extremely beneficial for us”
Vitality Blast sales increased 14%
Financial Concerns for Yorkshire County Cricket Club
More staffing in the executive team
Cost of running a stadium
Rising Interest rates
Cricket Disciplinary Committee investigation, legal and professional fees, settlement of employment claims, governance, EDI plans, etc.
No major capital investment
Restructuring of County Age Group pathway
Hosting and Administrative costs for Ashes
“It should be noted, however, that the costs of hosting the match, which include a staging fee payable to the ECB, stewarding and security, and the cost of delivering hospitality packages, were proportionally higher too, totalling £ 3.3 m.”
19. Bonus: Marylebone Cricket Club, The MCC (£ 7.7 Million Profit)
Financial Health Status:Green
Assessment: The MCC are doing really great at the moment on all accounts.
Year
2023
2022
Annual Total
+ £ 7,735,000
+ £ 2,849,000
Total Reserves
+ £ 82,916,000
+ £ 75,181,000
MCC Committee Report Summary
“We continue to evaluate the potential to own and manage a Hundred franchise based at Lord’s. It is anticipated that the ECB will put in place a new financial model from the start of the 2025 season and subject to more detail on the structure and economics of the tournament, we believe that owning a Hundred franchise could have a positive impact on all four of the Club’s objectives
“On the commercial side, income surpassed previous records across Retails, Tours of Lord’s, the Indoor Cricket Centre, Marketing and Advertising, Events and Experiences, shown within Catering and Hospitality, whilst performing strongly, was around 10% lower than the record World Cup year of 2019.”
Other Positive Highlights from MCC’s Annual Report
Lord’s Test, Women’s T20I, and the Hundred saw 500,000 spectators at Lord’s
Financial Concerns for the MCC
High Inflation, rising Employment Costs, rising energy costs
In the past five years, the ECB have made strides to bring financial stability and increase their standards in Test cricket (after success in the white ball game).
It is evident with Yorkshire and Hampshire, for example, that things need to change. However, we also found that not all County teams are struggling. In fact, a majority are doing just fine and many of them have bounced back from the days of the pandemic.
With the IPL increasing its influence around the world, international schedule tightening, number of freelance players increasing towards the growing franchise leagues, County cricket and ‘traditional’ old school cricket is definitely under threat.
Will ECB’s new financial model change things up for the better or the worse? Will it help all the Counties or only some?
Only time will tell.
What do you think? Let me know below!
Thanks for reading. Hope you enjoyed reading this and learned something new. Cheers!
****
Financial Glossary
Here are some of the definitions of terms we have used in the analysis above. The definitions are derived from various sources like Investopedia.
EBIDTA: Earnings before interest, taxation, depreciation, and amortization
Fair Value Reserve: Represents cumulative revalution gains and losses in respect of historic investment properties.
Operating Profit: Total earning from its core business functions for a given period. An operating loss occurs when core business income ends up being lower than expenses.
Total Comprehensive Income: Includes net income and unrealized income (ex: hedge/derivative financial instruments, transaction gains, etc.)
Also Read
If you liked this in-depth research article, you may also like the following articles:
This will help us provide an insight into the workings of the ICC and help us answer questions like:
How much does it cost the ICC to host a World Cup?
How much revenue does the ICC make from global tournaments?
Why has there been a recent influx in World Cups?
I read this 39 page document so you don’t have to.
Let me break it down for you.
Key Takeaways
The ICC earned about 95.59% of their annual revenue from ICC events in 2022 ($412,862,000 out of $431,929,000). In 2021, ICC events contributed to 93.38% of their annual income ($432,146,000 out of 462,767,000).
On the flip side, ICC events contributed the organization 75.27% of their expenditures in 2022 ($168,262,000 out of $223,554,000) and only 70.37% in 2021 ($96,510,000 out of $137,160,000).
The ICC has been profitable with total comprehensive income of $208,375,000 in 2022 and $325,607,000 in 2021 respectively. Adding prior years surplus and general reserves, ICC had a total surplus of $912,999,000 as of 31st December, 2022.
In 2021-2022, senior Men’s ICC tournaments added a profit (+ $602,968,000) to the ICC, while senior Women’s ICC tournaments (– $15,160,000) and U-19 ICC tournaments for both men & women combined (– $7,011,011) led to losses.
The ‘Advance to Full Members’ was $693,331,000 in 2022 and $513,331,000 in 2022 & 2021 respectively, while ‘Advance Allocated to Associate Member’s was $89,716,000 and $66,275,000 in the same period.
Total Revenue Generated from ‘Commercial’ ICC Events (2021-2022)
Now we look at the 2021-2022 tournament breakdown.
ICC Event
Revenue
Expenses
Total Income
2021 World Test Championship (WTC) Final
$36,318,000
$12,469,000
+ $23,849,000
2021 T20 World Cup (Men’s)
$383,624,000
$65,699,000
+ $317,925,000
2022 U19 World Cup (Men’s)
$13,822,000
$19,028,000
– $5,206,000
2022 ODI World Cup (Women’s)
$24,316,000
$35,025,000
– $10,709,000
2022 T20 World Cup (Men’s)
$354,795,000
$84,589,000
+ $270,206,000
Value in Kind* (2021)
$12,204,000
$12,204,000
$0
Value in Kind (2022)
$19,929,000
$19,929,000
$0
Total
+ $845,008,000
– $248,943,000
+ 596,065,000
*Definition in the glossary at the bottom of the article
This table reveals quite a bit of information. What have we learned here?
The ICC takes a hit financially while hosting the Women’s World Cup and U-19 World Cups.
The 2021 ICC Men’s T20 World Cup was the most profitable tournament for the ICC in the last couple of years.
It would be interesting to see how much the 2023 Men’s ODI World Cup earned when the next round of financials come out.
Total Revenue Generated from ‘Pathway’ ICC Events (2021-2022)
But wait, there is more.
ICC also helps fund the global and regional tournaments. They are not considered ‘commercial’ events.
ICC Event
Expenses
2021 ODI World Cup Qualifier (Women’s)
$2,208,000
2021 T20 World Cup Regional Qualifiers (Women’s)
$1,518,000
2021 T20 World Cup Regional Qualifiers (Men’s)
$1,794,000
2021 CWC League 2 (Men’s)
$314,000
2022 Women’s Championship
$30,000
2022 Commonwealth Games Qualifier (Women’s)
$257,000
2022 T20 World Cup Regional Qualifiers (Women’s)
$695,000
2022 U19 T20 World Cup Qualifier (Women’s)
$828,000
2022 U19 World Cup Qualifier (Men’s)
$977,000
2022 T20 World Cup Qualifier (Men’s)
$1,138,000
2022 CWC Challenge League (Men’s)
$1,549,000
2022 T20 Regional’s Qualifier’s (Men’s)
$1,902,000
2022 CWC League 2 (Men’s)
$2,315,000
Total
– $15,525,000
We can clearly see that these pathway tournaments do not earn ICC big profits.
In essence, they virtually treat these global and regional qualifiers as investments for the growth of the game.
Long Term View: How Has Net Income from ICC Tournament’s Changed Over the Years?
Have you wondered why we have had an influx of ICC tournaments in recent times?
Let’s jog back our memories. In men’s senior tournaments alone, we have had:
2024 T20 World Cup
2023 ODI World Cup
2023 World Test Championship Final
2022 T20 World Cup
2021 T20 World Cup
2021 World Test Championship Final
2019 ODI World Cup
The clear and simple answer is: ICC tournaments (especially senior men’s tournaments) contribute majority of the earnings to the ICC.
We can see from this chart, that there were peaks during 2007, 2011, 2015, and 2019, when the Men’s ODI World Cup took place (2007 had both the ODI and the T20 World Cup in the same year).
Even though the ODI format has received criticism in recent times, it is here to stay as the ODI World Cup generates a lot of wealth for the ICC (both the 2017 ODI Women’s World Cup and the Champions Trophy did very well financially).
On the other hand, we can see that the ICC took a hit in 2008 & 2018, two years when no major men’s ICC tournament took place. 2020 was an aberration due to the COVID, but the +$384,000 they did earn was due to the profitability of the Women’s T20 World Cup that broke barriers.
Why Did the ODI World Cup Shrink to 10 Teams?
According to this chart from ICC’s 2007/08 Annual Report, we can see that most of ICC’s money comes from these events. Even in 2007, ICC earned 93.66% of their revenue through events. Most of their costs are distribution of funds to the Members.
If cricket is to grow around the world, the ICC needs to be profitable year after year.
And here lies the double-edged sword of running an international sporting organization. We have often criticized the ICC for shrinking the participation in ODI World Cups, skewed formatting, and India-Pakistan games scheduled for the sole reason of financial gain.
But that profit is necessary for them to invest in the women’s game, U-19 cricket, and regional tournaments around the world because these tournaments provide no financial incentives.
In simple terms—the more money ICC earns from men’s tournaments, the more they can distribute to their members (How that distribution occurs is a deep dive for another day).
****
What do you all think? Is there a better solution for ICC to increase their profits than shoving multiple ICC tournaments in a short period of time?
Thanks for reading! Here is some bonus content for you cause I felt like it today.
Other Observations: ICC World Cup Costs in the Earlier Days
Cricket tournaments have become more professional over the years.
Now it takes multi-million dollars to host an ICC event which includes breakthrough commercial deals. Only a couple of decades ago, it did not take as much money to host a world tournament (and the inflation was lower).
Total Comprehensive Income: “Comprehensive income is the sum of a company’s net income, as recorded on their income statement, and unrealized income (or ‘other comprehensive income’).”
Value in Kind: “Sponsorship received in forms of goods and/or services rather than money.”
Let’s discuss the most valuable IPL cricketers—with a twist.
In the 17 years of the Indian Premier League (IPL), which batter has provided the best return on investment in terms of hitting sixes? The #1 batter on this list may surprise you!
Let’s find out.
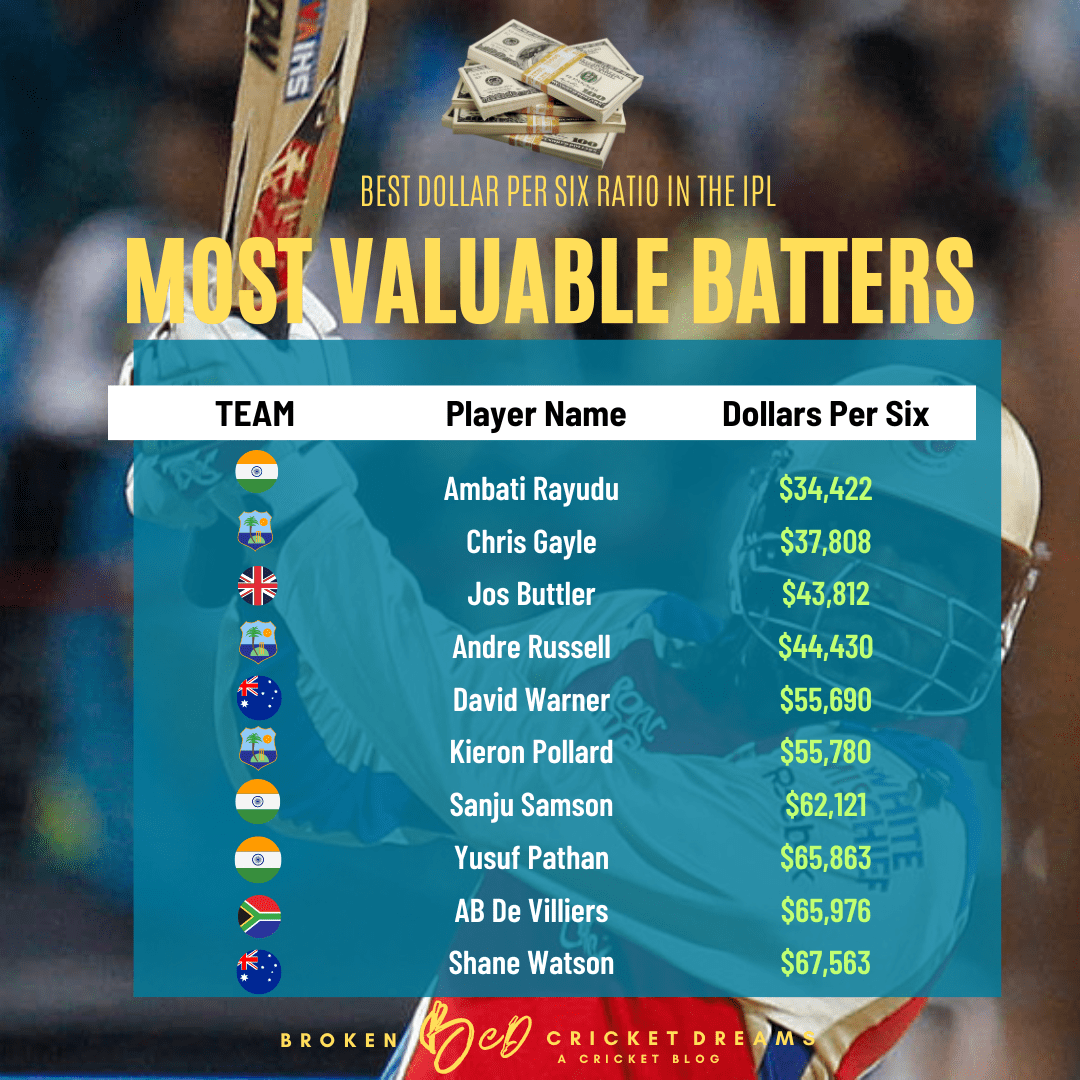
Key Takeaways
Chris Gayle (357), Rohit Sharma (257), AB De Villiers (251), MS Dhoni (239), and Virat Kohli (234) have hit the most sixes in the IPL.
Ambati Rayudu ($34,442), Chris Gayle ($37,808), Jos Buttler ($43,812), and Andre Russell ($45,430) have the best ratios of dollar per six in IPL history, while Rohit Sharma ($116,381), MS Dhoni ($119,280), and Virat Kohli ($120,470) have been the most expensive buys per six in this list.
Andre Russell is just a beast in the frequency of sixes he hits. He takes approximately 6.74 balls per six, that is almost one per over! Russell is comfortably ahead of the other two West Indians on this list—Chris Gayle (9.34), Kieron Pollard (10.39) who are then followed by AB de Villiers (13.56), Yusuf Pathan (14.18), Jos Buttler (14.58), and Shane Watson (14.78).
Chris Gayle (2.53), KL Rahul (1.54), and AB De Villiers (1.48) have the best ratio for the most sixes per innings.
Most Sixes in IPL Career
To begin our analysis, here is the list of players with the most number of sixes hit in the IPL.
Player
Innings
Sixes
Chris Gayle
142
357
Rohit Sharma
143
257
AB de Villiers
170
251
MS Dhoni
218
239
Virat Kohli
229
234
David Warner
176
226
Kieron Pollard
171
223
Suresh Raina
200
203
Andre Russell
96
193
Shane Watson
141
190
Sanju Samson
148
182
Robin Uthappa
197
182
Ambati Rayudu
187
173
KL Rahul
109
168
Glenn Maxwell
120
158
Yusuf Pathan
154
158
Jos Buttler
95
149
Yuvraj Singh
126
149
Shikhar Dhawan
218
148
Honorable Mentions: Faf du Plessis – 145, Dinesh Karthik – 139, Nitish Rana – 131, and Brendon McCullum – 130 miss out).
Top 19 Most Valuable Six Hitters in the Indian Premier League (IPL)
*Note: We have limited our analysis to the top 19 six hitters in the IPL (cutoff of 148 sixes).
Ambati Rayudu may probably be one of the steals of the IPL auctions!
Because Rayudu was an uncapped player for early part of his IPL career, his IPL salary was comparatively low to his contemporaries. He was a clutch player for both MI & CSK over the years and was worth every penny.
However, take this list with a grain of salt. The fact that Rohit Sharma, MS Dhoni, and Virat Kohli end at the bottom of the list is due to the fact that they were retained almost every time. We are only comparing dollars per six here, but these three provided their IPL franchises a lot more value—Leadership, Fours, Runs, Orange Caps, IPL Titles, brand value, fan loyalty, match winning performances, and much more.
Thanks for reading, until next time.
Please do share ahead with your cricket loving friends!
 (400 x 100 px) (4)")