(400 x 100 px) (4)")
Alternative World Test Championship Points Table: Australia Should Be In the World Test Championship Final & I Have The Data To Prove It
Time to reveal the results from my most substantial project of the year—Alternative World Test Championship Points Table. Consider this my thesis as a culmination of work that has taken almost a year to put in place.
On July 29, 2020, my friend and I proposed how To Fix the WTC Points Table? At that point, the idea was to expose the problems of the current WTC system and propose how an alternative points table could be constructed.
Fast forward eleven months — after analyzing each of the 23 WTC series & 58 scorecards inside & out, converting our proposal into a tangible algorithm, and programming it in R language, we have finally put the algorithm in action.
Here is the revelation: Australia should have been in that WTC Final later this week against India, and I now have the data to prove it.
*Disclaimer: Don’t get me wrong here. This article is not meant as a commentary on the New Zealand Cricket Team. The Kiwis have done a fantastic job over the past five-six years or so. Rather, this article is meant to expose the flaws in the World Test Championship Points Table and compare how a better-developed points table would have looked like.
Table of Contents
- Before We Get Started
- Alternative World Test Championship Points Table
- Background
- Proposal for the Alternative World Test Championship Points Table
- The Algorithm
- Observations: Which Team Won the Most Sessions?
- Debunking The Myth
- Series Illustration
- Data Collection Process
- Conclusion
- What Cricketers & Commentators Say About the WTC Format
- Appendix
- Alternative World Test Championship Points Table Team-By Team Data
- Alternative World Test Championship Points Table Series-By-Series Comparison
Before We Get Started
Alright here we go. Here is how this article structure is going to work:
- First we are going to display our results right away— Original vs Alternative WTC Points Table side by side. Then, we
- Review the problems in the original system and restate the key motivations
- Lay out the Proposal & Algorithm
- Display interesting observations and debunk a myth
- Illustrate the power of the alternative point system’s through series analysis— The Ashes, England vs West Indies/Pakistan, the Border-Gavaskar Trophy, New Zealand-Pakistan, & West Indies-Sri Lanka
- Explain the process of collecting data & issues encountered
- Finally go over implications of our proposal.
Notes:
- The detailed result (team-by-team & series-by-series data) is displayed in the colorful Appendix Section at the bottom of the article for your kind reference.
- Here are some abbreviations to keep in mind:
- H/A: Home/Away
- W/T/L: Won/Tied/Lost
- RR: Run-rate
- Australia (AUS), Bangladesh (BAN), England (ENG), India (IND), New Zealand (NZ), Pakistan (PAK), South Africa (SA), Sri Lanka (SL), West Indies (WI)
Alternative World Test Championship Points Table
Facts
Before we get into the Points Table, here are the facts of how each team performed. Pay special attention to the home and away.
| Team | Matches (Away/Home) | W (Away/Home) | L (Away/Home) | D (Away/Home) |
| India | 17 (8 A, 9 H) | 12 (4 A, 8 H) | 4 (3 A, 1 H) | 1 (1 A, 0 H) |
| Australia | 14 (5 A, 9 H) | 8 (2 A, 6 H) | 4 (2 A, 2 H) | 2 (1 A, 1 H) |
| New Zealand | 11 (5 A, 6 H) | 7 (1 A, 6 H) | 4 (4 A, 0 H) | 0 |
| England | 21 (10 A, 11 H) | 11 (6 A, 5 H) | 7 (4 A, 3 H) | 3 (0 A, 3 H) |
| Pakistan | 12 (7 A, 5 H) | 4 (0 A, 4 H) | 5 (5 A, 0 H) | 3 (2 A, 1 H) |
| Sri Lanka | 12 (6 A, 6 H) | 2 (0 A, 2 H) | 6 (3 A, 3 H) | 4 (3 A,1 H) |
| West Indies | 11 (7 A, 4 H) * | 3 (3 A, 0 H) | 6 (4 A, 2 H) | 2 (0 A, 2 H) |
| South Africa | 11 (5 A, 6 H) | 3 (0 A, 3 H) | 8 (5 A, 3 H) | 0 |
| Bangladesh | 7 (5 A, 2 H) | 0 | 6 (4 A, 2 H) | 1 (1 A, 0 H) |
*The analysis is before the ongoing West Indies-South Africa series, which is another pointless concept. Why is a World Test Championship group stage game scheduled the same time as the WTC Final?
Alternative Vs Original WTC Points Table
The next table is listed in order of the Alternative WTC Points Table (With this ranking, India & Australia would have met at the WTC final later this week).
In comparison, the original rank is shown in the final column. Rankings for India (most stable team), England/Pakistan (most mediocre), & Bangladesh (worst/did not play as much) are the same, but the rest of the alternative rankings are different compared to the original.
The third and fourth column compares the percentage according to the alternative world test championship points table algorithm versus original WTC percentage. In general, the current WTC inflates how the teams were in real-life. The top teams were really not as good as the numbers suggests and vice-versa with the bottom teams.
We will describe how we got to the “Total Points” and “Points Possible” in the next two sections. (If you are curious about total points for every series per team, feel free to scroll to the Appendix at the bottom of the article).
| Team | Total Points | Points Possible | Alternative Percentage | Original Percentage | Original Rank |
| India | 551 | 846 | 65.13% | 72.2% | 1 |
| Australia | 414 | 684 | 60.52% | 69.2% | 3 |
| New Zealand | 312 | 546 | 57.14% | 70.0% | 2 |
| England | 564 | 1026 | 53.92% | 61.4% | 4 |
| Pakistan | 280 | 608 | 46.05% | 43.3% | 5 |
| Sri Lanka | 242 | 600 | 40.03% | 27.8% | 8 |
| West Indies | 217 | 562 | 39.74 % | 33.3% | 6 |
| South Africa | 181 | 530 | 32.97% | 30.0% | 7 |
| Bangladesh | 72 | 362 | 19.34% | 4.8% | 9 |
*Sure Australia would have reached t
he WTC Finals if not for the -4 over-rate deduction in Melbourne vs India or if they had not cancelled their South Africa visit, but our Alternative algorithm displays this claim convincingly.
Background
Our Alternative World Test Championship Points Table fixes several of the problems encountered in the current system, a system dominated by the Big 3—India, Australia, & England.
Our proposal would work even better in an ideal balanced world where the problems listed below have been fixed.
The Problems
The ICC has already stated that in the next iteration, all Test matches will carry same points weightage. While that is definitely a step in the right direction, it is not nearly not enough.
- Number of points fluctuate depending on # of games per series: A 2-match series is allotted 60 points per game, while 3, 4, and 5 match-series are awarded 40, 30, and 24 points respectively. This is totally absurd.
- Number of Tests Played is uneven: In this WTC cycle, England played 21 Tests, while West Indies, South Africa, and New Zealand played 11 each. Marquee series like Ashes, Border-Gavaskar, Basil D’Oliveira Trophy, etc. are 4-5 Tests each while SL & NZ only play 2 Tests regularly.
- Currently no distinction is made for Home/Away advantage: West Indies winning in Bangladesh, India winning in Australia, or Australia drawing in England should be worth more than home wins.
- All-or-Nothing System: Test matches occur over 5 days or a max-of-15 sessions. One session can have a huge impact on the series. Yet, the points are awarded on an all-or-nothing basis.
- Relegation-Promotion Needed: This WTC cycle exposed the gap between the top 4 teams and the rest of the table. The World Test Championship was supposed to provide context for Test cricket, especially for the lower-ranked teams. It has done just the opposite.
Proposal for the Alternative World Test Championship Points Table
The Goal
Our goal was to avoid the two spectrums of Simplicity vs Complexity. While the current WTC Points Table is simple, it does not do a good job at incorporating the numerous factors of a Test match.
On the other hand, we wanted to avoid a complicated system like Duckworth-Lewis-Stern or the ICC’s Rankings systems, that is barely understood even by the experts of the game.
The Proposal
We proposed a two-tiered system that incorporates (1) Session-by-session data and (2) Home/Away advantage. The proposal answered three specific questions:
Question 1: Why does the Losing Team in a 5-day Match Get 0 Points?
A Test match is long. After almost 40 hours of hard-fought battle, there is no way that a Fawad Alam-inspired Pakistan team that comes so close to a 5th day draw should receive 0 points only due to a Mitchell Santner jumping catch?
The beauty of a Test match is in its ebbs and flows, twists & turns.
A Stuart Broad spell, a Vihari-Ashwin blockathon, a Jermaine Blackwood-style counter-attack, or a Stokes-Pant-Myers/Bonner fourth innings special can change a match. There are periods where wickets are falling right and left, bowls just beating the edge. Oohs and ahhs. Later, the story might change with periods of fast run-scoring, counter-attacks, flat pitches, etc.
So how can we incorporate these moments into data?
Resolution 1: Session-by-Session Points
We first award points based on the number of sessions a team wins/ties/loses.
Since each day has 3 sessions, there is a maximum of 15 sessions possible in a Test. Since winning a session is awarded 2 points, the maximum session points possible is 30 (15*2).
| Session | Points |
| Won | 2 |
| Tied/Even (or Washed Out/ Bad Light) | 1 |
| Lost | 0 |
Question 2: How Can We Incorporate Home/Away Points?
This was the most popular concern and rightly so. It has always been tougher to win overseas Tests and the last decade has made it even more lopsided. Here is the fix. On top of the session-by-session data we add a:
Resolution 2: Fixed points system for Home and Away matches.
Combining resolution 1 & resolution 2, we get the total points available per Test match in the last column.
| Points | Win | Draw | Loss | Maximum Points Possible (Per Match) |
| Home | 16 | 8 | 0 | 46 |
| Away | 24 | 12 | 0 | 54 |
| Average | 20 | 10 | 0 | 50 |
*If the WTC cycle is scheduled with equal number of home and away games, for this portion we get an average of exactly 20 points for wins & 10 points for a draw. In total (with +30 from session points), it averages out to be 50 points per game.
Question 3: Is There An Equivalent of Net-Run Rate for Test Cricket?
In a Test match, how can we measure the magnitude of victory or defeat?
The ODI Super League at least has the Net Run Rate factor to signify how big a defeat or victory was. There is no such data in the current WTC Points Table. A 1-run victory achieved on the 5th day and an innings victory in a 2-day Test is worth the exact same.
Resolution 3: Bonus — Winning team is rewarded remaining sessions if match finishes early
When a team usually wins by an innings (or more than 100 runs, or with 8-10 wickets in hand for that matter), usually several sessions/days are still left.
Hence, the winning team is awarded the remaining session-by-session points (2* # of remaining sessions). This will incentivize teams on the edge to fight harder and take the game deeper even if they are on the verge of losing. On the other hand, it can convince captains to go for bold declarations in order to win earlier.
The Algorithm
In order to remove any semblance of subjectivity, we created the following algorithm to determine W/T/L for a session.
Here is the specific criteria along with the reasons as to why we added that part.
Sessions
- If (0 overs are bowled – washed out session) OR if (RR >= 4 AND wickets >= 4)*
- Session is tied and both teams get 1 point each
- If (only 1 wicket falls) OR (RR >= 3.5 AND wickets <=3) OR (RR <= 2 AND Wickets <=2)
- Batting team wins session and receives 2 points
- Reason: If wickets are preserved and run-rates are decent, then the batting team should be rewarded. In some contexts like the first session of a Test match, even if the run-rate is slow, the batting team should be rewarded if only 2 or less wickets fall.
- If 4 or more wickets fall OR (RR <= 2) OR (Wickets >= 4 AND RR >= 3.5)
- Bowling teams wins session and receives 2 points
- Reason: If the bowling team is disciplined and restricts the run-rate to a minimal or if they take more than 4 wickets in certain conditions, they should be rewarded.
- Any other case
- Tied Session; Both teams get 1 point each
*Special thanks to Vandit for co-creating this algorithm and working through the entire WTC process with me.
The Stokes-Pant-Bonner/Myers Outlier
*One may ask why did we need (RR>= 4 AND wickets >= 4) section? Usually the bowling team should be rewarded when a heap of wickets fall, but this session is what I like to call the Stokes-Pant-Bonner/Myers Outlier.
On paper, 5 wickets in a session would definitely be a bowler’s session, but as a viewer, we know 124 runs at a run-rate of 4.22 due to Stokes’ brilliance should at least be a tied session.
This just one of the few examples which helped us tweak our algorithm to align with real-life events.
Also comment below with out thoughts on this Alternative World Test Championship Table!
COPYRIGHT @Nitesh Mathur, aka Nit-X, 06/14/2021; Email at bcd@brokencricketdreams.com
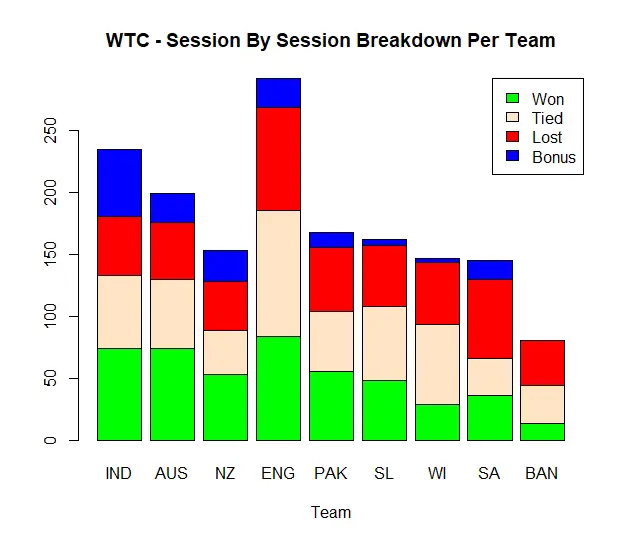
Observations: Which Team Won the Most Sessions?
Now to the fun part—the analysis. After we applied the above algorithm to all the Test matches, here are some fascinating things we observed.
Observation 1: What Sets India Apart?
If we look at the sessions graph below, not much sets India and Australia apart. In fact, both Australia and India won exactly 74 session each. Sessions tied (IND 59-56 AUS) and sessions lost (IND 48-46 AUS) are pretty close as well.
What put India to another level is an additional 108 Bonus Points. Altogether, India won by 54 sessions to spare – that is 18 days of Test cricket! Australia, in comparison, received 46 bonus points (23 sessions to spare).
Our algorithm rewarded India due to the fact that they won their WTC Test matches more convincingly than any other team (Well, it helped that at home, India played Bangladesh, a weak SA team, and an English team that was rolled over in 2-day Tests, but that is another story).
It is interesting that although Australia crushed Pakistan & New Zealand at home and blew India apart with that 36 All-Out, the last three Test matches in the BGT cost them important bonus points.
Observation 2: England Won, Tied, and Lost the Most sessions
England won 84 sessions, tied 102 sessions, and lost 83 sessions—the most for any team is all three categories. England play the most Test matches, which ended up biting them in the backside.
They won three overseas Tests against South Africa and two against an Embuldeniya inspired-Sri Lanka, two of the hardest touring venues in cricket (even though they are both in an extended transition zone). England also lost 7 matches, 3 at home (Australia, West Indies) and four abroad, the final three coming in the India series, where they lost by huge margins.
Tip of the Day: If England keep playing more Test cricket, it will increase their likelihood of losing more games, thereby reducing their chances to go to future WTC finals. Hence, it is in England’s own best interest to vouch for equal number of games (home & away) for every team in a WTC cycle.
Observation 3: The Importance of Draws
One of the stark differences between the original WTC Points Table and our table was Sri Lanka’s ranking. In the original ranking system, SL ranked 8th (27.8%) as opposed to our table, in which SL ranked 6th (40.03%).
Lanka actually drew most Tests than any other team (4), and 3 of them away. An away draw might be regarded higher than certain home wins.
Our Home/Away weightage boosted them right behind Pakistan, who are comparable in the graph below. One thing is clear—there is no way SA should have leapfrogged SL. SA lost more sessions, won/tied way less sessions than Sri Lanka, and their only wins were at home (3 wins compared to SL’s 2). Not even a draw abroad.
Unforeseen Effect of New Algorithm: Our algorithm helped the lower-ranked teams. If the Relegation-Promotion system was put in place, Pakistan (46.05%), Sri Lanka (40.03%), & West Indies (39.74%) would be in a heated battle rather than not having no context for lower-ranked teams. Even Bangladesh, which was at 4.8% in the original WTC Points table is at 19.34%, due to some flat roads in Sri Lanka.
Observation 4: The Moeen Ali Anomaly
Usually the team that wins the Test ends up winning the last session of the game. This was not the case in the 2nd Test of the India-England series.
Lunch at Day 4 – England were 116/7 in 48. 3 overs in a chase of 482 runs. Post-lunch, India would have expected to easily wrap up a 350+ run victory, but Moeen Ali had other plans.
Sent in at #9 (really #9, England team management?), Ali blitzed 43 (18) with 5 sixes and 3 fours. England scored 48 runs for 3 wickets at about 8.7 RR and won that final session, despite losing the Test by 317 runs.
Little did they know this would be their final shining light as they were systematically dismantled by Axar Patel for the final two Tests.
Observation 5: Pakistan Had It Rough
Pakistan played the second-least amount of games at home (5) after the West Indies and had away series in Australia, England, and New Zealand.
That schedule is asking for trouble.
Even though they competed admirably in England & New Zealand, one bad series in Australia ruined their figures. What’s more? Their series in Zimbabwe did not even count.
Still ended up at #5 in both the tables – the best of the 2nd half of the table.
Debunking The Myth
The Myth: NZ Got An Unfair Entry In the WTC Final Due to Home Games
New Zealand has received a lot of criticism that they loaded the points at home and hence jumped through the top.
Actually, England (11), Australia (9), India (9) had more designated home games, while Sri Lanka (6) & South Africa (6) had the same. On the other hand, New Zealand played the same of away games as Australia, South Africa, and Bangladesh had the same number of away games, five each.
Both NZ & SA played the exact same number of games (same home/away as well), and both places are tough touring destinations as well. The fact that NZ took advantage of their conditions speaks to their ability rather than pure luck. Otherwise, SA would have been right there up with NZ instead of languishing at the bottom of the table.
Oh yeah and also New Zealand played both home & away 2-Test series against England during this period, neither of which counted towards the WTC. They won 1-0 both of them each. (Another reason why FTP & the WTC should merge. Every game should count)
Series Illustration
We now illustrate the algorithm by comparing the Actual Series Total against the Alternative BCD (Broken Cricket Dreams) Series Total.
Ashes 2019
Actual Series Total: England 56-56 Australia
Alternative BCD Series Total: England 113-137 Australia
What do you recall from the 2019 Ashes? Steve Smith’s godly tour, David Warner’s Stuart Broad misery, Stokes’ Headingly conquest, Leach’s glasses, Tim Paine’s review & Nathan Lyon’s missed run-out, Marnus Labuschagne’s concussion-substitute surprise introduction, Jofra Archer’s brilliance?
Ashes of the ages. As close as it gets. At the face of it, 56-56 looks like a decent result but let us dig a little deeper. Australia won 2 away matches, drew 1 match, and barely lost Headingly.
Ask yourself, did Australia deserve to get 0 points for the hard-fought Headingly Test? Oh yeah, and if you forgot, England were also bowled out for 67 in the first innings, another example where sessions can change the complexion of a match.
Altogether, 25 sessions were tied, Australia won 25, and England won 17. However, England won with a total of 7 sessions to spare in the series compared to Australia’s 2, which ensured they received more bonus points. Hence, the 137-113 was a better indicator of the competitive Ashes than the 56-56.
England Post-COVID
Actual Series Total: England 80-40 West Indies, England 66-26 Pakistan
Alternative BCD Series Total: England 87-61 West Indies, England 75-71 Pakistan
We should all be grateful to England, West Indies, Pakistan, & Ireland to get cricket started again post the initial COVID lockdown.
The matches in these two series were closer than they appear.
Jermaine Blackwood-led successful overseas chase in the first Test, Kemar Roach’s brilliance & #1 Test all-rounder Jason Holder were especially spectacular. Although West Indies fizzled out at the end, they were in the series for the most part. When they were not taking wickets, they kept the opposition’s run-rate down and tied most sessions. WI winning an away Test and being competitive throughout made it a 87-61 series.
Pakistan’s series was statistically even more interesting. In the last two Tests, Pakistan earned two away draws courtesy rain-affected games, so we should analyze the first Test by itself. If you remember, this was Shan Masood’s epic 156, where he almost carried the bat. Although Pakistan collapsed as usual towards the end and lost, the fact that they batted for the first five sessions of the game and won more sessions than England (7-W, 1-T, 4 L) gave them a series total of 75-71.
Super close without actually winning a single game.
Border-Gavaskar Trophy
Actual Series Total: Australia 40-70 India (36-70 with over-rate deduction)
Alternative BCD Series Total: Australia 91-113 India
Here is a thought experiment—Imagine if Rishabh Pant had gotten out in the last session of Day 5 in the Gabba chase and Tim Paine’s prophecy would have come true. India would have been heartbroken and the current WTC Points Table would have switched to Australia 70-40 India.
A session here or there and Australia, barely scraping by at home, would have received the exact same number of points as opposed to the blood, sweat, & tears via Vihari-Ashwin fightback, Siraj’s leadership, Shardul-Shubman-Sundar-Pant’s youth, & Pujara’s toil.
Our algorithm encodes these little moments in the session-by-session data. India won 14 crucial sessions, Australia won 18, and 17 were tied. Australia benefitted from bonus points after they wrapped India up in one session at Adelaide with 36/9. Just like Australia were in the Ashes, India’s 2 away wins & a draw boosted them up.
You see, there is something for everybody.
(Oh and if you were wanting confirmation, if India had lost Gabba, our algorithm would have awarded Australia 107-89 India, which is still pretty close).
Also Read: Top 10 Life Lessons from the India Vs Australia Series, Series Review: The Greatest Story of Them All?
Pakistan-New Zealand
Actual Series Total: New Zealand 120-0 Pakistan
Alternative BCD Series Total: New Zealand 72-20 Pakistan
New Zealand steamrolled almost every opposition at home except for Pakistan.
In the first Test, Pakistan lost with just 4-overs to go. Digest that for a second. There are 450 possible overs to bowl in a Test match. Just 4 overs…
Pakistan stalled for 123.3 overs in the 4th innings due to the heroics of missing-in-action-kid-of-the-decade Fawad Alam, Azhar Ali, and the ever-dependable Mohammad Rizwan. Even in the second Test, Azhar Ali-Abid Ali-Faheem Ashram-Mohammad Rizwan won Pakistan some sessions.
What did Pakistan get for challenging New Zealand in their own backyards? Exactly 0 points.
Neither were Pakistan bad enough to 0 points or New Zealand so brilliant to hoard 120 points all by themselves.
West Indies- Sri Lanka
Actual Series Total: West Indies 40-40 Sri Lanka
Alternative BCD Series Total: West Indies 45-55 Sri Lanka
This was the only instance of every match of the series being drawn. The two-Test series ended with a 0-0 score line. A 40-40 is a fair result, but with two away draws, Sri Lanka nudges slightly above with 55-45 in the alternative world test championship table.
Data Collection Process
Motivation
Initially, we did this the old school way.
For the first 33 Test matches, we literally perused through the commentary and Match Notes section of the scorecard and manually decided which team won each session. Talk about tedious…
This was difficult for two reason: (1) It was hard to keep up after every Test match, and more importantly, (2) it was completely subjective.
In order to standardize the process of determining who won each session and remove any bias we had after watching the match, I decided to code our algorithm in R and re-do the process from scratch.
How Did We Get Our Data?
Before we could start implementing our proposal, we had to first get the data.
Our main data source was ESPN Cricinfo’s Match Results list for ICC World Test Championship, 2019-2021. As an input, I fed each scorecard individually into the program. The next step was to figure out how to get session-by-session data.
If you scroll to the bottom of the scorecard, there is a Match Notes section, which summarizes important moments at each interval of the match. The idea was to have our program read through these Match Notes and after preprocessing and removing the unnecessary characters, return data at “Lunch, “Tea”, “Innings Break”, and “End of Day.”
The important features to record at every interval were as follows: (1) Team Batting, (2) Runs, (3) Wickets, & (4) Overs. This data was stored in tables so all the data for lunch, tea, innings break, and end of day for all five days (or however long the Test match lasted) could be easily accessed.
Once the data was all nice and clean, things got a bit easier. At this point, we could compute the run-rate in each session and check if there was a switch of innings (all-out or declaration). Using this data, we could allocate points based on the proposal above.
We repeated this process for all the 58 matches and added up the points. Finally due to COVID*, we divided the total number attained by the total possible.
*Due to COVID-19 interruptions equal number of H/A games was not possible, so percentage was used.
Issues Faced
Initially I thought, reading data from a scorecard would be an easy task, right? Wrong. I was surprised by the inconsistency in some of the records.
For example, when a day is rained out, sometimes they will put: “Rain – 0/0, Lunch – 0/0, End of Day – 0/0.” Almost always, in a rained-out game, some of the sessions were missing which made it difficult to automate the program efficiently. Day/Night matches were especially hilarious. Instead of “Tea” & “Dinner”, in some games “Lunch” and Tea” were written. In others, it was a combination of all four!
A more subtle issue was when innings break occurred at the same time as an interval. In some occasions, Innings Break” and corresponding score was avoided, which caused our data table to have some missing values.
Anyway, you get the point. There were several other little issues, but I do not want to sound like a broken record. What this process influenced me to do confirm after every scorecard was read that all the data was stored correctly in the program.
Quality check.
Conclusion
The Alternative World Test Championship Points Table & the original table only had India (1), England (4), & Pakistan (5) in the same positions. Since our algorithm weighted away games more & took sessions in context, the rest of the rankings were different.
Is it the best algorithm? No, but it is definitely better than the current system by a landslide. I will continue to make improvements to this algorithm for the next iteration and apply this alternative system for the next cycle of the WTC.
Making Test cricket more equitable to all the cricket playing nations (and not just the Big 3) is definitely a challenge in the age of T20 leagues, but if huge financial restructure cannot happen, at least a change in the World Test Championship Points Table is a place to start.
In any case, end results are end results. No argument. Journey is the important part. We tend to ignore or forget the little pleasures in life by focusing on the end goal. Enjoy, smile, learn, & support each other.
My best wishes to India and New Zealand for the World Test Championship this week.
Before I end this, here are some thoughts by cricketers & commentators on the WTC Points Table.
What Cricketers & Commentators Say About the WTC Format
“I can’t quite work out how a five-match Ashes series can be worth the same as India playing Bangladesh for two Tests.”
– Stuart Broad
“This difference in value for winning a Test match I thought didn’t take into account the enormity of a contest, the toughness of the contest, and thought if I had to conceive a plan to get to the final of the World Test Championship, I would play 2 Test matches at home on pitches that I like.”
– Harsha Bhogle on disparity in the points system
“I think going forward, maybe the WTC could add context this way, two teams playing away from their home and sort of bringing the whole ebbs and flows of the game.”
– Ravichandran Ashwin on neutral series
“Ideally, in the long run, if they want to persist with the Test Championship, a best-of-three final will be ideal. As a culmination of two-and-a-half years of cricket around the globe.”
– Indian coach Ravi Shastri
So what did you think about this article and the Alternative World Test Championship Points Table? COMMENT BELOW with your opinions! Would love to engage!
Appendix
The team-by-team and series-by-series (at the very bottom) tables are presented below.
Alternative World Test Championship Points Table Team-By Team Data
*symbolizes Away series. An away series has a maximum possible of 54 points, while a Home series has a maximum of 46 points.
List of Teams
India
| India | Home/Away | Session | Bonus | Total | Matches | Total Possible |
| Vs WI* | 48 | 27 | 14 | 89 | 2 | 108 |
| Vs SA | 48 | 51 | 20 | 119 | 3 | 138 |
| Vs Ban | 32 | 26 | 28 | 86 | 2 | 92 |
| Vs NZ* | 0 | 16 | 0 | 16 | 2 | 108 |
| Vs Aus* | 60 | 45 | 8 | 113 | 4 | 216 |
| Vs Eng | 48 | 42 | 38 | 128 | 4 | 184 |
| 236 | 207 | 108 | 551 | 17 | 846 |
- (551/846)*100 = 65.13%
- Sessions: 74-59-48 (W-T-L)
Australia
| Australia | Home/Away | Session | Bonus | Total | Matches | Total Possible |
| Vs Eng* | 60 | 75 | 2 | 137 | 5 | 270 |
| Vs Pak | 32 | 28 | 12 | 72 | 2 | 92 |
| Vs NZ | 48 | 48 | 18 | 114 | 3 | 138 |
| Vs Ind | 24 | 53 | 14 | 91 | 4 | 184 |
| 164 | 204 | 46 | 414 | 14 | 684 |
- (414/684) * 100 = 60.53%
- Sessions: 74-56-46 (W-T-L)
New Zealand
| New Zealand | Bonus | Total | Matches | Total Possible |
| Vs SL* | 0 | 56 | 2 | 108 |
| Vs Aus* | 0 | 24 | 3 | 162 |
| Vs Ind | 24 | 76 | 2 | 92 |
| Vs WI | 20 | 84 | 2 | 92 |
| Vs Pak | 6 | 72 | 2 | 92 |
| 50 | 312 | 11 | 546 |
- (312/546)*100 = 57.14%
- Sessions: 53-36-39 (W-T-L)
England
| England | Home/Away | Session | Bonus | Total | Matches | Total Possible |
| Vs Aus | 40 | 59 | 14 | 113 | 5 | 230 |
| Vs SA* | 72 | 57 | 10 | 139 | 4 | 216 |
| Vs WI | 32 | 51 | 4 | 87 | 3 | 138 |
| Vs Pak | 32 | 37 | 6 | 75 | 3 | 138 |
| Vs SL* | 48 | 28 | 10 | 86 | 2 | 108 |
| Vs Ind* | 24 | 38 | 2 | 64 | 4 | 216 |
| 248 | 270 | 46 | 564 | 21 | 1046 |
- (54/1046)* 100 = 53.92%
- Sessions: 84-102-83 (W-T-L)
Pakistan
| Pakistan | Home/Away | Session | Bonus | Total | Matches | Total Possible |
| Vs Aus* | 0 | 20 | 0 | 20 | 2 | 108 |
| Vs SL | 24 | 29 | 4 | 57 | 2 | 92 |
| Vs Ban | 16 | 15 | 10 | 41 | 1 | 46 |
| Vs Eng* | 24 | 47 | 0 | 71 | 3 | 162 |
| Vs NZ* | 0 | 20 | 0 | 20 | 2 | 108 |
| Vs SA | 32 | 29 | 10 | 71 | 2 | 92 |
| 96 | 160 | 24 | 280 | 12 | 378 |
- (280/378) *100 = 46.05%
- Sessions: 56-48-52 (W-T-L)
Sri Lanka
| Sri Lanka | Home/Away | Session | Bonus | Total | Matches | Total Possible |
| Vs NZ | 16 | 22 | 6 | 44 | 2 | 92 |
| Vs Pak* | 12 | 27 | 0 | 39 | 2 | 108 |
| Vs SA* | 0 | 21 | 0 | 21 | 2 | 108 |
| Vs Eng | 0 | 22 | 0 | 22 | 2 | 92 |
| Vs WI* | 24 | 31 | 0 | 55 | 2 | 108 |
| Vs Ban | 24 | 33 | 4 | 61 | 2 | 92 |
| 76 | 156 | 10 | 242 | 12 | 325 |
- (242/600)*100 = 40.33%
- Sessions: 48-60-49 (W-L-T)
West Indies
| West Indies | Home/Away | Session | Bonus | Total | Matches | Total Possible |
| Vs Ind | 0 | 19 | 0 | 19 | 2 | 92 |
| Vs Eng* | 24 | 37 | 0 | 61 | 3 | 162 |
| Vs NZ* | 0 | 8 | 0 | 8 | 2 | 108 |
| Vs Ban* | 48 | 30 | 6 | 84 | 2 | 108 |
| Vs SL | 16 | 29 | 0 | 45 | 2 | 92 |
| 88 | 123 | 6 | 217 | 11 | 562 |
- (217/562)*100 = 39.74%
- Sessions: 29-65-50 (W-T-L)
South Africa
| South Africa | Home/Away | Session | Bonus | Total | Matches | Total Possible |
| Vs Ind* | 0 | 19 | 0 | 19 | 3 | 162 |
| Vs Eng | 16 | 45 | 8 | 69 | 4 | 184 |
| Vs SL | 32 | 17 | 22 | 71 | 2 | 92 |
| Vs Pak* | 0 | 21 | 0 | 21 | 2 | 108 |
| 48 | 102 | 30 | 180 | 11 | 546 |
- (180/546) = 32.97%
- Sessions: 36-30-64 (W-L-T)
Bangladesh
| Bangladesh | Home/Away | Session | Bonus | Total | Matches | Total Possible |
| Vs Ind* | 0 | 6 | 0 | 6 | 2 | 108 |
| Vs Pak* | 0 | 5 | 0 | 5 | 1 | 54 |
| Vs WI | 0 | 24 | 0 | 24 | 2 | 92 |
| Vs SL* | 12 | 23 | 0 | 35 | 2 | 108 |
| 12 | 58 | 0 | 70 | 7 | 270 |
- (70/270)*100 = 19.34%
- Sessions: 14-30-37 (W-L-T)
Alternative World Test Championship Points Table Series-By-Series Comparison
| Series (H Vs A) | Matches in Series | Result | Alternative Series Total | Original Series Total |
| England Vs Australia (The Ashes) | 5 | 2-2 | 137-113 | 56-56 |
| Sri Lanka Vs New Zealand | 2 | 1-1 | 44-56 | 60-60 |
| West Indies Vs India | 2 | 0-2 | 19-89 | 0-120 |
| India Vs South Africa (Freedom Trophy) | 3 | 3-0 | 119-19 | 120-0 |
| India Vs Bangladesh (Ganguly-Durjoy Trophy) | 2 | 2-0 | 86-8 | 120-0 |
| Australia Vs Pakistan | 2 | 2-0 | 72-20 | 120-0 |
| Pakistan Vs Sri Lanka | 2 | 1-0 | 57-39 | 80-20 |
| Australia Vs New Zealand (Trans-Tasman Trophy) | 3 | 3-0 | 114-24 | 120-0 |
| South Africa Vs England (Basil D’Oliveira) | 4 | 1-3 | 70-139 | 24-90 (*SA -6 for over-rate penalty in the 4th Test) |
| Pakistan Vs Bangladesh | 1 | 1-0 | 41-5 | 60-0 |
| New Zealand Vs India | 2 | 2-0 | 76-16 | 120-0 |
| England Vs West Indies (Wisden Trophy) | 3 | 2-1 | 87-61 | 80-40 |
| England Vs Pakistan | 3 | 1-0 | 75-71 | 66-26 |
| New Zealand Vs West Indies | 2 | 2-0 | 84-8 | 120-0 |
| Australia Vs India (Border-Gavaskar Trophy) | 4 | 1-2 | 113-91 | 36-70 (*Aus -4 for over-rate penalty in the 2nd Test) |
| New Zealand Vs Pakistan | 2 | 2-0 | 72-20 | 120-0 |
| South Africa VS Sri Lanka | 2 | 2-0 | 71-21 | 120-0 |
| Sri Lanka Vs England | 2 | 0-2 | 22-86 | 0-120 |
| Pakistan Vs South Africa | 2 | 2-0 | 71-21 | 120-0 |
| Bangladesh Vs West Indies | 2 | 0-2 | 24-84 | 0-120 |
| India Vs England (Anthony de Mello Trophy) | 4 | 1-3 | 128-64 | 90-30 |
| West Indies Vs Sri Lanka (Sobbers-Tissera Trophy) | 2 | 0-0 | 55-45 | 40-40 |
| Sri Lanka Vs Bangladesh | 2 | 1-0 | 61-35 | 80-20 |
*Note, we have not yet added the Sir Vivian Richards Trophy (West Indies Vs South Africa) since that is ongoing during the WTC Final.