Broken Cricket Dreams Cricket Blog Logo

How Would the World Test Championship Look Today (2024) if Away Wins Counted for More?

Four years ago I was really excited when the idea of the World Test Championship came out. I mean, it was partially a reason for me to start this blog.

And then I realized how lopsided the format was, the influence the Big 3 had on finances and scheduling, how expensive it was to host Tests, etc.

A part of me gave up hope.

However, with the recent overseas wins of NZ in India, SA in Bangladesh, and Bangladesh in Pakistan—that hope has rekindled.

Therefore, this is a good time for us to revisit the WTC alternative points table algorithm my friend and I had created four years ago to create a more balanced system. For this WTC cycle, I analyzed each of the 51 Test matches and 578 completed sessions one-by-one so you don’t have to.

Also Read: Alternative World Test Championship Points Table

World Test Championship – Algorithm Refresher

Before we start, he is a quick refresher on how our alternative points table worked.

Our WTC points table algorithm (1) distributes points on a session-by-session basis rather than an all-or-nothing system for a Test match, (2) includes Home/Away points for both wins & draws, and (3) includes a bonus to reward massive victories (Test match net run rate equivalent).

Points are calculated as follows:

  • 2 points per session won, 1 point per session Tied
    • There are 15 maximum sessions in a Test (3 sessions per day), so 30 points maximum per Test for the session-by-session category
    • The details of the algorithm used to decide who won each session is outlined in the original article and is left as an exercise to the reader.
  • Bonus: 2 * (Number of Sessions Remaining)
    • Example: If the Test finishes at the end of Day 4, the winning team would get 6 bonus points – (2 * (3 sessions remaining))
  • Home/Away
    • Away wins and away draws would be awarded more points.
    • 16 – Home Win, 8 – Home Draw
    • 24 – Away Win, 12 – Away Draw

The maximum points a team could earn per Test is outlined below (Example: 24 – away win points + 30 session points = 54 total if the team won all the sessions).

PointsWinDrawLossMaximum Points Possible
(Per Match)
Home168046
Away2412054
Average*2010050
Home & Away Points

Finally, since each team plays a different number of matches, we will take a percentage determined by (total points earned)/(maximum points possible*).

The maximum points possible will be determined by (number of matches played * 50), where we choose 50 because it is the average between 46 & 54 and would hence, weight away wins & draws more.

I coded this algorithm in R & Python and double checked the calculations by hand for the session-by-session analysis.

Key Takeaways

  • 45% (23/51) WTC matches in this cycle so far have been won by away teams.
  • England (79) & India (76) won the most sessions so far, while Australia (47) have tied the most sessions. West Indies (24) & Bangladesh (29) have had the least session wins in this cycle of the WTC so far
  • We have had a spectacular run of dramatic overseas victories. Each team has had at least one overseas win:
    • West Indies won in Australia (the Shamar Joseph Test)
    • NZ won 3-0 in India & one Test in Bangladesh
    • India won Tests in West Indies & South Africa
    • South Africa 1-0 in West Indies & 2-0 in Bangladesh
    • Australia won 2 Tests each in England & New Zealand
    • Bangladesh won in Pakistan 2-0
    • Pakistan won 2-0 in Sri Lanka
    • Sri Lanka won 2-0 in Bangladesh and a Test in England
    • England won one Test each in India & Pakistan
  • The India vs South Africa Test at Cape Town was the shortest Test ever, lasting only 5 sessions.
  • South Africa won all 9 out of 9 sessions in the recent 2nd Test vs Bangladesh and received the maximum possible 54 points for the Test in our points system.

WTC 2023-2025 Alternative Points Table – Results

Here is our alternative WTC 2023-25 points table at a glance.

TeamTotal PointsAverage Max Points Possible* BCD PercentageActual WTC Percentage
Australia37960063.17%62.50%
India41070058.60%58.33%
South Africa23340058.25%54.17%
Sri Lanka23945053.11%55.56%
New Zealand27755050.36%54.55%
England41195043.26% 40.79%
Pakistan20650041.2%33.33%
Bangladesh16250032.4%27.50%
West Indies12245027.11%18.52%

*Note: We have added the same over-rate deductions as the current WTC table does (19 for England, 10 – Australia, 8 – Pakistan, 3 – Bangladesh 2 – India)

Observations

Our points table heavily rewards South Africa, who have dominated 3 overseas Tests (1 vs WI, 2 vs Bangladesh).

Sri Lanka are close by with 3 overseas Tests wins as well (2 vs Bangladesh, 1 vs England) but they lost points to Pakistan at home. Similarly, NZ had a good show vs Bangladesh & India away, but lost convincingly 0-2 against Australia (home) & Sri Lanka (away)

The interesting point our points table highlights is showcasing how close a Test match or Test series was. For example, the 2-2 Ashes translates into 132-118 in favor of Australia (due to overseas wins and draw).

In addition, no two Test series are alike.

The Pakistan-Bangladesh 2-Test series (where Pakistan batted well initially and even declared) resulted in 84-24 points in favor of Bangladesh. This series was closer than the SA-Ban series (101-7 in favor of SA), where SA completely decimated Bangladesh.

Appendix: WTC 2023-25 Match By Match Break Down

If you want to look at the particular series or team, here is a table of content organized by home team for easier access:

Ashes 2023 Series Total (Aus 132 – 118 Eng)

Series Result: 2-2

Series TotalSessions WonSessions TiedH/A PointsBonus?Total
Eng (H)23 (46 Points)24408118 Points
Aus (A)23 (46 Points)24602132 Points

Session-By-Session Legend

  • E – England won session
  • A – Australia won session
  • T – Tied session

1st Test (Birmingham)

  • Sessions Won: England – 5, Australia – 4, Tied – 6
  • Eng Points: 16 Points (10 – Sessions Won Points, 6 – Tied)
  • Aus Points: 38 Points (8 – Sessions Won Points, 6 – Tied, 24 – Away Win)
Session 1Session 2Session 3
Day 1ENG 124/3 (26.4)

E
ENG 240/5 (52.0)

E
ENG 393/8 (78.0)
Aus 14/0 (4.0)
E
Day 2Aus 78/3 (31.0)
T
Aus 188/4 (61.0)
A
Aus 311/5 (94.0)
A
Day 3Aus 386/10 (116.1)
E
ENG 28/2 (10.3)
T
ENG 28/2 (10.3)
T
Day 4ENG 155/5 (37.0)
E
ENG 273/10 (66.2)
A
Aus 107/3 (30.0)
A
Day 5Aus 107/3 (30.0)
T
Aus 183/5 (59.0)
T
Aus 282/8 (92.3)
T

Result: Australia won by 2 wickets

Scorecard: Australia vs England 1st Test

2nd Test (Lord’s)

  • Sessions Won: England – 5, Australia – 8, Tied – 1
  • Eng Points: 11 Points (10 – Sessions Won, 1 – Tied)
  • Aus Points: 43 Points (16 – Sessions Won, 1 – Tied, 24 – Away Win, 2 Bonus (1 Session Left))
Session 1Session 2Session 3
Day 1AUS 73/1 (23.1)
A
AUS 190/2 (50.0)
A
AUS 339/5 (83.0)
A
Day 2AUS 416/10 (100.4)
ENG 13/0 (4.0)
E
ENG 145/1 (30.0)

E
ENG 278/4 (61.0)

E
Day 3ENG 325/10 (76.2)
AUS 12/0 (6.0)
A
AUS 81/1 (32.0)

A
AUS 130/2 (45.4)

A
Day 4AUS 222/5 (74.0)
T
AUS 279/10 (101.5)
E
ENG 114/4 (31.0)
A
Day 5ENG 243/6 (57.0)
E
ENG 327/10 (82.3)
A

Result: Australia won by 43 runs

Scorecard: Australia vs England 2nd Test

3rd Test (Leeds)

  • Sessions Won: England – 5, Australia – 3, Tied – 3
  • Eng Points: 37 Points (10 – Sessions Won, 3 – Tied, 16 – Home Win, 8 – Bonus (4 sessions left))
  • Aus Points: 9 Points (6 – Sessions Won, 3 – Tied)
Session 1Session 2Session 3
Day 1AUS 91/4 (26.0)

E
AUS 240/5 (52.1)

A
AUS 263/10 (60.4)
ENG 68/3 (19.0)
E
Day 2ENG 142/7 (42.1)

A
ENG 237/10 (52.3)
AUS 29/1 (12.0)
A
AUS 116/4 (47.0)

T
Day 3AUS 116/4 (47.0)

T
AUS 116/4 (47.0)

T
AUS 224/10 (67.1)
ENG 27/0 (5.0)
E
Day 4ENG 153/4 (32.0)
E
ENG 254/7 (50.0)
A

Result: England won by 3 wickets

Scorecard: Australia vs England 3rd Test

4th Test (Manchester)

  • Sessions Won: England – 2, Australia – 2, Tied – 11
  • Eng Points: 23 Points (4 – Sessions Won, 11 – Tied, 8 – Home Draw)
  • Aus Points: 27 Points (4 – Sessions Won, 11 – Tied, 12 – Away Draw)
Session 1Session 2Session 3
Day 1AUS 107/2 (25.0)
A
AUS 187/4 (49.0)
T
AUS 299/8 (83.0)
E
Day 2AUS 317/10 (90.2)
ENG 61/1 (16.0)
T
ENG 239/2 (41.0)

T
ENG 384/4 (72.0)

E
Day 3ENG 506/8 (96.0)

T
ENG 592/10 (107.4)
AUS 39/1 (12.0)
T
AUS 113/4 (41.0)

T
Day 4AUS 113/4 (41.0)
T
AUS 214/5 (71.0)
A
AUS 214/5 (71.0)
T
Day 5AUS 214/5 (71.0)
T
AUS 214/5 (71.0)
T
AUS 214/5 (71.0)
T

Result: Match drawn

Scorecard: Australia vs England 4th Test

5th Test (Oval)

  • Sessions Won: England – 6, Australia – 6, Tied – 3
  • Eng Points: 31 Points (12 – Sessions Won, 3 – Tied, 16 – Home Win)
  • Aus Points: 15 Points (12 – Sessions Won, 3 – Tied)
Session 1Session 2Session 3
Day 1ENG 131/3 (26.0)

E
ENG 250/7 (50.0)

E
ENG 283/10 (54.4)
AUS 61/1 (25.0)
T
Day 2AUS 115/2 (51.0)
A
AUS 186/7 (75.0)
E
AUS 295/10 (103.1)
A
Day 3ENG 130/1 (25.0)
E
ENG 265/4 (49.0)
E
ENG 389/9 (80.0)
A
Day 4ENG 395/10 (81.5)
AUS 75/0 (24.0)
A
AUS 135/0 (38.0)

A
AUS 135/0 (38.0)

T
Day 5AUS 238/3 (66.0)
A
AUS 238/3 (66.0)
T
AUS 334/10 (94.4)
E

Result: England won by 49 runs

Scorecard: Australia vs England 5th Test

India Tour of West Indies (Ind 78 – 26 WI)

Series Result: India win 1-0

Series TotalSessions WonSessions TiedH/A PointsBonus?Total
WI (H)6 (12 Points)68026
Ind (A)12 (24 Points)6361278

1st Test (Roseau)

  • Sessions Won: India – 7, West Indies – 1, Tied – 1
  • WI Points: 3 Points (2 – Sessions Won, 1 – Tied)
  • Ind Points: 51 Points (14 – Sessions Won, 1 – Tied, 24 – Away Win, 12 – Bonus (6 sessions left) )
Session 1Session 2Session 3
Day 1WI: 68/4 (28.0)

I
WI: 137/8 (58.0)

I
WI: 150/10 (64.3)
IND: 80/0 (23.0)
I
Day 2IND: 146/0 (55.0)
I
IND: 245/2 (81.0)
I
IND: 312/2 (113.0)
I
Day 3IND: 400/4 (142.0)

T
IND: 421/5 (152.2)
WI: 27/2 (19.0)
W
WI 130/10 (50.3)

I

Result: India won by an innings & 141 runs

Scorecard: India vs West Indies 1st Test

2nd Test (Port of Spain)

  • Sessions Won: India – 5, West Indies – 5, Tied – 5
  • WI Points: 23 Points (10 – Sessions Won, 5 – Tied, 8 – Home Draw)
  • Ind Points: 27 Points (10 – Sessions Won, 5 – Tied, 12 – Away Draw)
Session 1Session 2Session 3
Day 1IND 121/0 (26.0)
I
IND 182/4 (50.4)
W
IND 288/4 (84.0)
I
Day 2IND 373/6 (108.0)
I
IND 438/10 (128.0)
W
WI 86/1 (41.0)
W
Day 3WI 117/2 (51.4)
W
WI 174/3 (86.0)
W
WI 229/5 (108.0)
T
Day 4WI 255/10 (115.40)
IND 98/1 (12.0)
I
IND 118/2 (15.0)

I
IND 181/2 (24.0)
WI 76/2 (32.0)
T
Day 5WI 76/2 (32.0)
T
WI 76/2 (32.0)
T
WI 76/2 (32.0)
T

Result: Match drawn

Scorecard: India vs West Indies 2nd Test

Pakistan Tour of Sri Lanka (Pak 92 – 16 SL)

Series Result: Pakistan win 2-0

Series TotalSessions WonSessions TiedH/A PointsBonus?Total
SL (H)4 (8 Points)80016
Pak (A)13 (26 Points)8481092

1st Test (Galle)

  • Sessions Won: Pakistan – 5, Sri Lanka – 4, Tied – 4
  • SL Points: 9 Points (8 – Sessions Won, 1 – Tied)
  • Pak Points: 42 Points (10 – Sessions Won, 4 – Tied, 24 – Away Win, 4 – Bonus (2 sessions left) )
Session 1Session 2Session 3
Day 1SL 65/4 (19.0)
P
SL 185/5 (48.1)
S
SL 242/6 (65.4)
S
Day 2SL 312/10 (95.2)
P
PAK 132/5 (28.0)
S
PAK 221/5 (45.0)
P
Day 3PAK 313/6 (70.0)

P
PAK 389/8 (95.0)

T
PAK 461/10 (121.2)
SL 14/0 (3.4)
T
Day 4SL 94/3 (35.0)

T
SL 210/6 (67.0)

S
SL 279/10 (83.1)
PAK 48/3 (15.0)
T
Day 5PAK 133/6 (32.5)
P

Result: Pakistan won by 4 wickets

Scorecard: Pakistan vs Sri Lanka 1st Test

2nd Test (Colombo – SSC)

  • Sessions Won: Pakistan – 8, Sri Lanka – 0, Tied – 4
  • Pak Points: 50 Points (16 – Sessions Won, 4 – Tied, 24 – Away Win, 6 – Bonus (3 sessions left) )
  • SL Points: 4 Points (4 – Tied)
Session 1Session 2Session 3
Day 1SL 79/4 (26.0)
P
SL 166/10 (48.4)
P
PAK 145/2 (28.3)
P
Day 2PAK 178/2 (38.3)
T
PAK 178/2 (38.3)
T
PAK 178/2 (38.3)
T
Day 3PAK 273/3 (71.0)
P
PAK 397/4 (99.0)
P
PAK 563/5 (132.0)
P
Day 4PAK 576/6 (134.0)
SL 81/1 (25.0)
T
SL 143/6 (53.0)

P
SL 188/10 (67.4)

P

Result: Pakistan won by an innings and 222 runs

Scorecard: Pakistan vs Sri Lanka 2nd Test

New Zealand Tour of Bangladesh (NZ 53 – 47 Ban)

Series Result: 1-1

Series TotalSessions WonSessions TiedH/A PointsBonus?Total
Ban (H)7 (14 Points)1316447
NZ (A)5 (10 Points)1324653

1st Test (Sylhet)

  • Sessions Won: Bangladesh – 4, New Zealand – 1, Tied – 8
  • Ban Points: 36 Points (8 – Sessions Won, 8 – Tied, 16 – Home Win, 4 – Bonus (2 sessions left))
  • NZ Points: 10 Points (2 – Sessions Won, 8 – Tied)
Session 1Session 2Session 3
Day 1BAN 104/2 (27.0)
B
BAN 185/4 (55.0)
T
BAN 310/9 (85.0)
T
Day 2BAN 310/10 (85.1)
NZ 78/2 (24.0)
T
NZ 168/4 (52.0)

T
NZ 266/8 (84.0)

B
Day 3NZ 317/10 (101.5)
BAN 19/0 (10.0)
T
BAN 111/2 (38.0)

T
BAN 212/3 (68.0)

B
Day 4BAN 308/7 (94.0)

N
BAN 338/10 (100.40)
NZ 37/3 (17.0)
T
NZ 113/7 (49.0)

B
Day 5NZ 181/10 (71.1)
T

Result: Bangladesh won by 150 runs

Scorecard: vs Bangladesh 1st Test

2nd Test (Mirpur)

  • Sessions Won: New Zealand – 4, Bangladesh – 3, Tied – 5
  • Ban Points: 11 Points (6 – Sessions Won, 5 – Tied)
  • NZ Points: 43 Points (8 – Sessions Won, 5 – Tied, 24 – Away Win, 6 – Bonus (3 sessions left))
Session 1Session 2Session 3
Day 1BAN 80/4 (28.0)

N
BAN 149/8 (58.0)

N
BAN 172/10 (66.2)
NZ 55/5 (12.4)
B
Day 2NZ 55/5 (12.4)
T
NZ 55/5 (12.4)
T
NZ 55/5 (12.4)
T
Day 3NZ 55/5 (12.4)
T
NZ 180/10 (37.1)
T
BAN 38/2 (8.0)
B
Day 4BAN 144/10 (35.0)
NZ 4/0 (3.0)
N
NZ 90/6 (30.0)

B
NZ 139/6 (39.4)

N

Result: New Zealand won by 4 wickets

Scorecard: New Zealand vs Bangladesh 2nd Test

Pakistan Tour of Australia (Aus 117 – 21 Pak)

Series Result: Australia win 3-0

Series TotalSessions WonSessions TiedH/A PointsBonus?Total
Aus (H)20 (40 Points)94820117
Pak (A)6 (12 Points)90021

1st Test (Perth)

  • Sessions Won: Australia – 9, Pakistan – 1, Tied – 2
  • Aus Points: 42 Points (18 – Sessions Won, 2 – Tied, 16 – Home Win, 6 – Bonus (3 sessions left))
  • Pak Points: 4 Points (2 – Sessions Won, 2 – Tied)
Session 1Session 2Session 3
Day 1AUS 117/0 (25.0)
A
AUS 210/2 (50.0)
A
AUS 346/5 (84.0)
A
Day 2AUS 476/7 (110.0)

A
AUS 487/10 (113.2)
PAK 43/0 (20.0)
P
PAK 132/2 (53.0)

T
Day 3PAK 203/6 (78.0)
A
PAK 271/10 (101.5)
A
AUS 84/2 (33.0)
T
Day 4AUS 186/4 (58.0)

A
AUS 233/5 (63.2)
PAK 53/4 (17.0)
A
PAK 89/10 (30.2)

A

Result: Australia won by 360 runs

Scorecard: Pakistan vs Australia 1st Test

2nd Test (Melbourne)

  • Sessions Won: Australia – 6, Pakistan – 3, Tied – 3
  • Aus Points: 37 Points (12 – Sessions Won, 3 – Tied, 16 – Home Win, 6 – Bonus (3 sessions left))
  • Pak Points: 9 Points (6 – Sessions Won, 3 – Tied)
Session 1Session 2Session 3
Day 1AUS 90/1 (27.1)
A
AUS 114/2 (42.4)
A
AUS 187/3 (66.0)
A
Day 2AUS 318/10 (96.5)
P
PAK 68/1 (24.0)
P
PAK 194/6 (55.0)
A
Day 3PAK 264/10 (73.5)
AUS 6/2 (3.0)
T
AUS 107/4 (30.0)

A
AUS 187/6 (62.3)

T
Day 4AUS 262/10 (84.1)
PAK 25/1 (9.0)
T
PAK 129/3 (33.0)

P
PAK 237/10 (67.2)

A

Result: Australia won by 79 runs

Scorecard: Pakistan vs Australia 2nd Test

3rd Test (Sydney)

  • Sessions Won: Australia – 5, Pakistan – 2, Tied – 4
  • Aus Points: 38 Points (10 – Sessions Won, 4 – Tied, 16 – Home Win, 8 – Bonus (4 sessions left))
  • Pak Points: 8 Points (4 – Sessions Won, 4 – Tied)
Session 1Session 2Session 3
Day 1PAK 75/4 (24.0)

A
PAK 199/6 (48.0)

P
PAK 313/10 (77.1)
AUS 6/0 (1.0)
P
Day 2AUS 78/1 (30.0)
A
AUS 116/2 (47.0)
A
AUS 116/2 (47.0)
T
Day 3AUS 199/4 (80.0)

T
AUS 289/6 (106.2)

T
AUS 299/10 (109.4)
PAK 68/7 (26.0)
T
Day 4PAK 115/10 (43.1)
AUS 91/1 (18.0)
A
AUS 130/2 (25.5)

A

Result: Australia won by 8 wickets

Scorecard: Pakistan vs Australia 3rd Test

India Tour of South Africa (Ind 58 – 42 SA)

Series Result: 1-1

Series TotalSessions WonSessions TiedH/A PointsBonus?Total
SA (H)5 (10 Points)4161242
Ind (A)5 (10 Points)4242058

1st Test (Centurion)

  • Sessions Won: South Africa – 4, India – 2, Tied – 3
  • SA Points: 39 Points (8 – Sessions Won, 3 – Tied, 16 – Home Win, 12 – Bonus (6 sessions left))
  • Ind Points: 8 Points (4 – Sessions Won, 4 – Tied)
Session 1Session 2Session 3
Day 1IND 91/3 (26.0)
I
IND 176/6 (50.0)
T
IND 208/8 (59.0)
I
Day 2IND 245/10 (67.4)
SA 49/1 (16.0)
T
SA 194/3 (49.0)
S
SA 256/5 (66.0)
S
Day 3SA 392/7 (100.0)

S
SA 408/10 (108.4)
IND 62/3 (16.0)
T
IND 131/10 (34.1)

S

Result: South Africa won by an innings and 32 runs

Scorecard: India vs South Africa 1st Test

2nd Test (Cape Town)

  • Sessions Won: India – 3, South Africa – 1, Tied – 1
  • SA Points: 3 Points (2 – Sessions Won, 1 – Tied)
  • Ind Points: 51 Points (6 – Sessions Won, 1 – Tied, 24 – Away Win, 20 – Bonus (10 sessions left))
Session 1Session 2Session 3
Day 1SA 55/10 (23.2)

I
IND 111/4 (24.0)

I
IND 153/10 (34.5)
SA 62/3 (17.0)
S
Day 2SA 176/10 (36.5)
T
IND 80/3 (12.0)
I

*Note: This was the shortest Test ever.

Result: India won by 7 wickets

Scorecard: India vs South Africa 2nd Test

West Indies Tour of Australia (Aus 53 – 47 WI)

Series Result: 1-1

Series TotalSessions WonSessions TiedH/A PointsBonus?Total
Aus (H)6 (12 Points)9161653
WI (A)3 (6 Points)924847

1st Test (Adelaide)

  • Sessions Won: Australia – 3, West Indies – 0, Tied – 4
  • Aus Points: 42 Points (6 – Sessions Won, 4 – Tied, 16 – Home Win, 16 – Bonus (8 sessions left))
  • WI Points: 4 Points (4 – Tied)
Session 1Session 2Session 3
Day 1WI 64/3 (27.0)

T
WI 177/9 (59.0)

T
WI 188/10 (62.1)
AUS 59/2 (21.0)
T
Day 2AUS 144/5 (48.0)

T
AUS 260/8 (75.0)

A
AUS 283/10 (81.1)
WI 73/6 (22.5)
A
Day 3WI 120/10 (25.2)
AUS 26/0 (6.4)
A

Result: Australia won by 10 wickets

Scorecard: West Indies vs Australia 1st Test

2nd Test (Brisbane)

  • Sessions Won: West Indies – 3, Australia – 3, Tied – 5
  • Aus Points: 11 Points (6 – Sessions Won, 5 – Tied)
  • WI Points: 43 Points (6 – Sessions Won, 5 – Tied, 24 – Away Win, 8 – Bonus (4 sessions left))
Session 1Session 2Session 3
Day 1WI 64/5 (25.2)
A
WI 145/5 (53.0)
W
WI 266/8 (89.4)
T
Day 2WI 311/10 (108.0)
AUS 24/4 (5.0)
W
AUS 161/7 (30.1)

A
AUS 289/9 (53.0)
WI 13/1 (7.3)
A
Day 3WI 106/3 (34.0)

T
WI 183/6 (61.0)

T
WI 193/9 (72.3)
AUS 60/2 (19.0)
T
Day 4AUS 187/8 (47.0)
W
AUS 207/10 (50.5)
T

Result: West Indies won by 8 runs

Scorecard: West Indies vs Australia 2nd Test

England Tour of India (Ind 173 – 65 Eng)

Series Result: India win 4-1

Series TotalSessions WonSessions TiedH/A PointsBonus?Total
Ind (H)33 (66 Points)76436173
Eng (A)14 (28 Points)724665

1st Test (Hyderabad)

  • Sessions Won: India – 6, England – 5, Tied – 1
  • Ind Points: 17 Points (12 – Sessions Won, 5 – Tied)
  • Eng Points: 41 Points (10 – Sessions Won, 1 – Tied, 24 – Away Win, 6 – Bonus (3 sessions left))
Session 1Session 2Session 3
Day 1ENG 108/3 (28.0)

E
ENG 215/8 (64.3)

I
ENG 246/10 (64.3)
IND 119/1 (23.0)
I
Day 2IND 222/3 (50.0)
I
IND 309/5 (76.0)
I
IND 421/7 (110.0)
I
Day 3IND 436/10 (121.0)
ENG 89/1 (15.0)
E
ENG 172/5 (42.0)

I
ENG 316/6 (77.0)

E
Day 4ENG 420/10 (102.1)
E
IND 95/3 (29.0)
T
IND 202/10 (69.2)
E

Result: England won by 28 runs

Scorecard: England vs India 1st Test

2nd Test (Visakhapatnam)

  • Sessions Won: India – 7, England – 3, Tied – 1
  • Ind Points: 39 Points (14 – Sessions Won, 1 – Tied, 16 – Home Win, 8 – Bonus (4 sessions left)
  • Eng Points: 7 Points (6 – Sessions Won, 1 – Tied)
Session 1Session 2Session 3
Day 1IND 103/2 (31.0)
I
IND 225/3 (63.0)
I
IND 336/6 (93.0)
I
Day 2IND 396/10 (112.0)
ENG 32/0 (6.0)
E
ENG 155/4 (33.0)

T
ENG 253/10 (55.5)
IND 29/0 (5.0)
I
Day 3IND 130/4 (35.0)

E
IND 227/6 (64.0)

I
IND 255/10 (78.3)
ENG 67/1 (14.0)
E
Day 4ENG 194/6 (42.4)
I
ENG 292/10 (69.2)
I

Result: India won by 106 runs

Scorecard: England vs India 2nd Test

3rd Test (Rajkot)

  • Sessions Won: India – 9, England – 2, Tied – 1
  • Ind Points: 41 Points (18 – Sessions Won, 1 – Tied, 16 – Home Win, 6 – Bonus (3 sessions left))
  • Eng Points: 5 Points (4 – Sessions Won, 1 – Tied)
Session 1Session 2Session 3
Day 1IND 93/3 (25.0)
I
IND 185/3 (52.0)
I
IND 326/5 (86.0)
I
Day 2IND 388/7 (113.0)

I
IND 445/10 (130.5)
ENG 31/0 (6.0)
E
ENG 207/2 (35.0)

E
Day 3ENG 290/5 (61.0)

T
ENG 319/10 (71.1)
IND 44/1 (16.0)
I
IND 196/2 (51.0)

I
Day 4IND 314/4 (82.0)

I
IND 430/4 (98.0)
ENG 18/2 (8.2)
I
ENG 122/10 (39.4)

I

Result: India won by 434 runs

Scorecard: England vs India 3rd Test

4th Test (Ranchi)

  • Sessions Won: India – 6, England – 2, Tied – 3
  • Ind Points: 39 Points (12 – Sessions Won, 3 – Tied, 16 – Home Win, 8 – Bonus (4 sessions left))
  • Eng Points: 7 Points (4 – Sessions Won, 3 – Tied)
Session 1Session 2Session 3
Day 1ENG 112/5 (24.1)
I
ENG 198/5 (61.0)
E
ENG 302/7 (90.0)
E
Day 2ENG 353/10 (104.5)
IND 34/1 (10.0)
I
IND 131/4 (38.0)

T
IND 219/7 (73.0)

T
Day 3IND 307/10 (103.2)

T
ENG 120/5 (33.0)

I
ENG 145/10 (53.5)
IND 40/0 (8.0)
I
Day 4IND 118/3 (37.0)
I
IND 192/5 (61.0)
I

Result: India won by 5 wickets

Scorecard: England vs India 4th Test

5th Test (Dharamsala)

  • Sessions Won: India – 5, England – 2, Tied – 1
  • Ind Points: 41 Points (10 – Sessions Won, 1 – Tied, 16 – Home Win, 14 – Bonus (7 sessions left))
  • Eng Points: 5 Points (4 – Sessions Won, 1 – Tied)
Session 1Session 2Session 3
Day 1ENG 100/2 (25.3)

E
ENG 194/8 (55.0)

I
ENG 218/10 (57.4)
IND 135/1 (30.0)
I
Day 2IND 264/1 (60.0)
I
IND 376/3 (84.0)
I
IND 473/8 (120.0)
E
Day 3IND 477/10 (124.1)
ENG 103/5 (22.5)
T
ENG 195/10 (48.1)

I

Result: India won by an innings and 64 runs

Scorecard: England vs India 5th Test

South Africa Tour of New Zealand (NZ 75 – 17 SA)

Series Result: New Zealand win 2-0

Series TotalSessions WonSessions TiedH/A PointsBonus?Total
NZ (H)11 (22 Points)9321275
SA (A)4 (8 Points)90017

1st Test (Mount Maunganui)

  • Sessions Won: New Zealand – 6, South Africa – 1, Tied – 5
  • NZ Points: 39 Points (12 – Sessions Won, 5 – Tied, 16 – Home Win, 6 – Bonus (3 sessions left))
  • SA Points: 7 Points (2 – Sessions Won, 5 – Tied)
Session 1Session 2Session 3
Day 1NZ 65/2 (25.0)
N
NZ 125/2 (52.0)
N
NZ 258/2 (86.0)
N
Day 2NZ 330/3 (114.0)

N
NZ 475/7 (141.0)

N
NZ 511/10 (144.0)
SA 80/4 (28.0)
T
Day 3SA 129/7 (56.0)

T
SA 162/10 (72.5)
NZ 179/4 (43.0)
T
NZ 179/4 (43.0)

T
Day 4SA 62/2 (28.0)
T
SA 173/4 (56.0)
S
SA 247/10 (80.0)
N

Result: New Zealand won by 281 runs

Scorecard: South Africa vs New Zealand 1st Test

2nd Test (Hamilton)

  • Sessions Won: New Zealand – 5, South Africa – 3, Tied – 4
  • NZ Points: 36 Points (10 – Sessions Won, 4 – Tied, 16 – Home Win, 6 – Bonus (3 sessions left))
  • SA Points: 10 Points (6 – Sessions Won, 4 – Tied)
Session 1Session 2Session 3
Day 1SA 64/3 (27.0)
T
SA 127/5 (56.0)
T
SA 220/6 (89.0)
S
Day 2SA 242/10 (97.2)
NZ 27/1 (16.0)
N
NZ 121/3 (48.0)

T
NZ 211/10 (77.3)

S
Day 3SA 88/3 (28.0)

T
SA 186/4 (53.0)

S
SA 235/10 (69.5)
NZ 40/1 (13.5)
N
Day 4NZ 107/2 (39.0)
N
NZ 173/3 (67.0)
N
NZ 269/3 (94.2)
N

Result: New Zealand won by 7 wickets

Scorecard: South Africa vs New Zealand 2nd Test

Australia Tour of New Zealand (Aus 87 – 21 NZ)

Series Result: Australia win 2-0

Series TotalSessions WonSessions TiedH/A PointsBonus?Total
NZ (H)8 (16 Points)50021
Aus (A)8 (16 Points)5481887

1st Test (Wellington)

  • Sessions Won: Australia – 5, New Zealand – 3, Tied – 2
  • NZ Points: 8 Points (6 – Sessions Won, 2 – Tied)
  • Aus Points: 46 Points (10 – Sessions Won, 2 – Tied, 24 – Away Win, 10 – Bonus (5 sessions left))
Session 1Session 2Session 3
Day 1AUS 62/1 (27.0)
A
AUS 147/4 (53.0)
T
AUS 279/9 (85.0)
N
Day 2AUS 383/10 (115.1)

A
NZ 42/5 (21.0)

A
NZ 179/10 (43.1)
AUS 13/2 (8.0)
T
Day 3AUS 113/4 (35.0)

A
AUS 164/10 (51.1)
NZ 15/1 (6.0)
N
NZ 111/3 (41.0)

N
Day 4NZ 196/10 (64.4)
A

Result: Australia won by 172 runs

Scorecard: Australia vs New Zealand 1st Test

2nd Test (Christchurch)

  • Sessions Won: New Zealand – 5, Australia – 3, Tied – 3
  • NZ Points: 13 Points (10 – Sessions Won, 3 – Tied)
  • Aus Points: 41 Points (6 – Sessions Won, 3 – Tied, 24 – Away Win, 8 – Bonus (4 sessions left))
Session 1Session 2Session 3
Day 1NZ 71/3 (25.2)
T
NZ 162/10 (45.2)
A
AUS 124/4 (36.0)
N
Day 2AUS 221/8 (60.2)

N
AUS 256/10 (68.0)
NZ 43/1 (17.0)
T
NZ 134/2 (50.0)

N
Day 3NZ 243/3 (78.0)

N
NZ 345/6 (103.0)

N
NZ 372/10 (108.2)
AUS 77/4 (24.0)
T
Day 4AUS 174/5 (43.0)
A
AUS 281/7 (65.0)
A

Result: Australia won by 3 wickets

Scorecard: Australia vs New Zealand 2nd Test

Sri Lanka Tour of Bangladesh (SL 87 – 21 Ban)

Series Result: Sri Lanka win 2-0

Series TotalSessions WonSessions TiedH/A PointsBonus?Total
Ban (H)7 (14 Points)70021
SL (A)10 (20 Points)7481287

1st Test (Sylhet)

  • Sessions Won: Sri Lanka – 4, Bangladesh – 4, Tied – 3
  • Ban Points: 11 Points (8 – Sessions Won, 3 – Tied)
  • SL Points: 43 Points (8 – Session Won, 3 – Tied, 24 – Away Win, 8 – Bonus (4 sessions left))
Session 1Session 2Session 3
Day 1SL 92/5 (22.0)
B
SL 217/5 (49.0)
S
SL 280/10 (68.0)
BAN 32/3 (10.0)
T
Day 2BAN 132/6 (36.0)

B
BAN 188/10 (51.3)
SL 19/1 (5.4)
S
SL 119/5 (36.0)

B
Day 3SL 233/6 (63.0)

S
SL 338/7 (94.0)

S
SL 418/10 (110.4)
BAN 47/5 (13.0)
T
Day 4BAN 129/7 (38.0)
B
BAN 182/10 (49.2)
T

Result: Sri Lanka won by 328 runs

Scorecard: Sri Lanka vs Bangladesh 1st Test

2nd Test (Chattogram)

  • Sessions Won: Sri Lanka – 6, Bangladesh – 3, Tied – 4
  • Ban Points: 10 Points (6 – Sessions Won, 4 – Tied)
  • SL Points: 44 Points (12 – Session Won, 4 – Tied, 24 – Away Win, 4 – Bonus (2 sessions left))
Session 1Session 2Session 3
Day 1SL 88/0 (27.0)
S
SL 214/2 (58.0)
S
SL 314/4 (90.0)
S
Day 2SL 411/5 (118.0)
S
SL 476/7 (144.0)
S

SL 531/10 (159.0)
BAN 55/1 (15.0)
T
Day 3BAN 115/4 (41.0)
T
BAN 178/10 (68.4)
S
SL 102/6 (25.0)
B
Day 4SL 157/7 (40.0)
BAN 31/0 (8.0)
T
BAN 132/4 (34.0)
B
BAN 268/7 (67.0)
B
Day 5BAN 318/10 (85.0)
T

Result: Sri Lanka won by 192 runs

Scorecard: Sri Lanka vs Bangladesh 2nd Test

West Indies Tour of England (Eng 120 – 18 WI)

Series Result: England win 3-0

Series TotalSessions WonSessions TiedH/A PointsBonus?Total
Eng (H)15 (30 Points)64836120
WI (A)6 (12 Points)60018

1st Test (Lord’s)

  • Sessions Won: England – 4, West Indies – 1, Tied – 2
  • Eng Points: 42 Points (8 – Sessions Won, 2 – Tied, 16 – Home Win, 16 – Bonus (8 sessions left)
  • WI Points: 4 Points (2 – Sessions Won, 2 – Tied)
Session 1Session 2Session 3
Day 1WI 61/3 (28.0)

T
WI 121/10 (41.4)
ENG 30/1 (8.0)
E
ENG 189/3 (40.0)

E
Day 2ENG 293/6 (68.0)
E
ENG 371/10 (90.0)
W
WI 79/6 (34.5)
E
Day 3WI 136/10 (47.0)
T

Result: England won by an innings and 114 runs
Scorecard: West Indies vs England 1st Test

2nd Test (Nottingham)

  • Sessions Won: England – 7, West Indies – 2, Tied – 3
  • Eng Points: 39 Points (14 – Sessions Won, 3 – Tied, 16 – Home Win, 6 – Bonus (3 sessions left)
  • WI Points: 7 Points (4 – Sessions Won, 3 – Tied)
Session 1Session 2Session 3
Day 1ENG 134/2 (26.0)
E
ENG 259/4 (53.0)
E
ENG 416/10 (88.3)
T
Day 2WI 89/3 (26.0)
T
WI 212/3 (52.0)
W
WI 351/5 (84.0)
W
Day 3WI 457/10 (111.5)
E
ENG 116/1 (22.0)
E
ENG 248/3 (51.0)
E
Day 4ENG 348/6 (76.0)
E
ENG 425/10 (92.2)
T
WI 143/10 (36.1)
E

Result: England won by 241 runs

Scorecard: West Indies vs England 2nd Test

3rd Test (Birmingham)

  • Sessions Won: England – 4, West Indies – 3, Tied – 1
  • Eng Points: 39 Points (8 – Sessions Won, 1 – Tied, 16 – Home Win, 14 – Bonus (7 sessions left)
  • WI Points: 7 Points (6 – Sessions Won, 1 – Tied)
Session 1Session 2Session 3
Day 1WI 97/3 (26.0)

W
WI 194/5 (53.0)

W
WI 282/10 (75.1)
ENG 38/3 (8.0)
T
Day 2ENG 157/5 (33.0)

E
ENG 274/7 (59.0)

E
ENG 376/10 (75.4)
WI 33/2 (14.0)
E
Day 3WI 151/5 (41.0)

W
WI 175/10 (52.0)
ENG 87/0 (7.2)
E

Result: England won by 10 wickets

Scorecard: West Indies vs England 3rd Test

South Africa Tour of West Indies (SA 73 – 31 WI)

Series Result: South Africa win 1-0

Series TotalSessions WonSessions TiedH/A PointsBonus?Total
WI (H)9 (18 Points)58031
SA (A)11 (22 Points)5361073

1st Test (Port of Spain)

  • Sessions Won: South Africa – 6, West Indies – 4, Tied – 5
  • WI Points: 21 Points (8 – Sessions Won, 5 – Tied, 8 – Home Draw)
  • SA Points: 29 Points (12 – Sessions Won, 5 – Tied, 12 – Away Draw)
Session 1Session 2Session 3
Day 1SA 45/1 (15.0)
S
SA 45/1 (15.0)
T
SA 45/1 (15.0)
T
Day 2SA 152/3 (53.0)
S
SA 244/4 (80.0)
S
SA 344/8 (113.0)
W
Day 3SA 357/10 (117.4)
WI 53/1 (27.0)
W
WI 114/2 (49.2)

W
WI 145/4 (67.0)

W
Day 4WI 145/4 (67.0)
T
WI 145/4 (67.0)
T
WI 233/10 (91.5)
S
Day 5SA 30/0 (5.0)

S
SA 173/3 (29.0)
WI 11/1 (3.3)
S
WI 121/3 (33.0)

T

Result: Match drawn

Scorecard: South Africa vs West Indies 1st Test

2nd Test (Providence)

  • Sessions Won: South Africa – 5, West Indies – 5, Tied – 0
  • WI Points: 10 Points (10 – Sessions Won)
  • SA Points: 44 Points (10 – Sessions Won, 24 – Away Win, 10 – Bonus (5 sessions left))
Session 1Session 2Session 3
Day 1SA 64/4 (26.0)

W
SA 160/10 (54.0)
WI 0/0
W
WI 97/7 (28.2)

S
Day 2WI 144/10 (42.4)
SA 30/0 (8.0)
S
SA 111/1 (35.0)

S
SA 223/5 (70.0)

W
Day 3SA 246/10 (80.4)
W
WI 43/1 (14.0)
W
WI 127/6 (40.0)
S
Day 4WI 222/10 (66.2)
S

Result: South Africa won by 40 runs

Scorecard: South Africa vs West Indies 2nd Test

Bangladesh Tour of Pakistan (Ban 84 – 24 Pak)

Series Result: Bangladesh win 2-0

Series TotalSessions WonSessions TiedH/A PointsBonus?Total
Pak (H)8 (16 Points)80024
Ban (A)12 (24 Points)848484

1st Test (Rawalpindi)

  • Sessions Won: Bangladesh – 8, Pakistan – 6, Tied – 1
  • Pak Points: 13 Points (12 – Sessions Won, 1 – Tied)
  • Ban Points: 41 Points (16 – Sessions Won, 1 – Tied, 24 – Away Win)
Session 1Session 2Session 3
Day 1PAK 0/0
T
PAK 81/3 (21.0)
P
PAK 158/4 (41.0)
P
Day 2PAK 256/4 (70.0)

P
PAK 367/5 (98.0)

P
PAK 448/6 (113.0)
BAN 27/0 (12.0)
P
Day 3BAN 134/2 (48.0)
B
BAN 199/4 (66.0)
B
BAN 316/5 (92.0)
B
Day 4BAN 389/6 (117.0)

B
BAN 495/6 (148.0)

B
BAN 565/10 (167.3)
PAK 23/1 (10.0)
P
Day 5PAK 108/6 (36.0)
B
PAK 146/10 (55.5)
B
BAN 30/0 (6.3)
B

Result: Bangladesh won by 10 wickets

Scorecard: Bangladesh vs Pakistan 1st Test

2nd Test (Rawalpindi)

  • Sessions Won: Bangladesh – 4, Pakistan – 2, Tied – 7
  • Pak Points: 11 Points (4 – Sessions Won, 7 – Tied)
  • Ban Points: 43 Points (8 – Sessions Won, 7 – Tied, 24 – Away Win, 4 – Bonus (2 sessions left))
Session 1Session 2Session 3
Day 1PAK 0/0
T
PAK 0/0
T
PAK 0/0
T
Day 2PAK 99/1 (25.0)

P
PAK 183/5 (55.0)

B
PAK 274/10 (85.1)
BAN 10/0 (2.0)
B
Day 3BAN 75/6 (26.0)

P
BAN 193/8 (53.3)

T
BAN 262/10 (78.4)
PAK 9/2 (3.4)
T
Day 4PAK 117/6 (30.0)

T
PAK 172/10 (46.4)
BAN 37/0 (6.0)
B
BAN 42/0 (7.0)

T
Day 5BAN 122/2 (34.0)
B

Result: Bangladesh won by 6 wickets

Scorecard: Bangladesh vs Pakistan 2nd Test

Sri Lanka Tour of England (Eng 85 – 61 SL)

Series Result: England win 2-1

Series TotalSessions WonSessions TiedH/A PointsBonus?Total
Eng (H)17 (34 Points)5321485
SL (A)11 (22 Points)5241061

1st Test (Manchester)

  • Sessions Won: England – 6, Sri Lanka – 3, Tied – 3
  • Eng Points: 37 Points (12 – Sessions Won, 3 – Tied, 16 – Home Win, 6 – Bonus (3 sessions left))
  • SL Points: 9 Points (6 – Sessions won, 3 – Tied)
Session 1Session 2Session 3
Day 1SL 80/5 (25.0)

E
SL 178/8 (52.0)

T
SL 236/10 (74.0)
ENG 22/0 (4.0)
T
Day 2ENG 22/0 (4.0)
T
ENG 176/4 (37.0)
E
ENG 259/6 (61.0)
E
Day 3Eng 358/10 (85.3)
SL 10/2 (3.0)
E
SL 107/4 (30.0)

S
SL 204/6 (60.0)

S
Day 4SL 291/6 (82.0)

S
SL 326/10 (89.3)
ENG 82/3 (22.0)
E
ENG 205/5 (57.2)

E

Result: England won by 5 wickets

Scorecard: Sri Lanka vs England 1st Test

2nd Test (Lord’s)

  • Sessions Won: England – 6, Sri Lanka – 3, Tied – 2
  • Eng Points: 38 Points (12 – Sessions Won, 2 – Tied, 16 – Home Win, 8 – Bonus (4 sessions left))
  • SL Points: 8 Points (6 – Sessions won, 2 – Tied)
Session 1Session 2Session 3
Day 1ENG 97/3 (24.0)
E
ENG 200/5 (53.0)
E
ENG 358/7 (88.0)
E
Day 2ENG 427/10 (102.0)
SL 32/2 (9.1)
T
SL 129/7 (33.0)

E
SL 196/10 (55.3)
ENG 25/1 (7.0)
T
Day 3ENG 159/4 (34.0)

E
ENG 251/10 (54.3)
SL 53/2 (20.0)
S
SL 136/4 (50.0)

S
Day 4SL 260/7 (80.0)
S
SL 292/10 (86.4)
E

Result: England won by 190 runs

Scorecard: Sri Lanka vs England 2nd Test

3rd Test (Oval)

  • Sessions Won: England – 5, Sri Lanka – 5, Tied – 0
  • Eng Points: 10 Points (10 – Sessions Won)
  • SL Points: 44 Points (10 – Sessions won, 24 – Away Win, 10 – Bonus (5 sessions left))
Session 1Session 2Session 3
Day 1ENG 76/1 (15.0)
E
ENG 194/3 (40.0)
E
ENG 221/3 (44.1)
E
Day 2ENG 325/10 (69.1)
SL 1/0 (1.0)
S
SL 142/5 (28.0)

E
SL 211/5 (45.0)

S
Day 3SL 263/10 (61.2)
ENG 35/2 (7.4)
E
ENG 140/8 (31.0)

S
ENG 156/10 (34.0)
SL 94/1 (15.0)
S
Day 4SL 219/2 (40.3)
S

Result: Sri Lanka won by 8 wickets

Scorecard: Sri Lanka vs England 3rd Test

New Zealand Tour of Sri Lanka (SL 75 – 15 NZ)

Series Result: Sri Lanka win 2-0

Series TotalSessions WonSessions TiedH/A PointsBonus?Total
SL (H)13 (26 Points)5321275
NZ (A)5 (10 Points)50015

1st Test (Galle)

  • Sessions Won: Sri Lanka – 5, New Zealand – 3, Tied – 4
  • SL Points: 34 Points (10 – Sessions Won, 4 – Tied, 16 – Home Win, 4 – Bonus (2 sessions left)
  • NZ Points: 10 Points (6 – Sessions Won, 4 – Tied)
Session 1Session 2Session 3
Day 1SL 88/2 (28.0)
T
SL 178/5 (55.3)
T
SL 302/7 (88.0)
S
Day 2SL 305/10 (91.5)
NZ 5/0 (1.0)
T
NZ 136/2 (38.4)

N
NZ 255/4 (72.0)

N
Day 3NZ 340/10 (90.5)
SL 32/1 (9.0)
S
SL 134/1 (40.0)

S
SL 237/4 (72.0)

T
Day 4SL 309/10 (94.2)
NZ 13/1 (5.0)
N
NZ 114/4 (37.0)

T
NZ 207/8 (68.0)

S
Day 5NZ 211/10 (71.4)
S

Result: Sri Lanka won by 63 runs

Scorecard: New Zealand vs Sri Lanka 1st Test

2nd Test (Galle)

  • Sessions Won: Sri Lanka – 8, New Zealand – 2, Tied – 1
  • SL Points: 41 Points (16 – Sessions Won, 1 – Tied, 16 – Home Win, 8 – Bonus (4 sessions left)
  • NZ Points: 9 Points (4 – Sessions Won, 1 – Tied)
Session 1Session 2Session 3
Day 1SL 102/1 (32.0)
S
SL 194/2 (62.0)
S
SL 306/3 (90.0)
S
Day 2SL 402/5 (118.3)

S
SL 519/5 (149.0)

S
SL 602/5 (163.4)
NZ 22/2 (14.0)
S
Day 3NZ 88/10 (39.5)
NZ 3/1 (2.0)
S
NZ 129/5 (30.0)

T
NZ 199/5 (41.0)

N
Day 4NZ 335/8 (75.0)
N
NZ 360/10 (81.4)
S

Result: Sri Lanka won by an innings and 154 runs

Scorecard: New Zealand vs Sri Lanka 2nd Test

Bangladesh Tour of India (Ind 80 – 12 Ban)

Series Result: India win 2-0

Series TotalSessions WonSessions TiedH/A PointsBonus?Total
Ind (H)12 (24 Points)12321280
Ban (A)0 120012

1st Test (Chennai)

  • Sessions Won: India – 8, Bangladesh – 0, Tied – 2
  • Ind Points: 44 Points (16 – Sessions Won, 2 – Tied, 16 – Home Win, 10 – Bonus (5 sessions left))
  • Ban Points: 2 Points (2 – Tied)
Session 1Session 2Session 3
Day 1IND 88/3 (23.0)
I
IND 176/6 (48.0)
I
IND 339/6 (80.0)
I
Day 2IND 376/10 (91.2)
BAN 26/3 (9.0)
T
BAN 112/8 (36.5)

I
BAN 149/10 (47.1)
IND 81/3 (23.0)
I
Day 3IND 205/3 (51.0)

I
IND 287/4 (64.0)
BAN 56/0 (13.0)
T
BAN 158/4 (37.2)

I
Day 4BAN 234/10 (62.1)
I

Result: India won by 280 runs

Scorecard: Bangladesh vs India 1st Test

2nd Test (Kanpur)

  • Sessions Won: India – 4, Bangladesh – 0, Tied – 10
  • Ind Points: 36 Points (8 – Sessions Won, 10 – Tied, 16 – Home Win, 2 – Bonus (1 sessions left))
  • Ban Points: 10 Points (10 – Tied)
Session 1Session 2Session 3
Day 1BAN 74/2 (26.0)
T
BAN 107/3 (35.0)
T
BAN 107/3 (35.0)
T
Day 2BAN 107/3 (35.0)
T
BAN 107/3 (35.0)
T
BAN 107/3 (35.0)
T
Day 3BAN 107/3 (35.0)
T
BAN 107/3 (35.0)
T
BAN 107/3 (35.0)
T
Day 4BAN 205/6 (66.0)

I
BAN 233/10 (74.2)
IND 138/2 (16.0)
I
IND 285/9 (34.4)
BAN 26/2 (11.0)
T
Day 5BAN 146/10 (47.0)
I
IND 98/3 (17.2)
I

Result: India won by 7 wickets

Scorecard: Bangladesh vs India 2nd Test

England Tour of Pakistan (Pakistan 77 – 42 England)

Series Result: Pakistan win 2-1

Series TotalSessions WonSessions TiedH/A PointsBonus?Total
Pak (H)15 (30 Points)4322677
Eng (A)10 (20 Points)424442

1st Test (Multan)

  • Sessions Won: Pakistan – 4, England – 6, Tied – 2
  • Pak Points: 10 Points (8 – Session Won, 2 – Tied)
  • Eng Points: 42 Points (12 – Session Won, 2 – Tied, 4 – Bonus Points (2 sessions left), 24 – Away Win)
Session 1Session 2Session 3
Day 1PAK 122/1 (25.0)
P
PAK 233/1 (52.0)
P
PAK 328/4 (86.0)
T
Day 2PAK 397/6 (112.0)

P
PAK 515/8 (138.0)

P
PAK 556/10 (149.0)
ENG 96/1 (20.0)
E
Day 3ENG 232/2 (45.0)
E
ENG 351/3 (70.0)
E
ENG 492/3 (101.0)
E
Day 4ENG 658/3 (130.0)


E
ENG 823/7 (150.0)
PAK 23/1 (6.0)
T
PAK 152/6 (37.0)

E
Day 5PAK 220/10 (54.5)
E

Result: England won by an innings and 47 runs

Scorecard: England vs Pakistan 1st Test

2nd Test (Multan)

  • Sessions Won: Pakistan – 7, England – 2, Tied – 1
  • Pak Points: 41 Points (14 – Session Won, 1 – Tied, 16 – Home Win, 10 – Bonus (5 sessions left))
  • Eng Points: 9 Points (4 – Session 4, 1 – Tied)
Session 1Session 2Session 3
Day 1PAK 79/2 (29.0)
P
PAK 173/3 (57.0)
P
PAK 259/5 (90.0)
P
Day 2PAK 358/8 (117.0)

P
PAK 366/10 (123.3)
ENG 88/1 (17.0)
E
ENG 239/6 (53.0)

P
Day 3ENG 291/10 (67.2)
PAK 43/3 (15.0)
T

PAK 134/5 (40.0)

P
PAK 221/10 (59.2)
ENG 36/2 (11.0)
E
Day 4Eng 144/10 (33.3)
P

Result: Pakistan won by 152 runs

Scorecard: England vs Pakistan 2nd Test

3rd Test (Rawalpindi)

  • Sessions Won: Pakistan – 4, England – 2, Tied – 1
  • Pak Points: 49 Points (8 – Sessions Won, 1 – Tied, 4, 16 – Home Win, 16 – Bonus (8 session left))
  • Eng Points: 9 Points (4 – Sessions Won, 1 – Tied)
Session 1Session 2Session 3
Day 1ENG 110/5 (30.0)

P
ENG 242/8 (63.0)

E
ENG 267/10 (68.2)
PAK 73/3 (23.0)
T
Day 2PAK 187/7 (62.0)

E
PAK 267/8 (84.0)

P
PAK 344/10 (96.4)
ENG 24/3 (9.0)
P
Day 3ENG 112/10 (37.2)
PAK 37/1 (3.1)
P

Result: Pakistan won by 9 wickets

Scorecard: England vs Pakistan 3rd Test

South Africa Tour of Bangladesh (SA 101 – 7 Ban)

Series Result: South Africa win 2-0

Series TotalSessions WonSessions TiedH/A PointsBonus?Total
Ban (H)3 (6 Points)1007
SA (A)15 (30 Points)14822101

1st Test (Mirpur)

  • Sessions Won: Bangladesh – 3, South Africa – 6, Tied – 1
  • Ban Points: 7 Points (6 – Session Won, 1 – Tied)
  • SA Points: 47 Points (12 – Session Won, 1 – Tied, 10 – Bonus Points (5 sessions left), 24 – Away Win)
Session 1Session 2Session 3
Day 1BAN 60/6 (26.1)

S
BAN 106/10 (40.1)
SA 65/2 (16.0)
S
SA 140/6 (41.0)

B
Day 2SA 243/8 (71.0)

S
SA 308/10 (88.4)
BAN 19/2 (7.0)
S
BAN 101/3 (27.1)

B
Day 3BAN 201/6 (63.0)
S
BAN 267/7 (80.0)
B
BAN 283/7 (85.0)
T
Day 4BAN 307/10 (89.5)
S

Result: South Africa won by 7 wickets

Scorecard: South Africa vs Bangladesh 1st Test

2nd Test (Chattogram)

  • Sessions Won: South Africa – 9
  • Ban Points: 0 Points
  • SA Points: 54 Points (18 – Session Won Points, 12 – Bonus Points (6 sessions left), 24 – Away Win)
Session 1Session 2Session 3
Day 1SA 109/1 (28.0)
S
SA 205/1 (56.0)
S
SA 307/2 (81.0)
S
Day 2SA 413/5 (110.0)
S
SA 527/6 (135.0)
S
SA 575/6 (144.2)
BAN 38/4 (9.0)
S
Day 3BAN 137/8 (37.0)

S
BAN 159/10 (45.2)
BAN 43/4 (15.0)
S
143/10 (43.4)

S

Result: South Africa won by an innings and 273 runs

Scorecard: South Africa vs Bangladesh 2nd Test

New Zealand Tour of India (NZ 113 – 23 Ind)

Series Result: New Zealand win 3-0

Series TotalSessions WonSessions TiedH/A PointsBonus?Total
Ind (H)9 (18 Points)50023
NZ (A)16 (32 Points)57230139

1st Test (Bengaluru)

  • Sessions Won: India – 4, New Zealand – 5, Tied – 4
  • Ind Points: 20 Points (8 – Sessions Won Points, 4 – Tied)
  • NZ Points: 42 Points (10 – Session Won Points, 4 – Tied, 4 – Bonus Points (2 sessions left), 24 – Away Win)
Session 1Session 2Session 3
Day 1IND 0/0
T
IND 0/0
T
IND 0/0
T
Day 2IND 34/6 (23.5)

N
IND 46/10 (31.2)
NZ 82/1 (20.0)
N
NZ 180/3 (50.0)

N
Day 3NZ 345/7 (81.0)

T
NZ 402/10 (91.3)
IND 57/0 (15.0)
I
IND 231/3 (49.0)

I
Day 4IND 344/3 (71.0)

I
IND 438/6 (90.2)

I
IND 462/10 (99.3)
NZ 0/0 (0.4)
N
Day 5NZ 110/2 (27.4)
N

Result: NZ won by 8 wickets

Scorecard: New Zealand vs India 1st Test

2nd Test (Pune)

  • Sessions Won: India – 2, New Zealand – 7
  • Ind Points: 4 Points (4 – Session Won)
  • NZ Points: 50 Points (14 – Session Won Points, 12 – Bonus Points (6 sessions left), 24 – Away Win)
Session 1Session 2Session 3
Day 1NZ 92/2 (31.0)

N
NZ 201/5 (62.0)

N
NZ 259/10 (79.1)
IND 16/1 (11.0)
I
Day 2IND 107/7 (38.0)

N
IND 156/10 (45.3)
NZ 85/2 (20.0)
N
NZ 198/5 (53.0)

N
Day 3NZ 255/10 (69.4)
IND 81/1 (12.0)
I
IND 178/7 (40.0)

N
IND 245/10 (60.2)

N

Result: NZ won by 113 runs

Scorecard: New Zealand vs India 2nd Test

3rd Test (Wankhede)

  • Sessions Won: India – 3, New Zealand – 4, Tied – 1
  • Ind Points: 8 Points (6 – Session Won, 2 – Tied)
  • NZ Points: 48 Points (8 – Session Won Points, 2 – Tied, 14 – Bonus Points (7 sessions left), 24 – Away Win)
Session 1Session 2Session 3
Day 1NZ 92/3 (27.0)

T
NZ 192/6 (55.0)

N
NZ 235/10 (65.4)
IND 86/4 (19.0)
I
Day 2IND 195/5 (43.0)

I
IND 263/10 (59.4)
NZ 26/1 (9.0)
N
NZ 171/9 (43.3)

I
Day 3NZ 174/10 (45.5)
IND 92/6 (20.0)
N
121/10 (29.1)

N

Result: NZ won by 25 runs

Scorecard: New Zealand vs India 3rd Test

****

Let us know if you have any suggestions on how to improve the World Test Championship. Would love to hear them!

Thanks for reading!

If you enjoyed reading about WTC and how to fix problems in cricket, you may also like

© Copyright @Nitesh Mathur and Broken Cricket Dreams, LLC 2023. Originally published on 11/09/2024. Unauthorized use and/or duplication of this material without express and written permission from this site’s author and/or owner is strictly prohibited. Excerpts and links may be used, provided that full and clear credit is given to Broken Cricket Dreams with appropriate and specific direction to the original content (i.e. linked to the exact post/article).

Universe Conspires to Fulfill Devine’s Destiny: Personal Legend Realized After 14 Long Years

In The Alchemist, a young shepherd named Santiago from the Andalusian region of Spain leaves his simple life to chase a dream, which he calls his ‘Personal Legend.’

He embarks on a journey of self-discovery filled with unexpected twists and turns.

Along the way, he learns several life lessons. One of my favorites is,

“When you want something, all the universe conspires in helping you achieve it.”

– Paul Coelho, The Alchemist

****

New Zealand Lift the 2024 T20 Women’s World Cup

Just like Santiago, today we celebrate Sophie Devine’s incredible journey. After 14 long years, the universe has conspired to help Sophie Devine finally lift the T20 World Cup Trophy, this time as captain.

Remember, the White Ferns narrowly missed out on World cup glory in the inaugural 2009 and 2010 T20 World Cup editions.

What Happened in the 2010 T20 World Cup Final, You Ask?

14 years ago, the Boot Happened.

The Boot? Yes, the boot.

Specifically, Ellyse Perry’s boot.

5 runs needed in the final ball, 4 runs for a Super happen. Watch what happens yourself.

Sophie hit a crisp straight drive, only to be denied by Ellyse Perry.

She was stranded on 38*, just one hit away from a World Cup.

Sophie Devine must have been devastated. Unfortunately, it was not meant to be. In her own words,

“I have had nightmares about that Ellyse Perry right boot. Think we were so close in that match.”

– Sophie Devine

Two consecutive finals. So close, yet so far.

Also Read: What Can Ellyse Perry Not Do?

****

“It’s the Possibility of Having a Dream Come True That Makes Life Interesting”

One day Santiago dreams of finding a treasure in the pyramids of Egypt.

He doesn’t know how he will accomplish his journey, what path he will take, who he will meet along the way.

But he knows, he has to make this dream a reality.

****

Devine’s dream for a life in cricket can be traced back to 2000 when New Zealand won the 2000 ODI World Cup against Australia.

Her love for sports came through her dad, who was also her first coach. She grew up playing all sorts of different sports but cricket & field hockey took center stage as she entered university.

Although she did not make the field hockey Olympics team, Devine became a clutch player for New Zealand as a cricketer—holding her nerve in a Super Over alongside Suzie Bates, scoring a T20I century, dominated T20 World Cups, hitting five sixes in a row, scoring a 40-ball 93 in the 2017 ODI World Cup among others.

She became the White Ferns captain in 2020 during the form of her life and the 2024 T20 World Cup was to be her last T20 tournament as captain.

“It’s Only Those Who are Persistent, and Willing to Study Things Deeply, who Achieve the Master Work.”

Devine wasn’t always the power-hitting batter we now come to think of.

She actually burst onto the scene as a young 17-year old bowler who batted at #11.

In T20Is, she wouldn’t play a major match-winning innings until she was promoted to #4 in 2010, scoring 35 & 48 against Australia. She would score her first fifty in 2012. Devine didn’t even play a single ODI between 2010 and 2013. She would make an ODI comeback in 2013 and score her first ODI hundred, a magnificent 145, that too in a World Cup.

With the ball, she brought her best to the T20 World Cups – 3/18 and 4/22 (semi-final) in 2016, and 3/18 in the 2020 T20 World Cup.

Her evolution in turning herself into a dependable top order batter and one of the greatest all-rounders the world has ever seen is a testament to the hard work and dedication she put in to hone her craft.

Embed from Getty Images

****

The Crew

Nothing great is ever achieved alone.

Santiago found help in his journey—a merchant under whose tutelage he learned trade skills, a Gypsy who interpreted his dreams, an Englishman who knew alchemy, the love of his life in Fatima that gave him direction, a tribal chief, and many others who guided him along the way.

****

Devine similarly had a cast of members she could depend upon in the 2024 World Cup.

She embraced herself as one of the self-proclaimed ‘grandmas’ of the team. Alongside Devine were Suzie Bates, who became the most capped women’s player across formats (and fun fact, she also represented NZ in the 2008 Olympics as a basketball player) and Lea Tahuhu, once the fastest women bowler in the world.

They also had a cast of up and coming players such as Eden Carson, Georgia Plimmer, Brooke Halliday, Rosemary Mair, and a 24-year old Amelia Kerr who already has eight years of international cricket, an ODI double century, and (now) 188 international wickets to her name.

“The secret of life, though, is to fall seven times and to get up eight times.”

The senior trio must have known deep in their hearts that 2024 was their final chance.

Sophie Devine & Suzie Bates had fallen 8 consecutive times, and this was to be Tahuhu’s 5th T20 World Cup as well. Their recent T20 World Cup record didn’t ooze much confidence.

  • 2009 – Finals
  • 2010 – Finals
  • 2012 – Semi Finals
  • 2014 – Group Stage
  • 2016 – Semi Finals
  • 2018 – Group Stage
  • 2020 – Group Stage
  • 2023 – Group Stage

As Devine herself reflected after crashing out of the 2020 T20 World Cup, “It is a crappy feeling to miss out again.”

New Zealand’s Abysmal Recent Run

And there must have been some doubts creeping in as well.

After all, the White Ferns were coming off a 10-match losing streak.

Tahuhu’s economy in the previous 5 matches before the WC hovered between 8-12.5. Bates hadn’t made a half-century for 12 straight games even as an opener. Apart from two fifties, Devine had nothing to show with the bat with scores of 17, 0, 9, 5, 12, 4, and 5 in the entirety of 2024.

In any case, even after falling for eight times and the losing streak, they got up for a 9th time.

And as it would turn out, 9th time was the charm for Devine & Bates.

“Sometimes There is No Way to Hold Back The River”

So, how did the White Ferns manage to win the T20 World Cup against all odds?

Devine’s 57* and Mair’s 4/19 against India set the tone, but the World Cup victory was definitely a team effort.

Amelia Kerr’s historic all-round effort while limping in the final, en route to becoming the player of the tournament, was superhuman. Halliday’s impetus in the final, Tahuhu’s 1-run over that caused South Africa’s collapse, Eden Carson’s semi-final performance (and her interviews), the find of Georgia Plimmer, the spinners’ contribution, Gaze’s gaze behind the stumps, and Maddy Green’s catching, it all added up in the end.

No New Zealand batter made the Top 4 run scorer list (Bates & Plimmer were NZ’s best with 150 runs each at joint #5). With the ball, Kerr was #1 (15 wickets), with plenty of support from Mair (10) and Carson (9).

Fielding was a hallmark of New Zealand’s campaign in an otherwise low catching standard for a World Cup. Bates (7 catches), Maddy Green (6), and Devine (5) dominated the catching charts.

Devine doesn’t necessarily like the cringy ‘Devine intervention’, but this time, maybe it was divine intervention.

Sometimes, what is bound to happen will happen. Sometimes there is no way to hold back the river.

What Can We Learn from Sophie Devine and the White Ferns?

After narrowly missing on the 2010 T20 World Cup win and consecutive World Cup defeats, Devine and Bates never gave up. Sometimes the universe does conspire to reward those who refuse to quit.

I’ll leave you with a final Alchemist quote,

“People are capable, at any time in their lives, of doing what they dream of.”

– Paul Coelho, The Alchemist

It doesn’t matter whether you are beginning your career or are towards the close. It is never too late to dream. Keep on dreaming even if it looks like the hope is fading away.

This is a remarkable victory, one of the greatest in New Zealand’s sporting history for sure. Remember though, more than winning, the journey is important, as it was in both Santiago & Devine’s cases. In Devine’s own words,

“I have played for 17-18 years now. It [World Cup win] will be something that will come with so much loss and hard times but also incredible memories and people along the way.”

– Sophie Devine

And why not end it with my favorite clip of the 2024 T20 World Cup?

****
Thank you for reading, hope you enjoyed it!

If you liked this article, you may also enjoy:

© Copyright @Nitesh Mathur and Broken Cricket Dreams, LLC 2023. Originally published on 10/30/2024. Unauthorized use and/or duplication of this material without express and written permission from this site’s author and/or owner is strictly prohibited. Excerpts and links may be used, provided that full and clear credit is given to Broken Cricket Dreams with appropriate and specific direction to the original content (i.e. linked to the exact post/article).

The Only 2024 Women’s T20 World Cup Preview You Need: Can Australia Be Stopped?

The 2024 T20 World Cup is around the corner and only question is in everyone’s mind—Can the mighty Australians be defeated?

In 8 T20 World Cups so far, they have won six, were runners-up and semi-finalists in the other two. West Indies & England are the only other two winners, although India & South Africa have upped their credentials recently in the shortest international format.

The World Cup has been moved from Bangladesh to the UAE, and Scotland are the newest entrants in the Women’s T20 World Cup.

The format? 10 Teams, 2 Groups of 5 followed by semi-finals and a final:

  • Group A: Australia, India, New Zealand, Pakistan, Sri Lanka
  • Group B: Bangladesh, England, Scotland, South Africa, West Indies

I went through all 150 players’ ESPNCricinfo profile pages and accumulated this data so you don’t have to. Without further ado, here is a quick snapshot of what you can expect in the Women’s 2024 T20 World Cup.

Key Takeaways

  • Bangladesh & Scotland are fielding the youngest units (averaging the age of 25), while Sri Lanka (30) and West Indies (29) have the oldest average age.
  • Australia has the most experienced squad averaging about 66 matches per player, while Scotland has the least experience, averaging 33 matches per player.
  • India has the highest total number of runs scored (13,820) followed closely by Australia (12,163), England (11,769), and New Zealand (11,376).
  • West Indies and Sri Lanka have the highest total number of wickets taken (592 each), while Scotland (261), Bangladesh (302), Pakistan (389), and India (421) have the lowest.
  • Australia have won each of their last 10 T20Is, England has won 9/10, and New Zealand has lost all 10 out of 10.

Here is a quick statistical glance at each team separated by groups.

Table of Contents

Jump to the preview of the team you want to look into or predictions at the very bottom.

2024 T20 Women’s Cricket World Cup: The Ultimate Preview

*Note: The average T20I experience and average age are rounded up.

1. Australia T20 World Cup Preview

  • World Cup History: SF, Won, Won, Won, Runners-Up, Won, Won, Won
  • Last 10 Matches (Most Recent First): WWWWWWWWWW
  • Group Stage Opponents (In Order): SL, NZ, Pak, Ind

Australia Team Characteristics

Average T20I Experience66 Matches
(980 among 15 players)
Average Age28
Total T20I Runs12,163
Total T20I Wickets568
# of Left Handed Batters in Top 8 2
# of Bowling Options12
(7 Right Arm Pace, 2 Off Spin, 2 Leg Spin, 1 Left Arm Spin)
# of Keeping Options2

Strengths

The Australian all-rounders are the envy of the world: Ellyse Perry, Tahlia McGrath, and Ash Gardner to name a few. Key to Australia’s bowling strategies, they are also the engine room. Time and time again, rescuing Australia or providing the big finishes. And in case any of them have to be left of the XI, Annabel Sutherland is waiting in the wings. Amazing depth!

Weaknesses

Will the lack of Meg Lanning leave a whole in the middle order? Also, how will Healy take the pressure of T20 World Cup captaincy? Also the heat in the UAE has been a talking point leading up to the makeshift World Cup in the UAE.

Look Out for

  • With the Ball: Sophie Molineux. Her spin will be crucial to keeping the run rate down in UAE conditions.
  • With the Bat: Phoebe Litchfield. This 21-year old future star is averaging 42.5 and striking at 158.38 in her 10 inning T20I career so far.

Squad: Alyssa Healy (WK/C), Beth Mooney (WK), Phoebe Litchfield, Ashleigh Gardner, Kim Garth, Grace Harris, Alana King, Tahlia McGrath, Ellyse Perry, Annabel Sutherland, Darcie Brown, Sophie Molineux, Megan Schutt, Tayla Vlaeminck, Georgia Wareham

Expected Starting XI: 1. Healy (C), 2. Mooney, 3. Perry, 4. Gardner, 5. Litchfield, 6. McGrath, 7. Wareham, 8. Sutherland, 9. Molineux, 10. Schutt, 11. Brown

Embed from Getty Images

2. Bangladesh T20 World Cup Preview

  • World Cup History: Round 1*, Round 1, Round 1, Round 1, Round 1
  • Last 10 Matches: LWWLLLLLLL
  • Group Stage Opponents: Sco, Eng, WI, SA

*qualified for the first time in 2014

Bangladesh Team Characteristics

Average T20I Experience42
(619 among 15 players*)
Average Age25
Total T20I Runs4,944
Total T20I Wickets302
# of Left Handed Batters in Top 8 1
# of Bowling Options9 (4 Right Arm Pace, 3 Leg Spin, 1 Left Arm Spin, 1 Off Spin)
# of Keeping Options1

Fun Fact: 2 Debutants in the Squad

Strengths

Sultana is carrying some form from the Asia Cup—48*(59), 62*(37), and 32 (51).

Weaknesses

After the Asia Cup, Bangladesh made five changes to the World Cup squad with Rumana Ahmed, Rubya Haider, Ishma Tanjim, Sabikun Nahar, and Shorifa Khatun dropped. Unsettled squad is not a good sign going to a world cup. Also the noise outside of cricket may affect the players. With the revolution in Bangladesh and the WC moved out from Bangladesh to the UAE, things are all over the place for the Tigers currently.

Look Out for

  • With the Ball: Jahanara Alam, one of the faster bowlers in women’s cricket, can she make use of the UAE pitches to the fullest?
  • With the Bat: Nigar Sultana. Captain will have to lead from the front if Bangladesh has any chance.

Squad: Nigar Sultana (C), Dilara Akter (WK), Sobhana Mostary, Murshida Khatun, Shathi Rani, Taj Nehar, Disha Biswas, Rabeya Khan, Ritu Moni, Shorna Akter, Fahima Khatun, Jahanara Alam, Marufa Akter, Nahida Akter, Sultana Khatun

Expected Starting XI: 1. D Akter, 2. M Khatun, 3. Mostary, 4. Sultana (WK), 5. Nehar, 6. S Akter, 7. R Moni, 8. R Khan, 9. N Akter, 10. Alam, 11. S Khatun

Embed from Getty Images

3. England T20 World Cup Preview

  • World Cup History: Won, Round 1, Runners-Up, Runners-Up, SF, Runners-Up, SF, SF
  • Last 10 Matches: LWWWWWWWWW
  • Group Stage Opponents: Ban, SA, Sco, WI

England Team Characteristics

Average T20I Experience60
(890 Matches Among 15 Players)
Average Age26
Total T20I Runs11,769
Total T20I Wickets474
# of Left Handed Batters in Top 8 1
# of Bowling Options12 (3 Right Arm Pace, 1 Left Arm Pace, 2 Left Arm Spin, 4 Off Spin, 2 Leg Spin)
# of Keeping Options2

Strengths

Momentum. England have won 9 out of their 10 recent T20Is, although they lost the most recent one against IrelandA team that did not qualify for the T20 World Cup. Another strength is the core experience in Danni Wyatt, Heather Knight, Amy Jones, and Nat Sciver-Brunt.

Weaknesses

The lower middle order has not had much of an opportunity.

Look Out for

  • With the Ball: Sophie Ecclestone and Lauren Bell. Ecclestone has been at her economical best this year: 4.75, 7.5, 4.25, 3.88, 4.75, 9.0, 8.5, 6.25, 4.0, 7.5. Bell has taken 2 wickets or more in six of her last T20Is.
  • With the Bat: Sophia Dunkley is the next big player in England cricket. She has already proved her credentials in ODIs. Can he make her name in the shortest format?

Injury News

Squad: Heather Knight (C), Maia Bouchier, Sophia Dunkley, Bess Heath (WK), Amy Jones (WK), Danni Wyatt, Alice Capsey, Charlie Dean, Danielle Gibson, Sarah Glenn, Freya Kemp, Nat Sciver-Brunt, Lauren Bell, Sophie Ecclestone, Linsey Smith

Expected Starting XI: 1. Wyatt, 2. Dunkley, 3. Capsey, 4. Sciver-Brunt, 5. Knight (C), 6. Jones (WK), 7. Gibson, 8. Ecclestone, 9. Glenn, 10. Smith, 11. Bell

Embed from Getty Images

4. India T20 World Cup Preview

  • World Cup History: SF, SF, Round 1, Round 1, Round 1, SF, Runners-Up, SF
  • Last 10 Matches: LWWWWW(NR)LWW
  • Group Stage Opponents: NZ, Pak, SL, Aus

India Team Characteristics

Average T20I Experience64
(959 Matches Among 15 Players)
Average Age27
Total T20I Runs13,820
Total T20I Wickets421
# of Left Handed Batters in Top 83
# of Bowling Options12 (3 Right Arm Fast, 1 Left Arm Spin, 1 Leg Spin, 7 Off Spin)
# of Keeping Options2

Strengths

The opening pair. Mandhana is striking at 122.82 at an average of 45 this year with fifties, while Shafali is averaging 36.16, striking at 132.72, and has 3 fifties, including an 81.

Weaknesses

Potentially unsettled batting order. In the last few matches, India have had a flexible middle order, which can both be a good or bad thing. Finalizing Rodrigues & Deepti Sharma’s batting position will do India a world of good. Deepti’s finish in the Hundred final was one for the ages.

Look Out for

  • With the Ball: Radha Yadav. This tournament might be one for left arm spinners in the UAE, and Radha Yadav is no exception.
  • With the Bat: Jemimah Rodrigues. She has already played a T20Is at the age of 24. Strike rate is at the lower end of 114.26, but is averaging 30.5 with 11 fifties, the glue that keeps the batting order together.

Squad: Harmanpreet Kaur (C), Smriti Mandhana, Yastika Bhatia (WK), Richa Ghosh (WK), Dayalan Hemalatha, Jemimah Rodrigues, Shafali Verma, Shreyanka Patil, Sajeevan Sajana, Deepti Sharma, Asha Sobhana, Arundhati Reddy, Renuka Singh Thakur, Pooja Vastrakar, Radha Yadav

Expected Starting XI: 1. Verma, 2. Mandhana, 3. Bhatia/Hemalatha, 4. Kaur (C), 5. Rodrigues, 6. Ghosh (WK), 7. Sharma, 8. Vastrakar, 9. Yadav, 10. Thakur, 11. Reddy

Embed from Getty Images

5. New Zealand T20 World Cup Preview

  • World Cup History: Runners-Up, Runners-Up, SF, Round 1, SF, Round 1, Round 1, Round 1
  • Last 10 Matches: LLLLLLLLLL
  • Group Stage Opponents: Ind, Aus, SL, Pak

New Zealand Team Characteristics

Average T20I Experience60
(891 Matches Among 15 Players)
Average Age27
Total T20I Runs11,376
Total T20I Wickets549
# of Left Handed Batters in Top 81
# of Bowling Options13 (8 Right Arm Fast, 3 Off Spin, 1 Left Arm Spin, 1 Leg Spin)
# of Keeping Options1

Strengths

Suzie Bates. One of the greatest of all-time, Bates has given NZ decent this year: 43, 38, 16, 16, 33, 34, 19. Can she convert and play the match winning innings?

Weaknesses

New Zealand has been in complete disarray recently. Have not qualified for the semi-finals in the last 3 T20 World Cups and have lost all of their last 10 T20Is. The experienced Sophie Devine isn’t standing up consistently with the bat. Apart from the two fifties this year, she has scores of 17,0,9,5,12,4, and 5.

Look Out for

  • With the Ball: Amelia Kerr. Just watch her googlies. Talent for the ages.
  • With the Bat: Amelia Kerr. Also has a 232 in her name in ODI cricket. Can do everything.

Squad: Sophie Devine (C), Isabella Gaze (WK), Maddy Green, Georgia Plimmer, Suzie Bates, Brooke Halliday, Amelia Kerr, Eden Carson, Fran Jones, Leigh Kasperek, Jess Kerr, Rosemary Mair, Molly Penfold, Hannah Rowe, Lea Tahuhu

Expected Starting XI: 1. Bates, 2. Plimmer, 3. Devine (C), 4. A Kerr, 5. Halliday, 6. Green, 7. Gaze (WK), 8. Kasperek, 9. Mair, 10. J Kerr, 11. Tahuhu

Embed from Getty Images

6. Pakistan T20 World Cup Preview

  • World Cup History: Round 1 (all 8 times)
  • Last 10 Matches: LWLLWWLLLL
  • Group Stage Opponents: SL, Ind, Aus, NZ

Pakistan Team Characteristics

Average T20I Experience51
(761 Matches Among 15 Players)
Average Age27
Total T20I Runs7,056
Total T20I Wickets389
# of Left Handed Batters in Top 81
# of Bowling Options11 (4 Right Arm Fast, 1 Left Arm Fast, 2 Leg Spin, 2 Left Arm Spin, 2 Off Spin)
# of Keeping Options2

Strengths

The Top 4. In the 3 matches Pakistan has won in their 10 matches, they have chased 87, chased 107 against UAE without loss (Feroza 62*, Ali 37*), and put up 181 against South Africa (Ali 45, Amin 28, Dar 29, Sana 37*).

Weaknesses

Apart from Sadia Iqbal (who has 24 wickets this year), there are no other standout performers: Nida Dar (13), Sana (7), Sandhu (7), Hassan (7), Baig (6).

Look Out for

  • With the Ball: Nida Dar. The stalwart is no longer the captain, but still the heart of the team. Has scored a few 20s recently, but can she convert it to 40s or 50s?
  • With the Bat: Sadia Iqbal. Another left arm spinner to look out for. Has taken 42 wickets in the last two years. Her bowling strike rate this year is 14.5, down from 22 and 24 in the previous two years.

Squad: Fatima Sana (C), Gull Feroza (WK), Iram Javed, Muneeba Ali (WK), Omaima Sohail, Sadaf Shamas, Sidra Amin, Aliya Riaz, Nida Dar, Syeda Aroob Shah, Diana Baig, Nashra Sandhu, Sadia Iqbal, Tasmia Rubab, Tuba Hassan

Reserves: Najiha Alvi (WK) – Traveling, Rameen Shamim, Umm-e-Hani

Expected Starting XI: 1. Ali (WK), 2. Feroza, 3. Amin, 4. Dar, 5. Sana (C), 6. Riaz, 7. Hassan, 8. Shamas, 9. Iqbal, 10. Sandhu, 11. Baig

Embed from Getty Images

7. Scotland T20 World Cup Preview

  • World Cup History: Qualified for the first time in 2024
  • Last 10 Matches: WWLWWWLW(NR)(NR)
  • Group Stage Opponents: Ban, WI, SA, Eng

Scotland Team Characteristics

Average T20I Experience33
(494 Matches Among 15 Players)
Average Age25
Total T20I Runs5,024
Total T20I Wickets261
# of Left Handed Batters in Top 80
# of Bowling Options12 (6 Right Arm Fast, 1 Left Arm Fast, 1 Leg Spin, 4 Off Spin)
# of Keeping Options1

Strengths

Rising confidence led by the in-form captain, Kathryn Bryce. Scotland is coming off a win against Pakistan in the warm-up matches, a win against England, and most importantly, qualifying for the first time. Also, their schedule is in increasing difficulty: Bangladesh, WI, SA, and England. They may be favorites against Bangladesh and if they can surprise West Indies, you just never know.

Weaknesses

Lack of left handers in the batting order and no left-arm spin options..

Look Out for

  • With the Ball: Abtaha Maqsood, the leg spinner. Has been consistently among the wickets in the last 3 years, taking 9,10, and 9 wickets respectively. Her economy in 2023 was a miserly 4.86.
  • With the Bat: Saskia Horley. Across formats, Horley has been in tremendous form, scoring 100, 71, and 43 in ODIs, and following it up with a 48 in the T20 warm-up against Pakistan.

Squad: Kathryn Bryce (C), Sarah Bryce, Ailsa Lister, Olivia Bell, Darcey Carter, Katherine Fraser, Saskia Horley, Abtaha Maqsood, Rachel Slater, Chloe Abel, Abbi Aitken-Drummond, Priyanaz Chatterji, Lorna Jack, Megan McColl, Hannah Rainey

Expected Starting XI: 1. Horkley, 2. S Bryce, 3. K Bryce, 4. McColl, 5. Lister, 6. Chatterji, 7. Jack, 8. Fraser, 9. Slater, 10. Rainey, 11. Maqsood

Embed from Getty Images

8. South Africa T20 World Cup Preview

  • World Cup History: Round 1, Round 1, Round 1, SF, Round 1, Round, SF, Runners-Up
  • Last 10 Matches: WLWL(NR)WLLLL
  • Group Stage Opponents: WI, Eng, Sco, Ban

South Africa Team Characteristics

Average T20I Experience52
(772 Matches Among 15 Players)
Average Age27
Total T20I Runs8,733
Total T20I Wickets352
# of Left Handed Batters in Top 8 0
# of Bowling Options11 (6 Right Arm Fast, 2 Left Arm Spin, 2 Leg Spin, 1 Off Spin)
# of Keeping Options2

Strengths

South Africa’s batting order is one of the bests in the world. Starting from the captain, Wolvaardt-Brits all the way down to Kapp-Luus-Tryon. Annerie Dickerson who scored 44*(23) in her last outing, might not even start since Kapp is back.

Weaknesses

Lack of left handers in the batting order. Also, how will South Africa cope without Shabnim Ismail?

Look Out for

  • With the Ball: Marizanne Kapp. As the tournament approaches the latter part, Kapp’s importance increases. Her ability to set the tone with economical spells up front can set the tone for South Africa.
  • With the Bat: Chloe Tryon. One of the best finishers in the game and a complete all-rounder, watch out for Tryon if matches get close.

Squad: Laura Wolvaardt (C), Tazmin Brits, Mieke de Ridder (WK), Sinalo Jafta (WK), Anneke Bosch, Nadine de Klerk, Annerie Dercksen, Marizanne Kapp, Sune Luus, Seshnie Naidu, Chloe Tryon, Ayanda Hlubi, Ayabonga Khaka, Nonkululeo Mlaba, Tumi Sekhukune

Expected Starting XI: 1. Wolvaardt (C), 2. Brits, 3. Bosc, 4. Kapp, 5. Mlaba, 6. Tryon, 7. Jafta (WK), 8. de Klerk, 9. Mlaba, 10. Khaka, 11. Sekhukune

Embed from Getty Images

9. Sri Lanka T20 World Cup Preview

  • World Cup History: Round 1 (all 8 times)
  • Last 10 Matches: LWWWWWWLLW
  • Group Stage Opponents: Pak, Aus, Ind, NZ

Sri Lanka Team Characteristics

Average T20I Experience64
(959 Matches Among 15 Players)
Average Age30
Total T20I Runs9,074
Total T20I Wickets592
# of Left Handed Batters in Top 83
# of Bowling Options11 (3 Right Arm Fast, 1 Left Arm Fast, 3 Off Spin, 3 Left Arm Spin, 1 Left Arm Wrist Spin)
# of Keeping Options1

Fun Fact: Sri Lanka are simultaneously fielding the oldest player in the tournament (Udeshika – 39) and the youngest (Shashini – 15).

Strengths

The Asia Cup win would have been a huge boost to Sri Lanka’s confidence. Chasing 167 in a final and winning with 8 balls and 8 wickets to spare is a wonderful achievement!

Weaknesses

The lower middle order. While Gunaratne-Samarawickrama-Athapaththu, and Dilhari make up a strong Top 4, if they were to collapse, Sri Lanka would have a tough time coming back into the game.

Look Out for

  • With the Ball: Udeshika Prabodhani. With 80 wickets at 22.41 average, it is a pretty impressive accomplishment for a left arm medium.
  • With the Bat: Cannot look past Chamari Athapaththu. In Asia Cup, she had scores of 119*(69), 49*(35), 63 (48), and 61 (43).

Squad: Chamari Athapaththu (C), Vishmi Gunaratne, Harshitha Samarawickrama, Hasini Perera, Anushka Sanjeewani (WK), Nilakshika Silva, Kavisha Dilhari, Ama Kanchana, Inoshi Priyadharshani, Achini Kulasuriya, Sugandika Kumari, Udeshika Prabhodhani, Inoka Ranaweera, Shashini Gimhani, Sachini Nisansala

Expected Starting XI: 1. Gunaratne, 2. Athapaththu (C), 3. Samarawickrama, 4. Dilhari, 5. Perera (WK), 6. N Silva, 7. Kanchana, 8. Nisansala, 9. Priyadharshani, 10. Kumari, 11. Gimhani

Embed from Getty Images

10. West Indies T20 World Cup Preview

  • World Cup History: Round 1, SF, SF, SF, Won, SF, Round 1, Round 1
  • Last 10 Matches: WWLWLWWWLW
  • Group Stage Opponents: SA, Sco, Ban, Eng

West Indies Team Characteristics

Average T20I Experience57
(845 Matches Among 15 Players)
Average Age29
Total T20I Runs11,283
Total T20I Wickets490
# of Left Handed Batters in Top 81
# of Bowling Options15 (6 Right Arm Fast, 1 Left Arm Fast, 5 Off Spin, 2 Left Arm Spin, 1 Legspin)
# of Keeping Options2

West Indies also has two debutants in their squad.

Strengths

Versatility in this team. All 15 players in the squad can roll their arms. Campbelle & Nation can do the third skill of keeping as well.

Weaknesses

Will Deandra Dottin’s unretirement cause issues in the settled lineup or in the dressing room?

Look Out for

  • With the Ball: Afy Fletcher. Her last 6 T20I figures read: 2/31, 0/15, 1/36, 2/29, 4/23, 2/25. She is giving WI wickets at regular intervals.
  • With the Bat: The Entire Top Order, Matthews, Dottin, Campbelle, Stefanie Taylor. What a brilliant four.

Squad: Hayley Matthews (C), Shemaine Campbelle, Chinelle Henry, Chedean Nation, Deandra Dottin, Mandy Mangru, Ashmini Munisar, Stafanie Taylor, Zaida James, Aaliyah Alleyne, Shamilia Connell, Afy Fletcher, Qiana Joseph, Karishma Ramharack, Nerissa Crafton

Expected Starting XI: 1. Matthews (C), 2. Dottin, 3. Campbelle (WK), 4. Taylor, 5. Nation, 6. Henry, 7. Alleyne, 8. Fletcher, 9. Fraser, 10. Ramharack, 10. Connell, 11. Ramharack.

Embed from Getty Images

Injury News and Broken Dreams

Injury News

  • Ash Gardner & Georgia Wareham are both cleared after they suffered concussions due to a clash in warm up drills.
  • Darcie Brown has recovered from foot stress fracture.

Broken Dreams

  • Final T20 World Cup for the likes of Ellyse Perry, Alyssa Healy, Nida Dar, Heather Knight, Stefanie Taylor, and Harmanpreet Kaur?
  • Stalwart Jess Jonassen was left out of the squad even though Healy mentioned there was a small window of hope of her comeback if things change a few days before the World Cup.
  • Kate Cross and Tammy Beaumont, England legends and mainstays in the ODI squad, have been left out of the T20 World Cup squad. Shabnim Ismail had already retired, marking a few years of transition to come in women’s cricket.

BCD’s 2024 T20 World Cup Predictions

Finally, let’s get to the predictions!

CategoryTeam/Player
WinnerEngland
Runners UpSouth Africa
Broken DreamsIndia, Australia, Another Heartbreak for South Africa?
Most RunsLaura Wolvaardt
Most WicketsSophie (Molineux & Ecclestone)
Player of the TournamentSophie Ecclestone
Surprising FactorScotland Wins At Least One Match, Sri Lanka Get to #3 in the Group

****

Thank you for reading! Comment below, what are your predictions for this T20 World Cup?

If you like reading about Women’s Cricket, you may also like:

© Copyright @Nitesh Mathur and Broken Cricket Dreams, LLC 2023. Originally published on 09/29/2024. Unauthorized use and/or duplication of this material without express and written permission from this site’s author and/or owner is strictly prohibited. Excerpts and links may be used, provided that full and clear credit is given to Broken Cricket Dreams with appropriate and specific direction to the original content (i.e. linked to the exact post/article).

How Expensive is to Watch a Cricket Match Live Around the World? Average Cricket Ticket Prices

There is nothing more depressing in cricket than to watch an enthralling Test match with the unfortunate backdrop of an empty stadium.

Most recently, the England-Sri Lanka Test series came under scanner for unaffordable prices for Day 4 that started at about £95 and ranged up to £140. It was estimated that around “9,000 people turned up to a venue that holds more than 30,000.”

That got me thinking—How expensive is it to watch cricket around the world?

To conduct this analysis, I went through the checkout process and attempted to buy tickets for different types of matches in the first 10 Test playing nations.

If you would like to listen to an engaging conversational AI generated podcast about this article, check this out.

Key Takeaways

  • England & Australia are the most expensive places to watch cricket (they also have the most opportunities to watch along with India). Ticket prices can range from $185-1400 in a season for England to watch a couple of days of Tests, a few County matches, a few Hundred & Vitality Blast games, and 2-3 limited over internationals.
  • On the other hand, in Bangladesh, Sri Lanka, and Zimbabwe, a fan can watch matches for as low as $1 USD and can watch several games in a season for about $100 on the higher end.
  • Watching domestic cricket is completely FREE in India, New Zealand, and South Africa (both List A & 4-day). All you need to do is show up at the stadium (So GO, what are you waiting for?)
Embed from Getty Images

Cost of Watching Cricket: Most Expensive Places to Watch Cricket Around the World

We will provide ranges and consider a few different categories (if data is available):

  • Limited Over Internationals (LOI) – both men’s & women’s
  • Test Matches
  • Domestic Competitions
  • Franchise Leagues

For the sake of the cost comparison, we will be looking at General Admission ticket for Adult guests (in some countries like England, ‘members’ of the club receive discounted prices given that they have paid the annual membership fee). This analysis does not include member prices, bundles, or other discounts (or service/handling fees & taxes).

To make a relative comparison, we will also looked at the data for monthly cost of living data according to World Population Review, the inflation rate on average consumer prices (annual percent change) by the International Monetary Fund (IMF), and the average monthly net salary by Numbeo (the average salary is likely higher than the median salary).

Note: These are ballpark ranges. Ticket prices may vary based on the match (for example, knockout and Finals matches may be more expensive) and the stadium.

Also Read: Major League Cricket: Where to Buy Major League Cricket (MLC) 2023 Tickets?, Top 11 Richest Cricket Leagues (By Average Salaries)

1. England ($260-1400)

If a spectator in England watched 2 days of a men’s Test, 5 County games, 1 men’s international, 2 Vitality Blast matches, 2 Hundred matches, 1 ODI cup, one women’s international, and 1 Women’s Hundred match in a season, they would spend (on tickets alone) between $260-$504 depending on the stadium and up to $1393.3 if they only chose premium seating.

  • Monthly Cost of Living: $1929
  • Average Monthly Net Salary: $3288.55
  • Annual Inflation Rate: 2.5%
  • Estimated Monthly Savings: $1359.55
  • Percent of Savings Spent on Cricket (Live): 4.54%-34.16%

(Calculation Example: $185/3 months ~= 61.67/1359.55 ~= 4.54%)

*These economic numbers are for the United Kingdom as a whole, not just England.

Type of MatchGeneral Admission Ticket Price (Adult)Premium Tickets
A Day of a Test£38-85 ($50.6-113.1)£95-145 ($126.6-192.9)
Men’s LOI£20-40 ($26.6)£135 ($179.9)
Women’s LOI£5-10 ($6.7-13.3)£65 ($86.6)
County£6-15 ($8.0-20.0)£23 ($30.6)
Vitality Blast£15-25 ($20-33.3)£150 ($199.5)
The Hundred£11 ($14.7)£35 ($46.6)
One Day Cup£5-20 ($6.7-26.6)£37 ($49.2)
*These are ticket prices for non-members

How Did We Estimate the Ticket Price Range?

The international costs above are estimated from the upcoming England-Zimbabwe Test, India-England Women T20I series, and the men’s South Africa-England series, while the domestic costs are a ballpark number based on perusing several County’s websites.

Note: The prices for domestic price tickets in England vary vastly based on the County/stadium. For example, Kia Oval is at the more expensive side: £15-20 for County Championship matches, £32-40 for Vitality Blast, £40-85 for a men’s T20I, £18-30 for a women’s T20I, and £85-145 for a Test match.

The MCC is now reviewing the ticket pricing structure after the widespread empty stands.

Other Costs: Car Parking (£5+), Guided Tours: (£0-30), Full Season Membership (£240-270), Food, Drinks, Concessions (varies)

Where To Buy Tickets: Tickets can be purchased on the County, stadium, or ECB website. For international matches, you have to enter a ballot and hence, may not be guaranteed a ticket if there is high demand.

Exchange Rate: £1 = $1.33 (As of 9/22/2024)

Sources: Trent Bridge Tickets, England vs Zimbabwe 2025, India-England Women’s T20I, SA-Eng 2025 Tickets, County Championship, One Day Cup Final, The Hundred Pricing, Hampshire Ticket Prices, Essex Ticket Prices

Embed from Getty Images

2. Australia ($180-$900)

If a cricket fan in Australia went to watch 2 days of a men’s Test, 1 ODI, 1 Sheffield Shield match, 2 BBL matches, one women’s international, and 1 WBBL match in a season, they would spend (on tickets alone) at least $180 AUD ($122.6 USD) and as much as $900 $(613 USD) if they chose the premium seating.

  • Monthly Cost of Living: $1,944
  • Average Monthly Net Salary: $3,819.73
  • Annual Inflation Rate: 3.5%
  • Estimated Monthly Savings: $1875.73
  • Percent of Savings Spent on Cricket (Live): 2.2%-10.89%

Day 4 Tickets: For the Boxing Day Test MCG, the General Admission has a starting price for $30 with reserve stands as high as $85.

Type of MatchGeneral Admission Ticket Price (Adult)Premium Tickets/Lounge/SkyDeck
A Day of a Test$30 AUD ($20.4 USD)$170 AUD ($115.8 USD)
Men’s LOI$30 ($20.4)$170 ($115.8)
Women’s LOI$20 ($13.6)
Domestic Cricket$10 ($6.8)
Franchise Cricket (BBL)$27.5 ($18.7)$165 ($112.4)
WBBL$10 ($6.8)

*Note: For some Tests (for example, Adelaide BGT, there are ‘Twilight Adult’ prices if the entry is after 5 PM at a discounted price of $22.5).

Exchange Rate: $1 AUD = $0.68 USD

Sources/Where to Buy Tickets: Cricket.com.au, Sheffield Shield Ticket Prices, Big Bash Tickets

Embed from Getty Images

3. New Zealand ($109-160)

Watching 2 days of a Test, 2 SuperSmash matches, a men’s limited overs game, and a women’s limited over game can cost anywhere between $109 to $160 in a season.

  • Monthly Cost of Living: $1782
  • Average Monthly Net Salary: $3156.96
  • Annual Inflation Rate: 3.1%
  • Estimated Monthly Savings: $1,374.96
  • Percent of Savings Spent on Cricket (Live): 1.96%-2.81%
Type of MatchGeneral Admission Ticket Price (Adult)Premium Tickets
A Day of a Test$45 NZD ($28 US)$70 NZD ($43.6)
Men’s LOI$35 ($21.8)$65 ($40.5)
Women’s LOI$20 ($12.5)
Domestic CricketFREE
SuperSmash$15 ($9.4)

*Note: A Test Match Pass (all 5 days) can be purchased, which ranges from $145-220 NZD.

Entry to Plunkett Shield (first class) and Ford Trophy (List A) are free.

Exchange Rate: $ 1 NZD = $0.62 USD

Where to Get NZC Tickets & Sources: NZC Ticket Pricing Summary, NZC Test Tickets, NZ-SL T20 Tickets, SuperSmash Ticket Prices NZ, NZ Domestic Cricket Tickets

Embed from Getty Images

4. West Indies ($59-564)

Watching 2 days of a men’s Test, 1 ODI, and 2 CPL matches in the Caribbean would cost between $59-564 over the course of a season.

  • Monthly Cost of Living: $979 (Trinidad & Tobago), $1,153 (Saint Lucia), $803 (Guyana), $1,145 (Saint Kitts & Nevis), $1,465 (Antigua & Barbuda), $829 (Jamaica), $1,258 (Barbados)
  • Average Monthly Net Salary: $1470.64 (T & T), $1295 (St. Lucia)
  • Annual Inflation Rate: 1.5% (T&T), 1.8% (St. Lucia), 2.5% (St. K&N) 2.6% (A&B)
  • Estimated Monthly Savings: $100-500

*The savings, cost of living, and salary varies from nation to nation in the Caribbean

Type of MatchGeneral Admission Ticket Price (Adult)Premium Tickets
A Day of a Test$10$50
Men’s LOI$15$100
CPL$12$182

Sources: West Indies Cricket Tickets, CPL Tickets, India-WI Test 2023

Embed from Getty Images

5. South Africa ($44-89)

Two days of a men’s Test, 1 Men’s ODI, 1 Women’s ODI, and 2 SA20 matches in Bangladesh would cost a spectator somewhere in the range of $44-89 in one season.

  • Monthly Cost of Living: $974
  • Average Monthly Net Salary: $1446.04
  • Annual Inflation Rate: 4.9%
  • Estimated Monthly Savings: $472.04
  • Percent of Savings Spent on Cricket (Live): 3.1%-6.3%
Type of MatchGeneral Admission Ticket Price (Adult)Premium Tickets
A Day of a TestZAR 190 ($10.9)ZAR 230 ($13.2)
Men’s LOIZAR 160 ($9.2) ZAR 350 ($20.1)
Women’s LOIZAR 25 ($1.4)ZAR 80 ($4.6)
Domestic CricketFREE
SA20ZAR 100 ($5.7)ZAR 330 ($19)

Exchange Rate: $1 USD = 17.4 ZAR

Sources: South Africa-Pakistan Test, SA-Pak T20, Women’s ODI Prices, SA20 Qualifier Prices, CSA 4-day

Embed from Getty Images

6. India ($30-294)

In India, watching 2 days of a men’s Test, 1 ODI, 2 IPL matches, 1 women’s international, and 1 WPL match in a season, would cost (on tickets alone) between $30-140 on the lower end and about $294 on the higher end over a season. Keep in my end, that or certain IPL teams like RCB, tickets can go as high as $634 alone!

  • Monthly Cost of Living: $423
  • Average Monthly Net Salary: $633.49
  • Annual Inflation Rate: 4.6%
  • Estimated Monthly Savings: $210.49
  • Percent of Savings Spent on Cricket (Live): 14.25%+

*This is a bit skewed since population of India has widespread economic disparity. Those who can probably afford to purchase tickets are the only ones that would purchase those premium/VIP tickets.

Type of MatchGeneral Admission Ticket Price (Adult)Premium/VIP
A Day of a TestINR 125-200 ($1.5-2.4)INR 1000-2000 ($12-24)
LOIINR 750 ($9)INR 10000 ($119.8)
Women’s InternationalFREE*INR 150 ($1.8)
Domestic CricketFREE
IPLINR 700-5000 ($8.4-60)INR 5000-52938 ($59.9-$634.4)
WPLINR 100-500 ($1.2-6)

As per Hindustan Times, “Pricing is decided as per demand and supply, affordability, culture, and the eagerness of the people to pay” when it comes to IPL prices. Hence, there is a wide range in IPL tickets depends on which player/teams are playing and when the ticket has been purchased.

Here are some other notes:

  • Non-international matches are free to attend.
  • *The entry to women’s Test between India & South Africa was free, while the T20Is were priced for INR 150.

Exchange Rate: 1 INR = $0.01 USD ($1 USD = 83.44 INR)

Sources: Ind-Ban 1st Ticket Ticket Prices, India-NZ Wankhede Ticket Prices, IPL Ticket Prices, India-South Africa Women’s Series, India-Australia 2023 T20I Prices

Embed from Getty Images

7. Pakistan ($20-155)

Watching 2 days of a men’s Test, 1 ODI, and 2 PSL matches in Pakistan would cost between $20-155 over the course of a season.

  • Monthly Cost of Living: $370
  • Average Monthly Net Salary: $182.81
  • Annual Inflation Rate: 24.8%
  • Estimated Monthly Debt: $187.19

*No savings if we go by the averages above

Type of MatchGeneral Admission Ticket Price (Adult)Premium Tickets
A Day of a TestPKR 500 ($1.8)PKR 2800 ($10.1)
LOIPKR 500 ($1.8)PKR 7500 ($27)
Women’s InternationalFREE
Domestic CricketFREEPKR 1600 ($5.8)
PSLPRK 2000 ($7.20)PKR 15000 ($54)

*Note: The premium tickets do not include the hospitality individual boxes. Those tickets can go 5-10x as high as the premium tickets.

Exchange Rate: $1 USD = 277.87 PKR

Sources: Pakistan-Bangladesh Tests, PSL Tickets, Champions Cup Tickets, Pak-NZ T20I Prices, Pak-SA Multan T20s

Embed from Getty Images

8. Zimbabwe ($8-35)

Two days of a men’s Test and 1 Men’s ODI in Zimbabwe, 1 Women’s ODI would cost a spectator somewhere in the range of $8-35 in one season.

*Note: The salary and cost of living data for Zimbabwe is not reliable.

Type of MatchGeneral Admission Ticket Price (Adult)Premium
Men’s LOI$2 USD$10 USD
Women’s LOI$2$5

Sources: WC Qualifier, Zimbabwe-Bangladesh 2021 Women’s

Embed from Getty Images

9. Sri Lanka ($6-115)

In Sri Lanka, watching 2 days of a men’s Test, 1 ODI, and 2 LPL matches would cost between $5.52-$114.8 over the course of a season.

  • Estimated Monthly Debt: $230.22

*No savings if we go by the averages above

Type of MatchGeneral Admission Ticket Price (Adult)Premium Tickets
A Day of a TestLKR 300 ($0.98)LKR 7500 ($24.6)
Men’s LOILKR 500 ($1.6)LKR 10000 ($32.8)
LPLLKR 300 ($0.98)LKR 5000 ($16.4)

Exchange Rate: $1 USD = 304.8 LKR

Sources: India-Sri Lanka 2024 T20I Tickets, Lanka Premier League 2021 Tickets, 2022 LPL Ticket Range, Barmy Army ripped off by SLC, 2012 Price Hike

10. Bangladesh ($6-71)

Two days of a men’s Test, 1 ODI, and 2 BPL matches in Bangladesh would cost a spectator somewhere in the range of $6-71 in one season.

  • Monthly Cost of Living: $521
  • Average Monthly Net Salary: $240.50
  • Annual Inflation Rate: 9.3%
  • Estimated Monthly Debt: $280.5

*No savings if we go by the averages above

Type of MatchGeneral Admission Ticket Price (Adult)Premium Tickets
A Day of a TestBDT 100 ($0.84)BDT 1000 ($8.4)
Men’s LOIBDT 150 ($1.26)BDT 1500 ($12.6)
BPLBDT 200 ($1.68)BDT 2500 ($20.9)

Exchange Rate: $1 USD = 119.51 BDT

Sources: BPL Ticket Price Range, NZ-Ban Dhaka Tickets, SL-Ban ODI Tickets

How Do Other Sports Compare?

According to Statista, here is how much the average cost of tickets for some sports league range at:

Long story short, watching sports can be a fun and expensive experience.

Final Thoughts

The main thought of writing this article was to answer the question, “Is cricket affordable for the common man?”

With rising cost of living standards around the world and mobile/TV accessibility of cricket, are boards doing enough to incentivize followers to go to the ground?

In general, cricket is not as expensive as other sports. However, if Test cricket is to survive, £95 Day 4 tickets is probably not going to help.

If the trend continues, cricket will become only an elitist game. It began as an elitist game, but do we want to keep it that way?

If you are interested in cricket & finance, consider checking out the following:

© Copyright @Nitesh Mathur and Broken Cricket Dreams, LLC 2023. Originally published on 07/29/2024. Unauthorized use and/or duplication of this material without express and written permission from this site’s author and/or owner is strictly prohibited. Excerpts and links may be used, provided that full and clear credit is given to Broken Cricket Dreams with appropriate and specific direction to the original content (i.e. linked to the exact post/article).

Retractable Roofs in Cricket—Yay or Nay? Is it Worth the Hassle?

Rain Rain Go Away,

Come Again Another Day

Little Johnny Wants to Play

This nursery rhyme hits a little too close to heart for cricket fans.

Rain, Rain Go Away

Case and point, Greater Noida 2024.

In case you were living under a rock this past week, the scheduled Test match between Afghanistan & New Zealand was called off without a single ball bowled due to rain, wet outfield, and drainage issues.

Bizarre.

A few days prior, the Sri Lanka-England series was rudely interrupted by bad light. We even had to sit through Chris Woakes’ off-spin.

Embed from Getty Images

So What?

Umpires bringing out their light meters out is a common sight in England’s overcast conditions.

We cannot control the weather. So, how can we fix this?

Several proposals have come up over the years: Better Drainage systems (see Sri Lanka), pink ball all the time (especially England), and earlier starts in the day for late-summer months.

All are good ideas, but let’s consider another idea that has been vaguely mentioned—A covered or ‘retractable’ stadium.

Remember that one stadium where the Shahid Afridi hit 12 runs in one ball? Yep, that’s the one.

Key Takeaways

  • In one of our previous analysis, “How Much Money Does It Take to Host a Test Match?,” we estimated that it takes about $350,000-$1.4 million per 5-day Test depending on the technology used i.e. about $70,000-$280,000 per day of cricket.
  • It takes about $100-$150 million to add a retractable roof in a stadium (although in some cases the expenses ballooned up to $300 million). For maintenance & repairs, a future budget between $20-30 million needs to be kept aside.
  • It would take about 357-4,286 days of rain affected matches for the cost of the retractable roof to recover*
  • In England’s 2024 home season (men’s), six days were rain-affected, one of which was washed out and 5 others were affected by bad light. In 2023, 9 Tests & 5 ODIs were impacted by rain, five of which were no results or complete wash outs. At least 2-5 Hundred matches were marred by rain as well.
  • The 2024 T20 World Cup had 8 rain-affected games with four abandonments, while the 2019 ODI WC in England had 3 washouts, 4 reduced matches, and one two-day semi-final contest.

*If the roof is only used for international cricket and no other sport

Embed from Getty Images

Retractable Roofs in Cricket, Does it Make Economic Sense?

The city of Charlotte in North Carolina is currently debating whether to spend $650 million for a stadium upgrade without a roof or shell out $800 million with one.

Adding a roof will make the stadium more likely to get gigs for the Super Bowl or College Football Title. Why is this important?

According to Statista, a whopping 123.4 million tuned in for Super Bowl in 2024. It is estimated that consumers spend about $18.7 billion on Super Bowl Sunday, adding to the U.S. economy.

The NFL cannot afford to lose millions of advertising dollars due to weather or unnecessary delays, so they are more inclined to pick stadiums with a covered roof.

Embed from Getty Images

What is the Return on Investment?

In 2001, the Milwaukee Brewers installed a retractable roof. The Miller Park roof has helped draw over 1 million additional fans every year.

Rick Schlesigner, the CEO of Brewers said that he is “very pleased with the roof.” As of 2018, the roof had been used 4,014 times and had “delivered its promise to fans.”

What About Maintenance?

Building the stadium is only a part of the equation, recurring repair & maintenance costs is the other. Brewers’ have estimated that future repairs, maintenance, ironworkers, engineers, roofers will cost about $37.1 million.

Embed from Getty Images

How Much Do Domes & Retractable Roofs Cost Around the World?

Like Charlotte, other cities like Buffalo, New York (who are usually trounced by snow storms) have also debated whether to add retractable roofs.

According to AECOM’s “Preliminary Buffalo Bills Stadium Analysis”, making the stadium ‘roof-ready’ will cost them about $109 million, while actually building the new roof will cost about $298 million.

Building NFL stadiums is already a costly endeavor. According to Constructive Dive, the overall construction cost for the SoFi Stadium in Los Angeles cost a record $5.5 billion (most expensive stadium ever built), Mercedes-Benz Stadium in Atlanta was about $1.5 billion, and the U.S. Bank Stadium in Minneapolis was about $1.2 billion.

Similar, the owner of the MLB team, New York Mets, estimated that it would take them $800 million to add a retractable roof, while it would have only costed $125 million if it were to be installed during construction.

Embed from Getty Images

Cost of Domes and Retractable Roofs in Sports

Here are a few examples of stadiums from different sports and how much their construction cost for a covered stadium. This is not an exhaustive list by any means.

Although cricket was a pioneer in adopting technologies like Hawkeye, it is way behind in architectural investment and innovation.

Archibald Stadium – Carrier Dome ($26.85 Million)

  • Sport: College Football
  • Location: Syracuse, New York
  • Capacity: 40,000

In 1980, Carrier Dome at Syracuse University was one of the first covered domes and the largest collegiate dome. It cost about $27 million back then. The dome was later renovated in 2021 for $118 million.

Sources: IndustryTap

No. 1 Court, Wimbledon (£71 million ~ $93 Million)

  • Sport: Tennis
  • Location: London, England
  • Capacity: 12,345

Sources: Independent

Embed from Getty Images

Lucas Oil Stadium ($100 Million)

  • Sport: NFL
  • Location: Indianapolis, Indiana
  • Capacity: 70,000
Embed from Getty Images

Sources: IndyStar

Arthur Ashe Stadium ($150 Million)

Embed from Getty Images
  • Sport: Tennis
  • Location: Queens, New York
  • Capacity: 23,771

Sources: Reuters Report, Rules of When to Close the Roof

Marvel (Docklands) Stadium ($270 Million)

  • Sport: Multipurpose (AFL, Rugby, Soccer, Cricket, Grand Prix)
  • Location: Melbourne, Australia
  • Capacity: 50,000

*Note: The $270 million ($460 million AUD) cost is for the entire stadium construction, not just the roof.

Sources: StadiumDB

Embed from Getty Images

Proposed Stadiums

Huntington Bank Field, Cleveland Browns ($2.4 Billion – Proposed)

  • Sport: NFL
  • Location: Cleveland, Ohio
  • Capacity: 70,000

The proposed $2.4 billion investment for the dome would be split between public and private financing, making the $1.2 billion allocated for private investment as the largest private per capita stadium investment in the country.

Sources: Sportico

Macquerie Point Stadium ($375 Million – Proposed)

  • Sport: AFL, Cricket
  • Location: Hobart, Tasmania, Australia
  • Capacity: 23,000

This stadium will utilize ethylene tetrafluoroethylene (ETFE), essentially a plastic-see through roof. This is based of other stadiums that have used ETFE like the Allianz Arena in Munich, Dunedin’s Forsyth Barr Rugby stadium (cost around $200 million overall), Las Vegas bowl, and Bejing.

Sources: The Daily Mail

Embed from Getty Images

The ‘Big O’ Montreal Stadium ($875 Million – Proposed)

  • Sport: Olympics Stadium
  • Location: Montreal, Canada
  • Capacity: 73,000

*Note: The 1976 Olympic stadium is getting a makeover with the roof itself costing $875 million. The replacement roof will not be retractable, but will be translucent to allow for sunlight.

Sources: Soccer Stadium Digest, Montreal News

Honorable Mentions: The Te Kaha multipurpose stadium in Christchurch, New Zealand is forecasted to run at $683 million (all costs, including roof).

Who Pays for It?

In most cases, the city that hosts the stadium is responsible for paying for any stadium, construction, and repair costs.

Influx of private partnership is helping alleviate some of the costs that the local government gets burdened with.

Due to the complex funding structure, the planning and construction process can go through political interference, red tape, delays, and budget overruns.

How Will A Retractable Stadium in Cricket Impact Playing Conditions?

Playing conditions play a major role in cricket.

Will the amount of swing decrease in England? Do we want natural elements to go out of the game?

In addition, there is another consideration of air circulation and heat, something that the Arthur Ashe stadium had issues with.

How Much Money Does Cricket Lose to Rain?

To find out how much money cricket lost to rain, we first figured out how many days were affected by rain.

We will consider the last three home seasons for the England’s men’s team as well the last few ICC tournaments.

England Home Season (Men’s)

*Note: W/O denotes complete wash out. N/R denotes No Result

2024 Season

Rain Affected/Wet Outfield Bad Light
3rd T20I v Pak (W/O)
3rd Test v WI, Day 2
1st Test vs SL, Day 2
1st Test vs SL, Day 3
3rd Test vs SL, Day 3
1st Test vs WI, Day 1
1st Test vs SL, Day 1
2nd Test vs SL, Day 3
3rd Test vs SL, Day 1
Day 2
Day 3

2023 Season

Rain Affected/Wet Outfield
Ashes 1st Test, Day 3
1st Test, Day 5
2nd Test, Day 1
2nd Test, Day 3
3rd Test, Day 3
4th Test, Day 4
4th Test, Day 5 (W/O)
5th Test, Day 4
5th Test, Day 5
Ire v Ban, 1st ODI (N/R)
Ire v Ban, 2nd ODI(45-over ODI)
Ire v Eng, 1st ODI (W/O)
Ire v Eng, 3rd ODI (N/R)
NZ v Eng, 2nd ODI (34-over ODI)

*Note: Not many matches were affected by Bad Light in 2023, most of the interruptions were all rain/wet outfield related.

2022 Season

Rain Affected/Wet Outfield Bad Light
1st Test* v Ind, Day 2
Day 3
Day 5 (W/O)
2nd Test* v Ind, Day 1
5th Test v Ind, Day 1
Day 2
Day 3
1st Test v NZ, Day 3
2nd Test v NZ, Day 2
3rd Test v NZ, Day 1
Day 3
Day 5
2nd ODI v SA (29-over ODI)
3rd ODI v SA (N/R)
1st Test v SA, Day 1
3rd Test v SA, Day 1 (W/O)
Day 2 (W/O)
1st Test v Ind, Day 2
2nd Test v Ind, Day 4
3rd Test v Ind, Day 3
4th Test v Ind, Day 3
3rd Test v SA, Day 3
SA, Day 4

*Note: We exclude these matches from our calculations since the 1st 4 Tests of the Pataudi Trophy were held in 2021

ICC & Other Tournaments

  • 2024 T20 World Cup
    • 2024 (M): Match 6 (N/R), Match 23 (W/O), Match 30 (W/O), Match 33 (W/O), Match 34 (10-over), Match 44 (11.2-over DLS), Match 50 (17-over DLS), Match 52 (19-over DLS)
    • 2023 (W): Match 18 (8.2-over DLS)
  • ODI World Cup
    • 2023 (M): Match 35 (25.3-Overs DLS)
    • 2022 (W): Match 5 (27-over), Match 20 (20-over), Match 23 (N/R), Aus-WI SF (45-over)
    • 2019 (M): Match 7 (41-over), Match 11 (W/O), Match 16 (W/O), Match 18 (W/O), Match 21 (48-over), Match 22 (40-over DLS), Match 25 (49-over), Ind-NZ SF (2 days)
    • 2017 (W): Match 6 (W/O), Match 21 (24-over DLS), Ind-Aus SF (42-over)
  • The Hundred
    • 2024 (W): Match 21 (W/O), Match 32 (N/R)
    • 2024 (M): Match 21 (N/R), Match 29 (44-balls), Match 30 (N/R), Match 32 (30-balls)
    • 2023 (W): Match 2 (W/O), Match 3 (W/O), Match 6 (W/O), Match 7 (W/O), Eliminator (N/R)
    • 2023 (M): Match 2 (40-balls), Match 6 (N/R), Match 7 (W/O), Match 11 (NR), Match 18 (90-balls)
    • 2022 (M/W): None

Note: We only consider England’s home season and The Hundred. County Championship, Royal One Day Cup, and the T20 Vitality Blast lose a number of matches.

Also Read: How Much Money Does it take the ICC to Host a Cricket World Cup? (Case Study), How Has England’s Domestic Cricket Schedule Changed in the Last 50 Years?

Final Thoughts

For a sport that seems to be struggling financially on a larger scale, adding a retractable roof in cricket is, in most cases, a bad idea.

Of course, we cannot build a retractable in every stadium. However, countries that can afford and/or have a dire need may be able to afford this on a case-by-case basis.

For example, the Wankhede, Eden Gardens, or the Narendra Modi Stadium in India, SSC in Sri Lanka, Lord’s in England (in case they host the WTC Final for the next 100 years), and the MCG in Australia for some of the larger occasions.

Richer leagues like the NFL & MLB may help subsidize the cost of ultra-expensive stadiums in the USA. With IPL’s growing wealth, the BCCI may be able to help subsidize these types of stadium enhancements around the world as well. Who knows.

What do you think?

Anyway, retractable roofs in cricket are just one part of the alternative. We will do deep dive into how drainage systems work in cricket and other sports at a different time.

****

Thanks for reading!

Other Sources: Walter Moore Roof Stadium Projects, Baseball Stadiums Analysis, Las Vegas New $1.5 Billion Stadium

Also Read:

© Copyright @Nitesh Mathur and Broken Cricket Dreams, LLC 2023. Originally published on 07/29/2024. Unauthorized use and/or duplication of this material without express and written permission from this site’s author and/or owner is strictly prohibited. Excerpts and links may be used, provided that full and clear credit is given to Broken Cricket Dreams with appropriate and specific direction to the original content (i.e. linked to the exact post/article).

How Has England’s Domestic Cricket Schedule Changed in the Last 50 Years?

In a famous scene from the The Newsroom, Jeff Daniels’ character, Will McAvoy, exclaims,

“First problem in solving any problem is recognizing there is one.”

– Will McAvoy, The Newsroom

England cricket is having a mid-life crisis for about a decade now.

Although The Hundred is at the heart of that conversation, we should recognize that the larger issues that plague English cricket are finances and scheduling.

We have already looked at the financial statements of all counties and the level of debt they are in.

Today, we look at how scheduling has changed for first-class counties over the past 50 years and excavate some patterns.

Let’s dive right in.

Key Takeaways

  • The Vitality T20 blast is currently at a 133-match season. When it began in 2003 (as the Twenty20 Cup), it was only a 48-match tournament and reached its peak with a 151-match season during 2010-11.
  • Back in 1962, each County team played between 28-32 matches for a total of 254 three-day matches. 50 years later, The County Championship has become a 126 four-day match affair, where each team plays 14 matches.
  • 48.92% of the 1987 first class season was County Championship matches (204/417), whereas only 34.05% of the 2024 season is County matches (126/370).
  • In 1975, there were 25 days of international cricket (5 Tests). By the time we got to 2010, the English home season had 51 days of international cricket.

Table of Contents

Why Do We Care? The Scheduling Challenge for English Cricket

The England-Sri Lanka series has continuously been interrupted for bad light. Chris Woakes even bowled a few hilariously filthy off-spin deliveries!

Well that’s what you get for hosting home English Test matches in September.

In other news, Tymal Mills has criticized the scheduling of the T20 Blast since international players will most likely miss the final. The finals is slated for September 14th, the same week England-Australia T20Is will take place.

These are all valid issues. However, why is it that the English domestic cricket schedule is scrutinized all the time, but the Indian domestic system is not?

Mainly weather.

English Weather and Summer Break

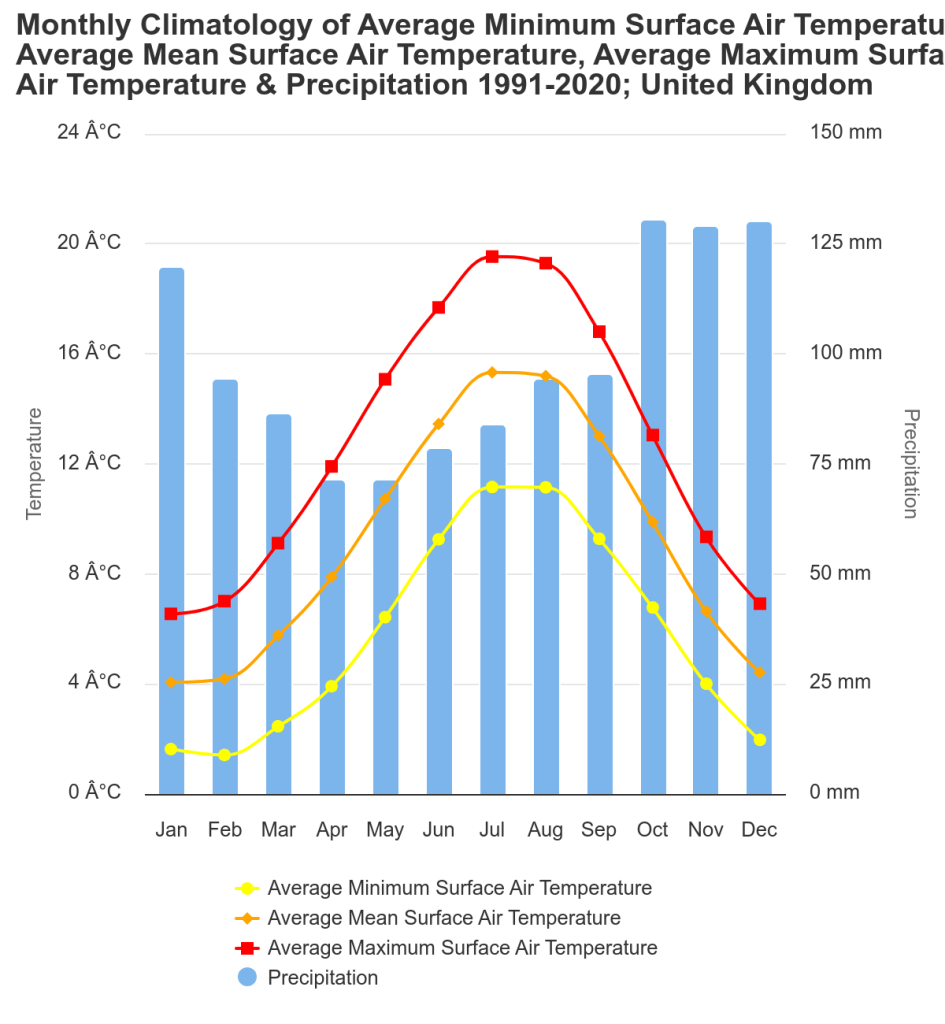
According to the climate portal of the World Bank Group, average precipitation in the UK increases dramatically between September and October from about 90 mm to 130 mm.

May is the driest month, while July is the hottest month.

Attention Spans are Getting Shorter

With AI taking over the world and everybody glued to their phones, it is no surprise that attention spans are getting shorter.

Students in the UK usually have a summer break from mid-July to late August, and schools go back in session around September. That’s not all—The Wimbledon takes place between the end of June & mid-July with the English Premier League following in mid-August.

The challenge for English domestic cricket is to simultaneously capture the attention of the public and escape from rain. Trying to fit international cricket, County Championship, and 3 separate limited over tournaments within 3-4 months and with the same group of players is nigh impossible and borderline, insane.

Indian cricket has the luxury to host the IPL between March-May and still have the Ranji Trophy & their Test between October-February. The rest of the year, India can host bilaterals and other tournaments like the Duleep Trophy, Syed Mushtaq Ali, etc.

English Domestic Season in a Nutshell

The modern English domestic season mainly consists of the following four types of tournament:

  • County Championship (first class), ODI Cup (List A), T20 Blast (domestic T20), experimental (currently, The Hundred)
  • For this analysis, we have looked at the schedules of County Championship, T20 Blast, The Hundred, Benson & Hedges Cup, Gillette Cup, Royal London One Day Cup, Sunday League, Bob Willis Trophy, and England’s international schedules.

*Note: Competitions involving National/minor counties, universities, MCC exhibition matches, and and tournaments such as Gentleman vs Players (ran from 1806-1963) are not considered in this analysis.

Embed from Getty Images

How Does the Current 2024 Domestic Season Look Like?

In theory, a three-format English cricketer who plays all possible matches in domestic cricket and The Hundred can play a maximum of 125 days of cricket at home given there is no overlap. That is 68.30% of the 183 total days between April 1st and September 30th.

2024 Season (Current Format with the Hundred)

Total Domestic Matches: 370

  • Max Days of Internationals: 37
  • Max Day of Domestic Cricket Per County: 88 (56 first class, 32 limited overs)
    • County Championship: 14 Matches (4 day per match)
    • Royal One Day Cup: 8
    • Vitality T20 Blast: 14
    • The Hundred: 10

International Home Season Breakdown

  • May 22-May 30: 4 T20Is vs Pakistan (4 maximum days of cricket)
  • July 10-July 28: 3 Tests vs West Indies (15 maximum days of cricket)
  • August 21-September 10: 3 Tests vs Sri Lanka (15)
  • September 11-September 29: 3 T20Is, 5 ODIs (8)
CompetitionTypeMatchesDate Range
County ChampionshipFirst-Class1265 Apr-29 Sept
One Day Cup50 Overs7730 May-14 Sept
T20 Blast20 Overs13324 Jul-22 Sept
The Hundred100 Balls3423 Jul-18 Aug

County Championship (1948-2024)

Before 1988, all County Championship Matches were played as 3-day games. After 1993, all matches became 4-day affairs and between 1988-1992, it was a mix of 3 and 4 day games.

Here are some additional notes:

  • In 1992, Durham was added as the 18th team in the County Championship. Before 1988, we have 17 teams and 18 teams after.
  • Between 1960-1962, a team could play a maximum of 32 first class games or a maximum of 96 days of cricket (since County was only 3 days back then).
  • Between 1988-1991, each team played sixteen 3-day matches (120 matches total) and six 4-day matches.
  • In comparison, a player in the 2024 County Championship could play a maximum of 14 first class games or a maximum of 56 days of first class cricket (4-day).

The ‘cricketing days’ column is the (number of matches) * (3 or 4) depending if it is a 3-day or 4-day match. This does not represent the actual days played since multiple County matches may overlap on a single day.

YearsTotal MatchesCricketing DaysMatches Per Team
1948-194922166326
1950-195923871428
1960-1962254762Mix of 28/32
1963-196823871428
1969-197120461224
1972-197617251620
1977-198218756122
1983-198720461224
1988-199118762822
199219862822
1993-199915260817
2000-201614457616
2017-201912650414
2020*46
(Bob Willis Trophy)
184
2021126 (+1 BW Trophy)50814
2022-202412650414

Note*: In 2020, the County Championship was cancelled, and only the Bob Willis Trophy took place.

Embed from Getty Images

T20 Vitality Blast

The schedule for the T20 Blast has been an issue since The Hundred began, but was it ever a reasonable schedule?

Annie Chave, editor of County Cricket Matters, mentioned to me in a message,

“There’s never really been a perfect schedule…I thought it worked well when T20s were on Friday nights and there seemed to be a regularity in the season, but I also liked a little bit of B&H & Gillette Cup!”

Between 2003-2019, the format of the T20 Blast, formerly known as the Twenty20 Cup, changed a staggering 7 times ranging from 48-matches to 151-matches.

The Early Years (2003-2009)

The early years had a pretty decent number of matches gradually increasing from 48 to 97.

(Side note: There is no direct correlation between an earlier end date for the T20 Blast and number of rained out matches as we can see from 2007-2008).

YearMatchesFinals DateRained Out Matches
20034819th July0
2004527th August4
20057930th July11
20067912th August2
2007794th August19
20089726th July20
20099715th August3
Twenty20 Cup (2003-2009)

The Expansion and T20 Blast Scheduling Overkill (2014-2020)

The 2010s were when the scheduling problem amplified not only in the English domestic scene, but also internationally.

The domestic schedule could theoretically afford the increase from 97 games in 2009 to 151 in 2010 since the Gillette Cup & Sunday League ended and morphed into a single ECB 40 competition, but it realistically made the domestic schedule even more complex.

YearMatchesFinals DateRained Out Matches
201015114th August5
201115127th August23
20129725th August20
20139717th August1
201413323rd August12
201513329th August9
201613320th August15
20171332nd September16
201813315th September12
201913321st September24
2020*974th October12
T20 Blast (2010-2020)

Post The Hundred (2021-2024)

YearMatchesFinals DateRained Out Matches
202113318th September13
202213316th July6
202313315th July2
202413314th September10
T20 Blast (2021-2024)

The Hundred

The reason The Hundred has become a point of contention is not necessarily due to the new format created of out of the whim.

Rather, it goes back to attention span. Late July to mid-August is a coveted window in the English domestic calendar.

The Hundred being scheduled during this valuable time slot means that T20 Blast matches becomes a secondary tournament. Furthermore, Test series are delayed to September, where there is a higher likelihood of being affected by rain or bad light. In addition, some rounds of the T20 Blast and the Royal One Day occur during this time, which means County teams have to find a second XI to field their teams (since most marquee players would be at The Hundred).

YearStarting DateEnding Date
202123rd July18th August
20221st August27th August
2023 3rd August3rd September
202421st July21st August
The Hundred (2021-2024)

T20 Vitality Blast Attendance

In 2003, the Vitality Blast begun with an attendance of about 257,759. Over the years, the attendance has ebbed and flowed and has slightly dipped since the inception of the 100-ball competition:

  • 2003: 257,759 (5,370 average attendance)
  • 2007: 415,751 (5,263)
  • 2008: 583,642 (6,016)
  • 2010: 676,753 (4,481)
  • 2014: 740,205 (5,565)
  • 2018: 931,455 (7,003)
  • 2019: 920,000 (6,917)
  • 2022: 800,000 (6,015)

Sources: George Dobell’s ESPNCricinfo article, Being Outside Cricket Blog

Frustrating 2024 Schedule

We can see why the current T20 Blast schedule is frustrating. There are long gaps and break of continuity, a situation worsened by The Hundred.

  • May 30-June 21: Round 1
  • July 5-19: Round 2
  • September 3-6: Quarter-finals
  • September 14: Semi-finals and Final

Sam Billings sums the situation up perfectly.

One Day Tournaments and Experimental Formats

The Hundred is not the first time England cricket is pioneering a new format. They started with 65 overs back in the early 1960s, created a 40-over tournament that built the backbone of England’s 2009 WC winning squad, and are now experimenting with 100-ball cricket.

Here is a brief timeline:

  • 2014-2024: Royal London One Day Cup
  • 2021-2024: The Hundred
  • 2010-2013: ECB 40
  • 1972-2002: Benson & Hedges Cup (55-overs first few years, then 50 overs)
  • 1969-2009: Sunday League/National League/NatWest Pro40 (50, 45, then 40 overs)
  • 1963-2009: Gillette Cup/NatWest Trophy/C&G Trophy/Friends Provident Trophy

Notes*:

  • The Sunday League was also referred to as the John Player League
  • C&G Trophy: Cheltenham & Gloucester Trophy

How Has the English International & Domestic Season Evolved Over the Past 60 Years?

1962 Season (Longest Recent County Championship Season, Last Season Pre-ODIs)

Total Domestic Matches: 278

  • Max Days of Internationals: 25
  • Max Days of Domestic Cricket Per County: 80
    • 78 County Matches, 1-2 tour match against Pakistan

International Home Season

  • May 31st-20th August: 5 Tests vs Pakistan (max 25 days of cricket)
    • April 28th-10th September: 24 First-Class Tour matches (72 days) apart from 7 other unofficial matches
Embed from Getty Images

1975 Season (World Cup and Ashes Year)

Total Domestic Matches: 377

By 1975, the modern English domestic season was established, and ODI cricket had taken its root in England. This was an interesting season because it also had an Ashes series and the inaugural ODI World Cup.

  • Max Days of Internationals: 25
  • Max Days of Domestic Cricket Per County: 88 (60 first class, 28 limited overs)
    • County Championship: 60 (20 matches)
    • Sunday League: 16
    • Benson & Hedges Cup: 7
    • Gillete Cup: 5 (Knockout format)
  • County Championship
  • Gillete Cup, Sunday League, Friends Provident Trophy

International Home Season

  • 10 July 1975-3 September 1975: 4-Test Ashes (20 days max)
  • ODI World Cup: 5 Matches Max (3 Group, semi-final, and final)
CompetitionTypeNumber of MatchesDate Range
County ChampionshipFirst-Class17230 Apr-17 Sept
1975 ODI WC60 overs157 Jun-21 Jun
Gillete Cup60 Overs22 25 Jun-6 Sept
Sunday League40 Overs1364 May-14 Sept
Benson & Hedges Cup55 Overs4726 Apr-19 Jul
Embed from Getty Images

1987 Season (Last of 3-Day County Matches)

Total Domestic Matches: 417

  • Max Days of Internationals: 28
  • Max Days of Domestic Cricket Per County: 100 (72 first class, 28 limited overs)
    • County Championship: 72 (24 matches)
    • Refuge Assurance League: 16
    • Benson & Hedges Trophy: 7
    • Natwest Trophy: 5

International Home Season

  • May 21-May 25: 3 ODIs vs Pakistan (3)
  • June 4-August 11: 5 Tests vs Pakistan (25)
CompetitionTypeMatchesDate Range
County ChampionshipFirst-Class20425 Apr-15 Sept
Natwest Trophy60 Overs3024 Jun-7 Sept
Benson & Hedges Trophy55 Overs472 May-11 Jul
Refuge Assurance League (Sunday)40 Overs1363 May-13 Sept
Embed from Getty Images

2003 Season (Birth of T20 Cricket)

Total Domestic Matches: 413

  • Max Days of Internationals: 32
  • Max Days of Domestic Cricket Per County: 113 (65 first class, 48 limited overs)
    • County Championship: 64 (16 Matches)
    • 1 Tour Match vs South Africa
    • National League: 16
    • National League: 16 (Division I), 18 (Division II)
    • Twenty20 Cup: 7
    • C & G Trophy: 7

International Home Season

  • June 26-July 12: Natwest Series vs South Africa & Zimbabwe (7 matches maximum per team)
  • July 24-September 8: 5 Tests vs South Africa (25)
    • 6 Domestic Tour Matches
CompetitionTypeMatchesDate Range
County ChampionshipFirst-Class14418 Apr-17 Sept
National League (Sunday)45 Overs16227 Apr-21 Sept
Twenty20 Cup20 Overs4813 Jun-19 Jul
C & G Trophy100 Balls5929 Aug 2002-30 Aug 2003
Embed from Getty Images

2005 Season (Ashes Season)

Total Domestic Matches: 416

  • Max Days of International Cricket: 39
  • Max Days of Domestic Cricket Per County: 100 (64 first class, 36 limited overs)
    • County Championship: 64 (16 Matches)
    • National Totesport League: 16 (Division I), 18 (Division II)
    • Twenty20 Cup: 11
    • C & G Trophy: 5

International Home Season

  • May 26-June 5: 2 Tests vs Bangladesh (10)
  • June 13: 1 T20I vs Australia (1)
  • July 7-July 12: 3 ODIs vs Australia (3)
  • July 21-September 12: 5 Test Ashes vs Australia (25)
CompetitionTypeMatchesDate Range
County ChampionshipFirst-Class14413 Apr-24 Sept
National League (Sunday)45 Overs16217 Apr-25 Sept
C&G Trophy50 Overs313 May-3 Sept
Twenty20 Cup20 Overs7922 Jun-30 Jul
Embed from Getty Images

2010 Season (Inaugural ECB40, Expansion of T20 Blast)

Total Domestic Matches: 424

  • Max Days of Home International Cricket: 51
  • Max Days of Domestic Cricket Per County: 96 (64 first class, 32 limited overs)
    • County Championship: 64 (16 matches)
    • T20 Blast: 18
    • ECB 40: 14

International Home Season

  • May 27-June 6: 2 Tests vs Bangladesh (10)
  • June 22-July 3: 5 ODIs vs Australia (5)
  • July 8-July 12: 3 ODIs vs Bangladesh (3)
  • July 29-August 26: 4 Tests vs Pakistan (24)
  • September 5-September 7: 2 T20Is vs Pakistan (2)
  • September 10-September 22: 5 ODIs vs Pakistan (5)

Note: Prior to the home season, 2010 T20 World Cup occurred between April 30-16 May in the West Indies, and England were the winners. They played 7 matches during this campaign.

CompetitionTypeMatchesDate Range
County ChampionshipFirst-Class1449 Apr-16 Sept
ECB Clydesdale Bank 4040 Overs12925 Apr-18 Sept
Friends Provident T20 Blast20 Overs1511 Jun-14 Aug
Embed from Getty Images

2019 Season (World Cup, Ashes Pre-Hundred)

Total Domestic Matches: 336

  • Max Days of International Cricket: 46
  • Max Days of Domestic Cricket Per County: 84 (56 first class, 28 limited overs)
    • County Championship: 56 (14)
    • T20 Blast: 17
    • Royal One-Day Cup: 11

International Home Season

  • May 5-19: 1 T20I, 5 ODIs vs Pakistan (6)
    • 3 List A Tour matches
  • May 30-14 July: 2019 ODI World Cup (11 matches – 9 group, semi-final, final)
  • July 24-27: 1 Test vs Ireland (4-Day Test)
  • August 1-September 16: 5 Tests vs Australia (25)
    • 3 Tour matches (2 3-day, 1 4-day)
CompetitionTypeMatchesDate Range
County ChampionshipFirst-Class1265 Apr-26 Sept
2019 ODI WC50 Overs4830 May-14 Jul
Royal One Day Cup50 Overs7717 Apr-19 May
T20 Blast20 Overs13318 Jul-21 Sept
Embed from Getty Images

2023 Season (Ashes Post-Hundred)

Total Domestic Matches: 370

  • Max Days of Internationals: 40
  • Max Days of Domestic Cricket Per County: 95 (57 first class, 38 limited overs)
    • County Championship: 56 (14 matches)
    • 1 tour Match
    • Vitality T20 Blast: 17
    • One Day Cup: 11
    • The Hundred: 10

International Home Season

  • June 1-4: 1 Test vs Ireland (4-Day Test)
    • One tour Match took place
  • June 16-July 31: 5-Test Ashes vs Australia (25)
  • August 30-September 15: 4 T20Is, 4 ODIs vs New Zealand (8)
    • 2 Tour matches
  • September 20-26: 3 ODIs vs Ireland (3)

*Note: The ICC World Test Championship took place between 7-11th June at the Oval.

CompetitionTypeMatchesDate Range
County ChampionshipFirst-Class1266 Apr-29 Sept
One Day Cup50 Overs771 Aug-16 Sept
T20 Blast20 Overs13320 May-15 July
The Hundred100 Balls341 Aug-27 Aug

Final Thoughts

From the ECB point of view, I get it. More limited over matches means more attendance, and in the long term, better financial stability (hopefully), but is the overkill of cricket really worth it?

Vic Marks warned in a 2003 Guardian article, Less is more for Twenty20,

“We all recognise that the Twenty20 Cup has been a startling success…Yet I would make a plea to the ECB and the administrators around the counties who smell a golden goose…Cricket is not good at this. At international level, look at the congested schedules that are exhausting players and spectators alike. Short-term greed will backfire.

– Vic Marks

That was 2003, when the Twenty20 Cup was only 48 matches, and The Hundred did not exist. 21 years later with the proliferation of franchise leagues and ICC tournaments every year, the situation has become even worse.

The ECB continued with the same 133-match format for the T20 Blast even after The Hundred. Maybe there is a case to go back to 2005-07 format, where 79-matches were played throughout or abolish The Hundred altogether.

Is there a Solution to England’s Schedule Woes?

Is there a solution?

Probably, but that is beyond the scope of this article (I have a ‘truly marvelous’ solution to this issue, but the margins are too narrow to contain it).

However, little changes can go a long way.

For starters, as Adam Collins argues on his podcast, scheduling September Test matches earlier in the day or adding lost overs to the beginning of the next day can be a start.

Remember, today’s goal was not to solve England’s domestic scheduling problem. Rather, it was to realize that this is the main problem for England’s administration to solve.

****

Thank you all for reading!

What do you all think about how to resolve the domestic English schedule? Comment below, would love to know your thoughts!

If You Like Reading about Problems & Solutions in Cricket, you may enjoy

If You Like Reading about English Cricket, you may also enjoy

© Copyright @Nitesh Mathur and Broken Cricket Dreams, LLC 2023. Originally published on 09/08/2024. Unauthorized use and/or duplication of this material without express and written permission from this site’s author and/or owner is strictly prohibited. Excerpts and links may be used, provided that full and clear credit is given to Broken Cricket Dreams with appropriate and specific direction to the original content (i.e. linked to the exact post/article).