ESPNCricinfo’s Firdose Moonda recently wrote a fascinating article on how Zimbabwe are set to play 11 Tests this year—as many as Australia— despite not being a part of the World Test Championship. Even more surprisingly, they’re hosting eight of them!
The first thought that crossed my mind? “How in the world is Zimbabwe Cricket (ZC) going to afford hosting 8 Tests?”
So, I went looking for answers.
I dug through 268 pages across four annual reports detailing ZC’s finances from 2018/19 to the 2022/23 season, tracing every ounce of revenue, surplus, and ICC payout…so you don’t have to.
Key Takeaways
At the end of 2017, Zimbabwe Cricket was $18.9 million in debt. By 2022, they had cleaned up their finances and reported a surplus of almost $12 million.
ZC remains heavily reliant on direct ICC distributions, which made up 63.5% of their revenue in 2018, rising to 96.6% (2019), 95.9% (2020), before dropping slightly to 90.7% (2021), and 74.5% (2022). Encouragingly, in 2022, they also earned $2.65 million or 16.74% of their revenue from TV rights, diversifying their income streams.
In 2018, ZC spent $445,763 to host Sri Lanka (2 Tests). The Bangladesh series (1 Test, 3 ODIs, 3 T20Is) in 2021 cost them $993,540, and Pakistan’s visit (2 ODIs, 3 T20Is) added an additional $889,340. Hosting regular World Cup qualifiers also costs ZC around $2-3 million every 2 years, although this is typically offset by an equivalent revenue.
England agreeing to pay Zimbabwe a ‘touring fee’ is a step in the right direction. Between 2018-2022, Zimbabwe paid $100,000-$400,000 to participate in overseas tours regardless of the format.
Having played just 12 Tests from 2020-2024, Zimbabwe are scheduled to play 11 in 2025 – the joint-most of any team 😮 pic.twitter.com/uOJdG5x6KC
One paragraph in Moonda’s article particularly caught my eye,
“….and an ICC suspension for government interference in 2019….Since then, they have cleaned up their finances, in particular and made their annual ICC disbursement of US $13.5 million stretch to fund a five-team domestic system, which includes a first-class competition, the national sides, and to host Tests at $500,000 a pop. This bumper year, hosting Tests will cost them about $4 million.”
This lines up with what I found in my earlier piece, “How Much Does It Take to Host A Test?” where we estimated that hosting a single Test can cost anywhere from $350,000-$1.4 million to host a Test depending on factors like the version of DRS used, size of support staff, logistics, etc.
Understanding Test hosting expenses is only one part of the puzzle. To get the full picture, we need to look at Zimbabwe Cricket’s overall financial health — how much revenue they generate, what they spend on operations, and how they have managed to shift from a deep deficit to a growing surplus.
ZC’s Statement of Comprehensive Income Summarized
Let’s dive into Zimbabwe Cricket’s annual revenue, operating costs, and overall financial health.
We can see the step-by-step progress made by the board over the last five years.
At the end of 31 December 2017, ZC had a deficit or total surplus of $-18,900,427. Their surplus at the end of each subsequent year was as follows:
2017:-$18,900,427 (4 Tests)
2018:-$14,182,531 (2 Tests)
2019:+$3,307,548 (0 Tests)
2020:+$1,568,441, after prior period adjustment of -$533,342 (3 Tests)
2021:+1,293,742 (5 Tests)
2022:+$11,979,997 (0 Tests)
Year
Revenues
Operating Cost
Other Gains/Charges*
Total Comprehensive Incomes
2018
+$14,167,700
-$13,502,975
+$4,053,171
+$4,717,896
2019
+$11,905,334
-$7,174,817
+$12,759,562
+$17,490,079
2020
+$5,520,442
-$6,940,391
+$214,183
-$1,205,766
2021
+$9,318,149
-$9,651,008
+$58,160
-$274,699
2022
+$15,829,422
-$12,118,204
+$6,975,037
+$10,686,255
Operating Surplus per year (Revenues – Operating Cost):
2018: +$664,725
2019: +$4,730,517
2020: -$1,419,949
2021: -$332,859
2022:+$3,711,218
*Note: This section is a net sum of (i) ‘Gain realised on conversion of local liabilities’ and (ii) ‘Finance charges’, (iii) share of profit of investments in subsidiaries accounted for using the equity method, and (iv) revaluation surplus on land and buildings.
We have used the 2022 Annual Report for both 2021 and 2022 years since there was $297,939 period correction from 2021, where inventory was erroneously marked as an operating expense.
Now, let’s take a look at how much revenue Zimbabwe receives from the ICC?
Under the previous ICC distribution model (2016-2023), Zimbabwe was allocated $94 million over seven years, which breaks down to roughly $13.42 million per year on average.
Under the new 2024-27 model, Zimbabwe are set to receive about $17.64 million a year.
Here are the contributions from the last four annual reports. The pandemic years definitely seemed to have an impact on the contribution in 2029.
Year
ICC Contribution
Trades & Receivables from ICC
Total from ICC
2018
$9,000,000
$2,969,358 (ICC Loan)
$11,969,358
2019
$11,500,000
$2,062,079
$13,562,079
2020
$5,292,791
$769,292
$6,062,083
2021
$8,459,915
$3,296
$8,463,211
2022
$11,788, 243
$3,239,324
$15,027,567
Note: In addition to ICC loan in 2018, ZCB also took upon Metbank loan and ZAMCO bank loan which totaled their borrowings to $14.4 million.
Operating Costs on Cricket Expenses
Alongside revenue, we also examined how much of Zimbabwe Cricket’s operating costs go toward organizing and administering cricket.
ZC’s investment in the sport has increased post the pandemic-induced break and signals a renewed commitment in growing the sport.
International Cricket Expenses
Year
International Cricket
Domestic Cricket
Central Administration
2018
-$4,840,396
-$1,457,251
-$1,846,502
2019
-$1,074,007
-$1,110,107
-$630,643
2020
–$1,218,449
-$1,332,304
-$434,704
2021
-$3,624,531
-$1,621,988
-$703,003
2022
-$4,604,893
-$3,115,367
-$947,410
Apart from these three areas, human resources and depreciation & impairment make the rest of their total operating costs.
The year-by-year and series-by-series breakdowns are provided below.
— Broken Cricket Dreams Cricket Blog (@cricket_broken) May 20, 2025
Other Interesting Findings
In 2018, ZCB received $571,949 for hosting the WC Qualifiers, $2.5 million for hosting other events, and $694,013 in sponsorship.
The cost of repairs and maintenance of ground equipment over the 5-year period was as follows: $120,739 (2018), $22,397 (2019), $110,413 (2021), $476,287 (2022).
$100,000 was the cost for the kit for their national team in 2018.
Total Sports Marketing in 2021 was $28,045.
In 2021, ZCB’s cricket income was made up of ICC distributions, World Cup Qualifier ($367,190), TV Rights ($435,381), and sponsorship/other income ($55,663).
In 2022, the new National Premier League (NPL) and Zim Afro T10 cost about $254,181.Women and age group tournaments investments also increased from $34,434 in 2021 to $217,073 in 2022.
Since the ICC suspension, Zimbabwe Cricket has been proactive in getting its financial act together. Even though COVID-19 was disastrous for the rest of their operations, during this period, they paid off their old debt, invested in women’s cricket and grassroot cricket, and inaugurated domestic tournaments like the National Premier League (NPL) and Zimbabwe Afro T10.
Here are some quotes from Tavenga Mukuhlani, ZC’s chairman and Givemore Makoni, the managing director in the annual reports over the 4-year period.
2019/20 Annual Report
With the ICC having frozen funding to ZC, our facilities were in disarray, with grass overgrown and the wickets needing a lot of work (Makoni).
“Having ended as badly as it started, the period under review has without any doubt been Zimbabwe Cricket (ZC)’s annus horribilis...At the close of the just-ended financial year, we had whittled the US$27-million legacy debt down to US$1 million, in the process breaking the chains that had enslaved our organisation to an unending cycle of financial troubles (Mukuhlani).
“With our revenues constrained, we seriously considered laying off staff and cutting salaries as so to future-proof the organisation….So, our only alternative was to live within our budget, which is almost entirely funded through distributions from the ICC” (Makoni).
“There was a time we genuinely feared the 2021/22 season was going to be a total disaster….The global pandemic had a huge impact on every element of the men’s and women’s game, putting huge pressure on our finances, as tours and matches were either cancelled or postponed and revenue streams destroyed….From a business perspective, we came up with the Zimbabwe Cricket Strategic Plan 2021-2026, which outlines the strategic visions and goals that we have identified to help the organisation realise its full potential and better [fulfill] its mission (Mukuhlani).
“From a business perspective, this was the first season in which we could begin to put the financial impact of the COVID-19 pandemic behind us, and we did with another clean audit outcome” (Mukuhlani).
“This Annual Report spans what has been one of my most challenging times as Zimbabwe Cricket (ZC) Chairman….Over the past five years, we have made significant strides in women’s cricket, including, for the first time in the history of the game in Zimbabwe, giving national contracts to women players and offering allowances to non-contracted women players” (Makoni).
One day you open up the news, and what do you see?
Zimbabwe will be playing 11 Tests in a single year. They are touring England for the first time in 22 years. A Curran brother has chosen to represent them, Sean Williams & Sikandar Raza are still going, Blessing Muzarabani leads the world in Test wickets this year, and even Brendon Taylor is in talks of making a comeback after serving his ICC ban.
So…did this happen overnight?
Well, it did not. Remember, Rome was not built in a day.
Since the 2019 ICC suspension, COVID-19 crisis, and failing to qualify for World Cups, Zimbabwe Cricket quietly got to work. They focused on cleaning up their finances, restructuring debt, and restoring stability in domestic cricket.
Now, with a bit of surplus in hand and increased ICC funding coming soon, they can finally dream a little bigger.
One Test at a time.
****
Thank you all for reading. Please subscribe here and check out other financial and research articles below.
If you Enjoy Reading these Financial Cricket Articles, you may also like:
Unlike David Miller and Rassie van der Dussen, who remain in the international mix with flexible deals, Klaasen has been completely sidelined, a surprising call with the 2026 T20 World Cup and 2027 ODI World Cup in South Africa on the horizon.
Then again, nothing is ever truly surprising with South African cricket.
Their loss may be franchise circuit’s gain. So we ask—With his calendar now wide home, just how much more money can Klaasen earn in a year?
In 2024, Klaasen played 4 ODIs and 15 T20Is. At a rate of $1900 per ODI and $911 per T20I, he earned approximately $21,265 in match fees. Having retired from Test cricket in late 2023, Klaasen likely held a mid-level white-ball only contract worth between $145,000-221,000. In total, his annual earnings from Cricket South Africa (CSA) likely ranged from $166,000-$242,000.
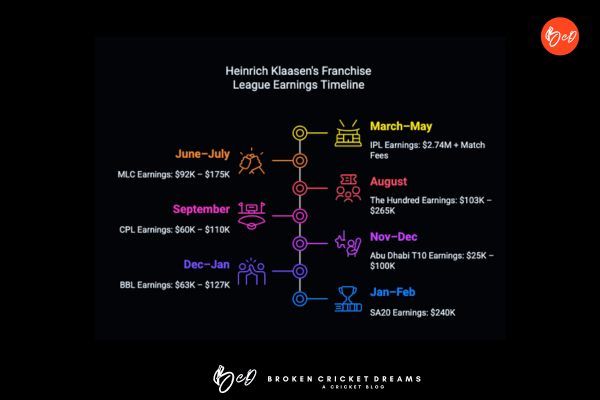
Klaasen is currently active in the SA20, IPL, and MLC. Without international duties, his calendar opens up to other leagues like an entire season of The Hundred (already signed), partial stints in the CPL and the BBL, and possibly a shorter league like the Abu Dhabi T10. Altogether, this could earn him an additional $251,600-$602,000 annually— 4% to 263% increase over his former CSA income, effectively replacing or even exceeding his lost national contract.
In total, Heinrich Klaasen’s earnings from franchise salaries alone will be about $3.5 million-$4.17 million.
Here are some new additions and salary changes in various franchise leagues this year.
The BCCI introduced match fees of about $9000 if a player is included in the Playing XII of an IPL match.
If Klaasen features in at least 10 matches, that is extra $90,000. If he plays all 14 league matches, that rises up to $126,000. If they go through the eliminator, qualifier, and the final, he can earn up to $153,000 extra with IPL match fees alone.
Klaasen was a third draft pick in 2023 at £75,000/$96,186. Third draft pick has increased to £78,500 this year.
Note: Not all franchise tournaments reveal the exact signing amount for an overseas signing/retained player, so we provide a range. Klaasen is a highly sought-after T20 player, so his actual salary may be closer to the higher end.
Heinrich Klaasen’s Current Franchise Contracts ($3.27-$3.57 Million)
Note: Klaasen is unlikely to play in the PSL due to scheduling conflict with the IPL (April–May) since he’s been retained by SRH for the next couple of seasons.
Also, Global T20 Canada is in doubt for 2025 and hence has not been considered in this list.
Projected Calendar (2025-2027)
So now, we are ready to build Klaasen’s projected calendar.
Since the ILT20, BPL, and Super Smash collides with his home tournament SA20, he will not be able to accommodate these leagues and will only have space to play the first half of the Big Bash. In addition, since June-September is action packed T20 season, there will probably not be enough time to take part in the T20 Blast.
Since Klaasen won’t be available for the whole BBL season, I reckon his draft price will closer to the Bronze ($100,000 AUD)-Silver ($200,000 AUD) range, which is $63,600-$127,200 USD. Similarly, for the CPL, where he may only be available for the first half, his salary range may be closer to $60,000-$110,000 rather than $130,000-$190,000.
As a fan, I hope the door has not closed on Klaasen’s return to internationals.
Franchise cricket now owns the calendar. The only real gap? October—which fittingly happens to be when the next ODI World Cup is scheduled.
With the 2026 T20 World Cup on the horizon and a home 2027 ODI World Cup, losing a player of Klaasen’s calibre would be a real shame.
At nearly 34, he is prioritizing his future. So are several others. Kane Williamson and Trent Boult have already taken this route. And I’m sure, many more will follow.
One thing is for certain: As franchises compete for top talent, player salaries will keep rising.
International cricket, though? It may already be on its deathbed.
For a Complete List of Franchise Salaries, you can check out the following:
375 articles and four and a half years later, we are going back to our roots. Thanks to diplomat and cricket enthusiast—Michael Appleton to get me inspired and thinking on these lines again from this tweet:
To every 🏴 🇦🇺 🇮🇳 fan/journalist/former/current player complaining about the format of the WTC: I have a deal for you!
If you’re prepared to give up the five-match Test series that your three countries play, I can design a WTC in which everyone plays everyone the same amount!
That original article explored how to reduce the imbalance of the Big 3 (India, England, Australia) in WTC scheduling, but still keep the ‘marquee’ series like The Ashes or Border-Gavaskar Trophy. However, it was a bit too unrealistic.
Later, I would research how much money it takes to host a Test match and realized that finances are the root of almost all problems in the world of cricket. In all sense of the phrase—It’s the economy, stupid.
Today, I will try to put all of these ideas together and form a combined thesis towards a World Test Championship (WTC) system that (1) can realistically work in today’s world, (2) is financially viable, (3) includes equidistribution of Tests for every team, (4) implements two Test windows, and (5) come up with a realistic value for a Test match fund.
Part I: Solving the Equal Matches Per Team Problem
One of the major issues in the current iteration of the WTC is the imbalance of the number of Tests each team plays. This is due to the influence of the Big 3 as well as the high cost to host a Test.
Current World Test Championship Table
Here are the number of matches each team will play in the 2023-25 WTC cycle:
22 – England
19 – India, Australia
14 – New Zealand, Pakistan
13 – Sri Lanka, West Indies
12 – South Africa, Bangladesh
We can see that the Big 3 play 5-10 Tests more than each nation. This is mainly due to the ‘marquee’ series like Ashes (Aus-Eng), BGT (Aus-Ind), and Ind-Eng.
How can we keep the drama of the marquee series alive but ensure an equal footing for each team?
Solution: Sweet 17—One Match Sacrifice Required by The Big 3
To resolve this issue, we will introduce the two-tiered relegation promotion system.
Each tier will consist of six teams including Zimbabwe, Ireland, and Afghanistan (I mean, why give out Test status when you’re not going to have Afghanistan and Ireland play on a regular basis). We will show this by example with the current Top 6 rankings in the current WTC table.
Tier 1: India, Australia, England, South Africa, New Zealand, Sri Lanka
Tier 2: Pakistan, West Indies, Bangladesh, Ireland, Zimbabwe, Afghanistan
The Constraints
Once we had this framework, the next question was what is the ideal number of matches each team in Tier 1 can play so that (1) there are no two-Test series, (2) each of the six teams plays each other once, (3) there is an equal amount of home and away matches, (4) India-Australia-England get to keep their ‘marquee’ series, and (5) most importantly, each team plays the same number of games.
I treated this challenge as a Sudoku puzzle. And boy was this a tough challenge! (Photos of my scribbling with my earlier attempts are at the bottom of the article for your kind perusal).
20-matches? Too many. 16 matches? Not enough to satisfy all the constraints.
17? Ahh, there’s the goldilocks zone!
Here is the solution I came up with:
Each team plays two 4-Test series and three 3-Test series, for a total of 17 matches each.
The 17 Tests are going to be divided in 7-home, 7-away, and 3-neutral Tests, where each of the Big 3 get to host one neutral series.
The 7-home and 7-away matches will consist of exactly one 4-Test series and one 3-Test series.
Altogether, Tier 1 will consist of exactly 50 Tests.
Top 2 teams will compete in a 3-Test final series at a neutral venue (taking the total to 53 Tests).
The crux? India-Australia and the Ashes have to sacrifice the 5-Test series. I tried adding a 5-4-3 solution (one 5-match series, one 4-match, and one three match series, but it would require NZ-SL to play 5 Tests or the Ashes to be reduced to 3 Tests).
Two 4-match series worked out just right for everybody.
Tier 1 WTC Schedule Breakdown
IND
AUS
ENG
SA
NZ
SL
IND
X
4
4
3
3
3
AUS
4
X
4
3
3
3
ENG
4
4
X
3
3
3
SA
3
3
3
X
4
4
NZ
3
3
3
4
X
4
SL
3
3
3
4
4
X
Total
17
17
17
17
17
17
Legend
Home, Away
Neutral
Ind vs SL in Australia
Aus vs NZ in England
Eng vs SA in India
You can interpret the above table as follows: India hosts England (4 Tests) & New Zealand (3), play away tours to Australia (4 Tests) & South Africa (3), and finally play a 3-Test neutral series against Sri Lanka.
Tier 2 WTC Schedule Breakdown
Each team plays two 3-Test series and three 2-Test series, for a total of 12 matches each.
For this example, since Pakistan is in this tier, the UAE will be chosen as the neutral venue for all neutral matches.
Tier 2 will consist of exactly 36 Tests.
Top 2 teams will compete in a 3-Test final series at a neutral venue (taking the total to 39 Tests).
PAK
WI
BAN
ZIM
IRE
AFG
PAK
X
3
3
2
2
2
WI
3
X
3
2
2
2
BAN
3
3
X
2
2
2
ZIM
2
2
2
X
3
3
IRE
2
2
2
3
X
3
AFG
2
2
2
3
3
X
Total
12
12
12
12
12
12
Home, Away
Neutral
Pak vs Afg in UAE
WI vs Ire in UAE
Ban vs Zim in UAE
At the end of the WTC cycle, the bottom two teams from Tier 1 will be relegated to Tier 2, while both finalists from Tier 2 will be promoted to Tier 1.
Is it Too Much Test Cricket?
No.
Including the final series for both tiers, there will be a total of 92 Test matches in two years.
The first three iterations of the WTC had 61, 70, and 70 matches respectively. 92 here includes 12 Tests each for Zimbabwe, Afghanistan, Ireland and the two final series, which is pretty balanced overall.
The compromise for equal games for each team is that the Big 3 will play 3-5 Tests less than the usual, while the mid-tier teams will play 3-5 more Tests than usual.
In this model, we are asking South Africa, Sri Lanka, and New Zealand to host one 4-Test series in a two-year cycle, but do they have the money? Probably not (and that is why we are also having the neutral Tests hosted in India, England, Australia, or the UAE—countries that can afford it).
We had estimated last year that it takes a mammoth $350,000-$1.4 million to host a Test match and studied why teams like NZ & SA lose money while hosting a Test.
On the other of the spectrum, a series like Ashes can incur costs anywhere from $3-7 million. The cost depends on various factors such as technology, review system, support personnel, hotels, travel, security, etc. One quick example is Australian broadcasting using an 80-camera system for the BGT 2024-25 series.
Higher quality, but comes with higher costs.
Cost Estimation: So, How Much Money is Needed to Sustain a Fair WTC?
To estimate the cost of hosting the WTC, we will first presume that the Tests hosted by Big 3 as well as the two final series (3 Tests each) will be on the higher end of the hosting costs.
India, England, and Australia will each host 8 Teams (7 home + 1 neutral) for a total of 24 matches. The 6 Tests for the two final series will make it about 30 high-quality expensive Tests and 62 Tests on the lower end.
The 62 Tests will cost anywhere from $21.7 million-$86.8 million, while the 30 Tests will take about $70-210 million. Overall, a 92-Test WTC will cost somewhere between $91.7-296.8 million.
Where Will Get the Money From?
The ICC recently mentioned a possible $15 million Test match fund in the form of $10,000 minimum Test fee as well as a ‘touring fee’. That is a step in the right direction, but more targeted funding is needed.
In our WTC model, we are asking SA, SL, and NZ to host about 4 Tests more than they usually do and Afg, Zim, and Ireland to host 5 Tests each more than they usually do. That is about 27 extra Tests, which totals to $9.45 million-$37.8 million.
The ICC had a total surplus of $912 million as of December 2022 and have an estimated $200-$325 million profits in each of the last couple of years. Subsidizing the World Test Championship (WTC) with about 5-15% of their annual profits could solve the money problem.
If $17.5 million can be used to fund seven cricketers in a tournament that lasts less than 60 days, then surely $17.5 million could be found from somewhere (ICC + IPL + BCCI + sponsors) to fund six countries and Test cricket so it exists for the next 60 years.
The money in cricket exists. Just needs to be redistributed properly so that all interested parties are happy.
Note, from the current rankings, Tier 1 countries would include Australia, South Africa, and New Zealand. All of these 3 countries are located in the southern hemisphere and hence, will host all their home Tests in the November-January window, including the coveted Boxing Day Test.
West Indies, England, and Ireland will host both their home test series between the June-August window.
Meanwhile, subcontinental nations (India, Pakistan, Bangladesh, UAE) can be more flexible and host one home series in each window.
Solution: Two 2-Hemisphere Test Match Windows
Here is how a potential two year cycle could look with the two separate windows without overcrowding the international calendar. We try to schedule Test cricket during peak summer times in each hemisphere to gain the most attention.
Test Match Window 1 Matches (November – January)
Tier 1
India in Australia (4 Tests), South Africa in Australia (3 Tests), India vs Sri Lanka in Australia (3 Tests)
Sri Lanka in South Africa (4 Tests), India in South Africa (3 Tests)
South Africa in New Zealand (4 Tests), England in New Zealand (3 Tests)
England in India (4 Tests), England vs South Africa in India (3 Tests)
Australia in Sri Lanka (3 Tests)
Tier 2
Bangladesh in Pakistan (3 Tests)
Afghanistan in Zimbabwe (3 Tests), Pakistan in Zimbabwe (2 Tests)
West Indies in Bangladesh (3 Tests)
Ireland in Afghanistan* (3 Tests)
West Indies vs Ireland in UAE (2 Tests), Bangladesh vs Zimbabwe in UAE (2 Tests)
Test Match Window 2 Matches (June – August)
Tier 1
Australia in England (4 Tests), Sri Lanka in England (3 Tests), Australia vs New Zealand in England (3 Tests)
New Zealand in India (3 Tests)
New Zealand in Sri Lanka (4 Tests)
Tier 2
Zimbabwe in Ireland (3 Tests), Bangladesh in Ireland (2 Tests)
Pakistan in West Indies (3 Tests), Zimbabwe in West Indies (2 Tests)
Bonus: Will West Indies Never Play India or Australia Again in this Model?
I know what you might be thinking.
If India, Australia, or England never relegate and West Indies never get promoted…are the days of the mighty West Indies versus the Australians and Indians over? 60 years of legacy down the drain?
Not quite. We have an addendum for this scenario as well.
One Optional Friendly Series Between the Two Tiers
If both teams agree (and there is space in the international calendar), an optional 1 to 3-match friendly Test series can be played between a country of the first and second tier. In our example, we may have:
India vs Afghanistan
Australia vs Zimbabwe (This is never going to happen, is it?)
Australia vs Pakistan
England vs Ireland
South Africa vs Zimbabwe
New Zealand vs West Indies
Sri Lanka vs Bangladesh
This can serve as (1) a practice tour (India playing Zimbabwe on way to their South Africa series), (2) a promotional event (India-Pakistan one-off Test in UAE), or (3) an actual friendly series to encourage lower-ranked countries to stay serious about Test cricket.
Final Thoughts
Is it the perfect plan?
No. In fact, there is never such a thing as a ‘perfect plan.’
But we can continue to strive for a more perfect system, can’t we?
At least it is good to see that World Test Championship (WTC) is taking flight. 4 years ago, not many took this as a serious competition or offered solutions. Now there is plenty of debate, which is good to see.
In 2020, I was quixotic with my outlook on cricket. Thought anything was possible.
In 2021, I was hopeless, doubting the system at every stage.
By the time we reached 2024, I became practical. And as we approach 2025, I have become a little more realistic.
Hopefully, this solution is actually realistic for the ICC and others in charge of cricket to consider.
****
Thank you all for reading! Comment below (or on social media about your thoughts and suggestions).
PS: Here is some bonus work on trying to find the ideal number of matches each team should play.
How do they compare to the standards of the English county teams? Which domestic teams made the largest strides in the last 1-2 years? And more.
I went through 504 pages of annual reports of these six clubs, so you don’t have to.
Without further ado, let’s jump right in.
Key Takeaways
Western Australia ($43 million profit), South Australia ($3.6 million), New South Wales ($1.4 million), and Queensland ($970,000) made profits in the last year, while Victoria ($180,000 loss) and Tasmania ($1.6 million) suffered narrow losses.
Western Australia ($111 million), South Australia ($101 million), NSW ($99 million), and Victoria ($83 million) have the largest total assets.
The largest total liabilities also lies with Western Australia ($50 million) with NSW ($13 million) coming in next.
Which Australian Domestic Team Earned the Most Money in 2023-2024?
The data provided is from the annual reports of each domestic team with financials accounted for the annual period ending on 30 June, 2024. Note that the ‘total comprehensive income’ (revenue – expenses for the year) is denoted as the ‘annual income’ in the tables below.
Note: All amounts are presented in Australian Dollar (AUD). The conversion between USD and AUD on 11/17/2024 is as follows: $1 AUD = $0.65 USD or $1 USD = $1.55 AUD.
1. Western Australia ($43 Million Profit)
Home Ground: Perth Stadium, WACA
Financial Health Status:Green
Assessment: The WACA Ground Improvement Project (WGIP) grant has inflated the revenues and assets for WA’s 2023-24 financial statement. Altogether Western Australia
“The final net result for the year was a surplus of $43,331,783 ($3,545,655 in 2022-23), achieved after including capital grants relating to the WACA Ground Improvement Project (WGIP) which have been recognised as revenue during the year….The net result from our normal business operations excluding WGIP related items was a deficit of $1,625,663 (surplus of $1,283,001 in 2022-23).“
Highlights from Executive Report
“Our success on and off the field would not have been possible without the support of our growing Membership, with a record number of 4,800 new Members across WACA and Perth Scorchers products this season.”
Other Key Points
Total cost for WGIP is $168,908,797 which will be funded by a combination of the state government ($109.7 million), federal government ($30 million), WA Cricket ($11 million), Cricket Australia ($4 million), and other funding sources. The project is set to be completed by July 2025.
Employee benefit expenses ($24.4 million in 2024 and $20.8 million in 2023) take up the largest portion of WA’s expenses. Contractors and consultant expenses also increased from $3.3 million in 2023 to $4.7 million in 2024.
+2% growth in children 5-12 playing cricket, +3% growth in junior boys, +5% growth in junior girls, +7% girls in Woolworths Cricket Blast, +13% increase in registered participation among women & girls.
“This summer, more than 18,000 Members attended international cricket, including the Men’s Test Match and T20 against the West Indies as well as the Women’s ODI against South Africa. More than 12,000 Members also attended WBBL Strikers games at Adelaide Oval and the Karen Rolton Oval. These numbers show that cricket is alive and well in this passionate sporting state.”
Other Key Points
Employee benefit expenses ($23.4 million – 2024 and $20.7 million – 2023) contributed to their largest expense,, while sales income ($52.6 million) generated the largest share of their income.
18% increase in girls cricket, 32% increase in SACA’s Primary School Cricket Competition, 5,660 registered in Junior cricket for ages 5-12 (4% increase)
Assessment: Although revenue remained steady in 2024, NSW’s expenses have increased this year. Since Cricket Australia’s distribution to NSW’s revenue will not increase, NSW had to make structural reorganization to balance their budgets for the upcoming year.
“Financially, we performed effectively again, recording a small deficit against a break-even operating budget and achieving a better than budget result in our total comprehensive income…Unfortunately, confirmation from Cricket Australia that there would be no increase in their distribution for 2024/25 required us to look at our cost structure and resulted in a reshaping of our organization.”
Highlights from Chairman’s Report
“The game of cricket itself continues to grow around the world. Cricket is now the second most loved sport in the world and the revenues in our game globally have grown substantially. Cricket NSW is determined to ensure Australia doesn’t get left behind…Last year Cricket NSW entered into an arrangement with Major League Cricket in the United States and helped develop the T20 league in that country. And we continue to push the cricketing world to ensure the traditional (and to many the best) format of our great game, Test cricket, doesn’t just survive but thrives.”
Other Key Points
“Cricket balls are one of the biggest expenses clubs incur during the season” and the $10,000 donation from Homestar Finance helped purchase cricket balls for 17 clubs in the region.
Cricket Australia Distributions provided the largest factor in revenue in 2024 ($43.3 million our of $64.1 million).
Players payment pool ($14.6 million), cricket performance ($10.47 million), and match/venue ($10.47 million) were the largest expenses for NSW.
30% increase in 5-12 year old cricket, including 50% increase for 5-12 year old girls.
Assessment: Financially, the revenue and expenses both increased, keeping them relatively stable. However, it was quite evident from the annual report that Queensland is disappointed in not hosting a Gabba Test in the 2026-27 season due to government’s Olympic planning.
“The State Government’s decision to not progress with its commitment to rebuild the Gabba and downgrade its proposed Olympic role has resulted in direct and indirect changes to how we proceed with our business…The most obvious impact will be that for the first time since 1976-77, a Test match will not be held at the Gabba in 2026-27…It is deeply disappointing that the 2026-27 Gabba Test has become a casualty of the uncertainty around the infrastructure planning and development ahead of the 2023 Olympic preparations.”
Highlights from CEO’s Report
“…Queensland Cricket was again able to achieve its budgeted financial surplus target for the year…The surplus amounted to $968,451 (2023: $863,602) which incorporates an amount of $442,142 representing gains from the QCA Future Fund. Excluding this amount, which is not available for general use, the net operating surplus for the year was $526,309.”
Other Key Points
ACIF (Australian Cricket Infrastructure Fund) contributed about $13 million across two rounds in improved cricket facilities and infrastructure.
“Participation in junior club cricket remains flat Statewide and has decreased in some regions.”
On the other hand, girls cricket is growing with 152% and 290% increase in Brisbane North and Bayside East/Redlands regions respectively. North Queensland has also seen a 1,000+ participation increase (27%).
TV viewership for Brisbane Heat in the BBL season average 759K per game. In particular, “Channel Seven’s free to air coverage was a particular highlight…[viewership] increasing by 40%” for Heat matches.
Employee benefits expense ($24.3 million – 2024, $21.2 million – 2023) was the largest expense for Queensland, with ‘state cricket match expenses’ coming next with around $3.8 million for 2024 ($4.3 million for 2023).
“…Cricket Victoria concluded the year reporting a $184,000 deficit for 2023-24…Pleasingly, key BBL revenue streams including ticketing and sponsorship continued to grow and return towards pre COVID levels. We also saw growth continuing across our new revenue streams – Cricket Victoria Foundation, School Holiday Programs and Melbourne Cricket Education Academy. Additional costs were incurred through the BBL season, as well as set up costs associated with the roll-out of new revenue initiatives that are planned for FY25 including the Victoria Health Club and Melbourne Cricket Academy.”
Highlight from Director’s Report
“Costs increased versus prior year, notably in employee related expenses reflecting the increase in payments to both male and female players. Employee expenses also rose with new roles added to support revenue growth initiatives and high performance, as well as general cost of living and legislated increases.”
Other Key Points
Men/boy’s participation grew 7.3%, women’s/girl’s participation grew 14.3% with over 41,000 boys/girls registered in the 5-12 year age group.
Over 60 projects received $1.3 million from ACIF for infrastructure improvement.
Employee, player, volunteer, and contractor benefit expenses was the largest expense incurred by Cricket Australia ($29.7 million – 2024, $25.7 million – 2023).
Home Ground: Bellerive Oval, Macquare Point Stadium, UTAS Stadium
Financial Health Status:Yellow
Assessment: While revenue streams remained steady for Tasmania between 2023 & 2024, expenses increased by about $4.5 million. The annual report offered positive outlook nevertheless with growing popularity, investment, and awareness of the sport in Tasmania.
“Investment in infrastructure is imperative from a professional and game development point of view, and the Macquarie Point Stadium project presents an exciting opportunity for sport in our State and for young Tasmanians to fulfill their dreams at home. I am firmly of the view that this is the sort of positive change that can set both Tasmania and cricket up to thrive in the future.”
After going through all these annual reports, one thing is clear—Australian cricket is thriving!
Membership is growing, investment and infrastructure development projects are on the rise, and the growth in junior girls cricket is on the rise as well. No wonder Australia continues to dominate world cricket and win trophies in both women’s and men’s cricket. They have a prospering and financially stable domestic system.
A common theme between all the teams was that expenses increased from 2023 to 2024 due to employee benefit and payment increase, which is probably a good thing. As long as the revenue continues to increase as well, the future looks good for Australian cricket.
****
Thanks for reading!
Before you Go, Please Check out my Book on Amazon on the Life Lessons from the Border Gavaskar Trophy!
That got me thinking—How expensive is it to watch cricket around the world?
To conduct this analysis, I went through the checkout process and attempted to buy tickets for different types of matches in the first 10 Test playing nations.
If you would like to listen to an engaging conversational AI generated podcast about this article, check this out.
Key Takeaways
England & Australia are the most expensive places to watch cricket (they also have the most opportunities to watch along with India). Ticket prices can range from $185-1400 in a season for England to watch a couple of days of Tests, a few County matches, a few Hundred & Vitality Blast games, and 2-3 limited over internationals.
On the other hand, in Bangladesh, Sri Lanka, and Zimbabwe, a fan can watch matches for as low as $1 USD and can watch several games in a season for about $100 on the higher end.
Watching domestic cricket is completely FREE in India, New Zealand, and South Africa (both List A & 4-day). All you need to do is show up at the stadium (So GO, what are you waiting for?)
Cost of Watching Cricket: Most Expensive Places to Watch Cricket Around the World
We will provide ranges and consider a few different categories (if data is available):
Limited Over Internationals (LOI) – both men’s & women’s
Test Matches
Domestic Competitions
Franchise Leagues
For the sake of the cost comparison, we will be looking at General Admission ticket for Adult guests (in some countries like England, ‘members’ of the club receive discounted prices given that they have paid the annual membership fee). This analysis does not include member prices, bundles, or other discounts (or service/handling fees & taxes).
Note: These are ballpark ranges. Ticket prices may vary based on the match (for example, knockout and Finals matches may be more expensive) and the stadium.
If a spectator in England watched 2 days of a men’s Test, 5 County games, 1 men’s international, 2 Vitality Blast matches, 2 Hundred matches, 1 ODI cup, one women’s international, and 1 Women’s Hundred match in a season, they would spend (on tickets alone) between $260-$504 depending on the stadium and up to $1393.3 if they only chose premium seating.
Monthly Cost of Living: $1929
Average Monthly Net Salary: $3288.55
Annual Inflation Rate: 2.5%
Estimated Monthly Savings: $1359.55
Percent of Savings Spent on Cricket (Live): 4.54%-34.16%
*These economic numbers are for the United Kingdom as a whole, not just England.
Type of Match
General Admission Ticket Price (Adult)
Premium Tickets
A Day of a Test
£38-85 ($50.6-113.1)
£95-145 ($126.6-192.9)
Men’s LOI
£20-40 ($26.6)
£135 ($179.9)
Women’s LOI
£5-10 ($6.7-13.3)
£65 ($86.6)
County
£6-15 ($8.0-20.0)
£23 ($30.6)
Vitality Blast
£15-25 ($20-33.3)
£150 ($199.5)
The Hundred
£11 ($14.7)
£35 ($46.6)
One Day Cup
£5-20 ($6.7-26.6)
£37 ($49.2)
*These are ticket prices for non-members
How Did We Estimate the Ticket Price Range?
The international costs above are estimated from the upcoming England-Zimbabwe Test, India-England Women T20I series, and the men’s South Africa-England series, while the domestic costs are a ballpark number based on perusing several County’s websites.
Note: The prices for domestic price tickets in England vary vastly based on the County/stadium. For example, Kia Oval is at the more expensive side: £15-20 for County Championship matches, £32-40 for Vitality Blast, £40-85 for a men’s T20I, £18-30 for a women’s T20I, and £85-145 for a Test match.
Other Costs: Car Parking (£5+), Guided Tours: (£0-30), Full Season Membership (£240-270), Food, Drinks, Concessions (varies)
Where To Buy Tickets: Tickets can be purchased on the County, stadium, or ECB website. For international matches, you have to enter a ballot and hence, may not be guaranteed a ticket if there is high demand.
If a cricket fan in Australia went to watch 2 days of a men’s Test, 1 ODI, 1 Sheffield Shield match, 2 BBL matches, one women’s international, and 1 WBBL match in a season, they would spend (on tickets alone) at least $180 AUD ($122.6 USD)and as much as $900 $(613 USD) if they chose the premium seating.
Monthly Cost of Living: $1,944
Average Monthly Net Salary: $3,819.73
Annual Inflation Rate: 3.5%
Estimated Monthly Savings: $1875.73
Percent of Savings Spent on Cricket (Live):2.2%-10.89%
Day 4 Tickets: For the Boxing Day Test MCG, the General Admission has a starting price for $30 with reserve stands as high as $85.
Type of Match
General Admission Ticket Price (Adult)
Premium Tickets/Lounge/SkyDeck
A Day of a Test
$30 AUD ($20.4 USD)
$170 AUD ($115.8 USD)
Men’s LOI
$30 ($20.4)
$170 ($115.8)
Women’s LOI
$20 ($13.6)
Domestic Cricket
$10 ($6.8)
Franchise Cricket(BBL)
$27.5 ($18.7)
$165 ($112.4)
WBBL
$10 ($6.8)
*Note: For some Tests (for example, Adelaide BGT, there are ‘Twilight Adult’ prices if the entry is after 5 PM at a discounted price of $22.5).
Watching 2 days of a Test, 2 SuperSmash matches, a men’s limited overs game, and a women’s limited over game can cost anywhere between $109 to $160 in a season.
Monthly Cost of Living: $1782
Average Monthly Net Salary: $3156.96
Annual Inflation Rate: 3.1%
Estimated Monthly Savings: $1,374.96
Percent of Savings Spent on Cricket (Live):1.96%-2.81%
Type of Match
General Admission Ticket Price (Adult)
Premium Tickets
A Day of a Test
$45 NZD ($28 US)
$70 NZD ($43.6)
Men’s LOI
$35 ($21.8)
$65 ($40.5)
Women’s LOI
$20 ($12.5)
Domestic Cricket
FREE
SuperSmash
$15 ($9.4)
*Note: A Test Match Pass (all 5 days) can be purchased, which ranges from $145-220 NZD.
Entry to Plunkett Shield (first class) and Ford Trophy (List A) are free.
Two days of a men’s Test, 1 Men’s ODI, 1 Women’s ODI, and 2 SA20 matches in Bangladesh would cost a spectator somewhere in the range of $44-89 in one season.
Monthly Cost of Living: $974
Average Monthly Net Salary: $1446.04
Annual Inflation Rate: 4.9%
Estimated Monthly Savings: $472.04
Percent of Savings Spent on Cricket (Live):3.1%-6.3%
In India, watching 2 days of a men’s Test, 1 ODI, 2 IPL matches, 1 women’s international, and 1 WPL match in a season, would cost (on tickets alone) between $30-140 on the lower end and about $294 on the higher end over a season. Keep in my end, that or certain IPL teams like RCB, tickets can go as high as $634 alone!
Monthly Cost of Living: $423
Average Monthly Net Salary: $633.49
Annual Inflation Rate: 4.6%
Estimated Monthly Savings: $210.49
Percent of Savings Spent on Cricket (Live): 14.25%+
*This is a bit skewed since population of India has widespread economic disparity. Those who can probably afford to purchase tickets are the only ones that would purchase those premium/VIP tickets.
Type of Match
General Admission Ticket Price (Adult)
Premium/VIP
A Day of a Test
INR 125-200 ($1.5-2.4)
INR 1000-2000 ($12-24)
LOI
INR 750 ($9)
INR 10000 ($119.8)
Women’s International
FREE*
INR 150 ($1.8)
Domestic Cricket
FREE
IPL
INR 700-5000 ($8.4-60)
INR 5000-52938 ($59.9-$634.4)
WPL
INR 100-500 ($1.2-6)
As per Hindustan Times, “Pricing is decided as per demand and supply, affordability, culture, and the eagerness of the people to pay” when it comes to IPL prices. Hence, there is a wide range in IPL tickets depends on which player/teams are playing and when the ticket has been purchased.
Here are some other notes:
Non-international matches are free to attend.
*The entry to women’s Test between India & South Africa was free, while the T20Is were priced for INR 150.
Long story short, watching sports can be a fun and expensive experience.
Final Thoughts
The main thought of writing this article was to answer the question, “Is cricket affordable for the common man?”
With rising cost of living standards around the world and mobile/TV accessibility of cricket, are boards doing enough to incentivize followers to go to the ground?
In general, cricket is not as expensive as other sports. However, if Test cricket is to survive, £95 Day 4 tickets is probably not going to help.
If the trend continues, cricket will become only an elitist game. It began as an elitist game, but do we want to keep it that way?
If you are interested in cricket & finance, consider checking out the following:
Umpires bringing out their light meters out is a common sight in England’s overcast conditions.
We cannot control the weather. So, how can we fix this?
Several proposals have come up over the years: Better Drainage systems (see Sri Lanka), pink ball all the time (especially England), and earlier starts in the day for late-summer months.
All are good ideas, but let’s consider another idea that has been vaguely mentioned—A covered or ‘retractable’ stadium.
Remember that one stadium where the Shahid Afridi hit 12 runs in one ball? Yep, that’s the one.
Key Takeaways
In one of our previous analysis, “How Much Money Does It Take to Host a Test Match?,” we estimated that it takes about $350,000-$1.4 million per 5-day Test depending on the technology used i.e. about $70,000-$280,000 per day of cricket.
It takes about $100-$150 million to add a retractable roof in a stadium (although in some cases the expenses ballooned up to $300 million). For maintenance & repairs, a future budget between $20-30 million needs to be kept aside.
It would take about 357-4,286 days of rain affected matches for the cost of the retractable roof to recover*
In England’s 2024 home season (men’s), six days were rain-affected, one of which was washed out and 5 others were affected by bad light. In 2023, 9 Tests & 5 ODIs were impacted by rain, five of which were no results or complete wash outs. At least 2-5 Hundred matches were marred by rain as well.
The 2024 T20 World Cup had 8 rain-affected games with four abandonments, while the 2019 ODI WC in England had 3 washouts, 4 reduced matches, and one two-day semi-final contest.
*If the roof is only used for international cricket and no other sport
The NFL cannot afford to lose millions of advertising dollars due to weather or unnecessary delays, so they are more inclined to pick stadiums with a covered roof.
Rick Schlesigner, the CEO of Brewers said that he is “very pleased with the roof.” As of 2018, the roof had been used 4,014 times and had “delivered its promise to fans.”
What About Maintenance?
Building the stadium is only a part of the equation, recurring repair & maintenance costs is the other. Brewers’ have estimated that future repairs, maintenance, ironworkers, engineers, roofers will cost about $37.1 million.
Building NFL stadiums is already a costly endeavor. According to Constructive Dive, the overall construction cost for the SoFi Stadium in Los Angeles cost a record $5.5 billion (most expensive stadium ever built), Mercedes-Benz Stadium in Atlanta was about $1.5 billion, and the U.S. Bank Stadium in Minneapolis was about $1.2 billion.
Similar, the owner of the MLB team, New York Mets, estimated that it would take them $800 million to add a retractable roof, while it would have only costed $125 million if it were to be installed during construction.
Here are a few examples of stadiums from different sports and how much their construction cost for a covered stadium. This is not an exhaustive list by any means.
Although cricket was a pioneer in adopting technologies like Hawkeye, it is way behind in architectural investment and innovation.
Archibald Stadium – Carrier Dome ($26.85 Million)
Sport: College Football
Location: Syracuse, New York
Capacity: 40,000
In 1980, Carrier Dome at Syracuse University was one of the first covered domes and the largest collegiate dome. It cost about $27 million back then. The dome was later renovated in 2021 for $118 million.
Huntington Bank Field, Cleveland Browns ($2.4 Billion – Proposed)
Sport: NFL
Location: Cleveland, Ohio
Capacity: 70,000
The proposed $2.4 billion investment for the dome would be split between public and private financing, making the $1.2 billion allocated for private investment as the largest private per capita stadium investment in the country.
This stadium will utilize ethylene tetrafluoroethylene (ETFE), essentially a plastic-see through roof. This is based of other stadiums that have used ETFE like the Allianz Arena in Munich, Dunedin’s Forsyth Barr Rugby stadium (cost around $200 million overall), Las Vegas bowl, and Bejing.
The ‘Big O’ Montreal Stadium ($875 Million – Proposed)
Sport: Olympics Stadium
Location: Montreal, Canada
Capacity: 73,000
*Note: The 1976 Olympic stadium is getting a makeover with the roof itself costing $875 million. The replacement roof will not be retractable, but will be translucent to allow for sunlight.
In most cases, the city that hosts the stadium is responsible for paying for any stadium, construction, and repair costs.
Influx of private partnership is helping alleviate some of the costs that the local government gets burdened with.
Due to the complex funding structure, the planning and construction process can go through political interference, red tape, delays, and budget overruns.
How Will A Retractable Stadium in Cricket Impact Playing Conditions?
Playing conditions play a major role in cricket.
Will the amount of swing decrease in England? Do we want natural elements to go out of the game?
To find out how much money cricket lost to rain, we first figured out how many days were affected by rain.
We will consider the last three home seasons for the England’s men’s team as well the last few ICC tournaments.
England Home Season (Men’s)
*Note: W/O denotes complete wash out. N/R denotes No Result
2024 Season
Rain Affected/Wet Outfield
Bad Light
3rd T20I v Pak (W/O) 3rd Test v WI, Day 2 1st Test vs SL, Day 2 1st Test vs SL, Day 3 3rd Test vs SL, Day 3
1st Test vs WI, Day 1 1st Test vs SL, Day 1 2nd Test vs SL, Day 3 3rd Test vs SL, Day 1 Day 2 Day 3
2023 Season
Rain Affected/Wet Outfield
Ashes 1st Test, Day 3 1st Test, Day 5 2nd Test, Day 1 2nd Test, Day 3 3rd Test, Day 3 4th Test, Day 4 4th Test, Day 5 (W/O) 5th Test, Day 4 5th Test, Day 5 Ire v Ban, 1st ODI (N/R) Ire v Ban, 2nd ODI(45-over ODI) Ire v Eng, 1st ODI (W/O) Ire v Eng, 3rd ODI (N/R) NZ v Eng, 2nd ODI (34-over ODI)
*Note: Not many matches were affected by Bad Light in 2023, most of the interruptions were all rain/wet outfield related.
2022 Season
Rain Affected/Wet Outfield
Bad Light
1st Test* v Ind, Day 2 Day 3 Day 5 (W/O) 2nd Test* v Ind, Day 1 5th Test v Ind, Day 1 Day 2 Day 3 1st Test v NZ, Day 3 2nd Test v NZ, Day 2 3rd Test v NZ, Day 1 Day 3 Day 5 2nd ODI v SA (29-over ODI) 3rd ODI v SA (N/R) 1st Test v SA, Day 1 3rd Test v SA, Day 1 (W/O) Day 2 (W/O)
1st Test v Ind, Day 2 2nd Test v Ind, Day 4 3rd Test v Ind, Day 3 4th Test v Ind, Day 3 3rd Test v SA, Day 3 SA, Day 4
*Note: We exclude these matches from our calculations since the 1st 4 Tests of the Pataudi Trophy were held in 2021
ICC & Other Tournaments
2024 T20 World Cup
2024 (M): Match 6 (N/R), Match 23 (W/O), Match 30 (W/O), Match 33 (W/O), Match 34 (10-over), Match 44 (11.2-over DLS), Match 50 (17-over DLS), Match 52 (19-over DLS)
2023 (W): Match 18 (8.2-over DLS)
ODI World Cup
2023 (M): Match 35 (25.3-Overs DLS)
2022 (W): Match 5 (27-over), Match 20 (20-over), Match 23 (N/R), Aus-WI SF (45-over)
2019 (M): Match 7 (41-over), Match 11 (W/O), Match 16 (W/O), Match 18 (W/O), Match 21 (48-over), Match 22 (40-over DLS), Match 25 (49-over), Ind-NZ SF (2 days)
2017 (W): Match 6 (W/O), Match 21 (24-over DLS), Ind-Aus SF (42-over)
The Hundred
2024 (W): Match 21 (W/O), Match 32 (N/R)
2024 (M): Match 21 (N/R), Match 29 (44-balls), Match 30 (N/R), Match 32 (30-balls)
2023 (W): Match 2 (W/O), Match 3 (W/O), Match 6 (W/O), Match 7 (W/O), Eliminator (N/R)
2023 (M): Match 2 (40-balls), Match 6 (N/R), Match 7 (W/O), Match 11 (NR), Match 18 (90-balls)
2022 (M/W): None
Note: We only consider England’s home season and The Hundred. County Championship, Royal One Day Cup, and the T20 Vitality Blast lose a number of matches.
For a sport that seems to be struggling financially on a larger scale, adding a retractable roof in cricket is, in most cases, a bad idea.
Of course, we cannot build a retractable in every stadium. However, countries that can afford and/or have a dire need may be able to afford this on a case-by-case basis.
For example, the Wankhede, Eden Gardens, or the Narendra Modi Stadium in India, SSC in Sri Lanka, Lord’s in England (in case they host the WTC Final for the next 100 years), and the MCG in Australia for some of the larger occasions.
Richer leagues like the NFL & MLB may help subsidize the cost of ultra-expensive stadiums in the USA. With IPL’s growing wealth, the BCCI may be able to help subsidize these types of stadium enhancements around the world as well. Who knows.
What do you think?
Anyway, retractable roofs in cricket are just one part of the alternative. We will do deep dive into how drainage systems work in cricket and other sports at a different time.
 (400 x 100 px) (4)")